| Param | Original file | Final file |
|---|---|---|
| Filename | modeM0/AS1A11_047T10_9000004778_33263cztM0_level2.evt | modeM0/AS1A11_047T10_9000004778_33263cztM0_level2_quad_clean.evt |
| Size (bytes) | 452,799,360 | 68,322,240 |
| Size | 431.8 MB | 65.2 MB |
| Events in quadrant A | 2,562,796 | 450,929 |
| Events in quadrant B | 4,262,468 | 440,397 |
| Events in quadrant C | 2,549,407 | 431,323 |
| Events in quadrant D | 4,017,953 | 414,373 |
| Mode M0 | |||
|---|---|---|---|
| Quadrant | BADHDUFLAG | Total packets | Discarded packets |
| A | 0 | 11055 | 832 |
| B | 0 | 16974 | 1329 |
| C | 0 | 11004 | 773 |
| D | 0 | 16560 | 1229 |
| Mode SS | |||
|---|---|---|---|
| Quadrant | BADHDUFLAG | Total packets | Discarded packets |
| A | 0 | 104 | 6 |
| B | 0 | 105 | 9 |
| C | 0 | 104 | 8 |
| D | 0 | 104 | 6 |
| Mode M9 | |||
|---|---|---|---|
| Quadrant | BADHDUFLAG | Total packets | Discarded packets |
| A | 0 | 20 | 1 |
| B | 0 | 20 | 1 |
| C | 0 | 20 | 1 |
| D | 0 | 21 | 0 |
| Quadrant | Total seconds | Saturated seconds | Saturation percentage |
|---|---|---|---|
| A | 4728 | 50 | 1.057530% |
| B | 4722 | 608 | 12.875900% |
| C | 4725 | 66 | 1.396825% |
| D | 4715 | 120 | 2.545069% |
Noise dominated data is calculated using 1-second bins in cleaned event files. If a bin has >2000 counts, and if more than 50% of those come from <1% of pixels, then it is considered to be noise-dominated and hence unusable.
| Quadrant | # 1 sec bins | Bins with >0 counts | Bins with >2000 counts | High rate bins dominated by noise | Noise dominated (total time) | Noise dominated (detector-on time) | Marked lightcurve |
|---|---|---|---|---|---|---|---|
| A | 7078 | 4756 | 29 | 29 | 0.41% | 0.61% | 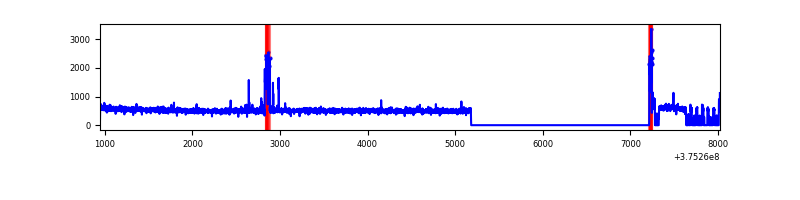 |
| B | 7078 | 4742 | 459 | 459 | 6.48% | 9.68% | 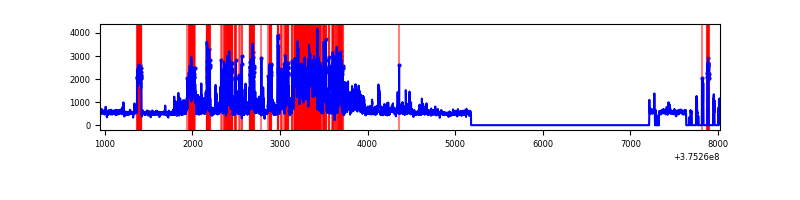 |
| C | 7078 | 4752 | 48 | 48 | 0.68% | 1.01% | 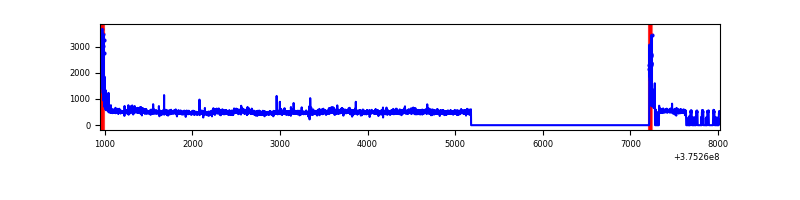 |
| D | 7078 | 4733 | 87 | 87 | 1.23% | 1.84% | 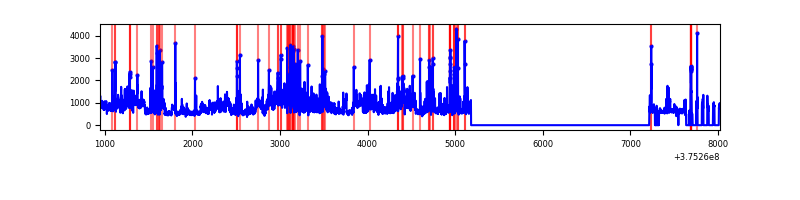 |
Top three noisy pixels from each quadrant. If the there are fewer than three noisy pixels in the level2.evt file, extra rows are filled as -1
| Pixel properties | Quadrant properties | ||||||
|---|---|---|---|---|---|---|---|
| Quadrant | DetID | PixID | Counts | Sigma | Mean | Median | Sigma |
| A | 15 | 169 | 139495 | 1139.48 | 620 | 610 | 121.9 |
| A | 0 | 31 | 14237 | 111.8 | 620 | 610 | 121.9 |
| A | 13 | 6 | 9992 | 76.97 | 620 | 610 | 121.9 |
| B | 5 | 172 | 1177114 | 10901.53 | 576 | 564 | 107.9 |
| B | 0 | 219 | 504442 | 4668.77 | 576 | 564 | 107.9 |
| B | 5 | 200 | 262024 | 2422.6 | 576 | 564 | 107.9 |
| C | 0 | 10 | 186659 | 1389.85 | 584 | 587 | 133.9 |
| C | 14 | 67 | 48137 | 355.17 | 584 | 587 | 133.9 |
| C | 10 | 49 | 17625 | 127.26 | 584 | 587 | 133.9 |
| D | 8 | 195 | 904247 | 5740.53 | 588 | 574 | 157.4 |
| D | 2 | 250 | 184617 | 1169.12 | 588 | 574 | 157.4 |
| D | 12 | 218 | 158789 | 1005.05 | 588 | 574 | 157.4 |
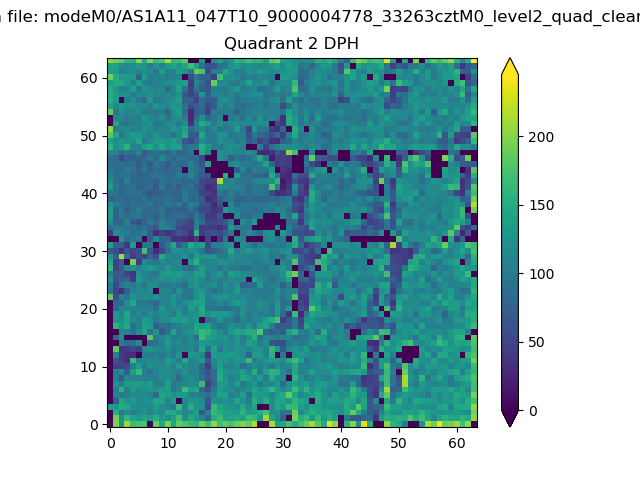
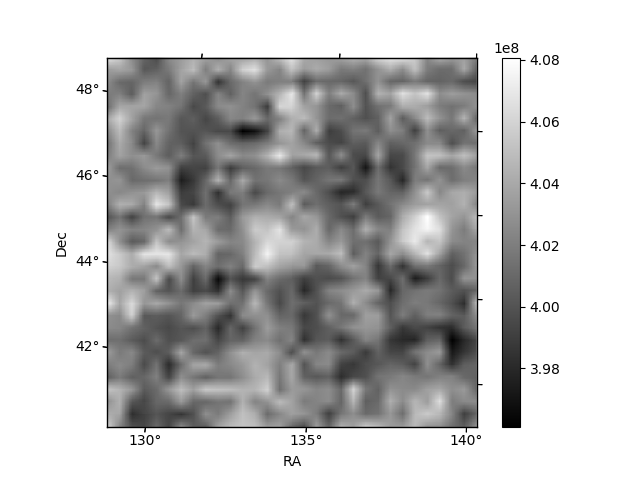
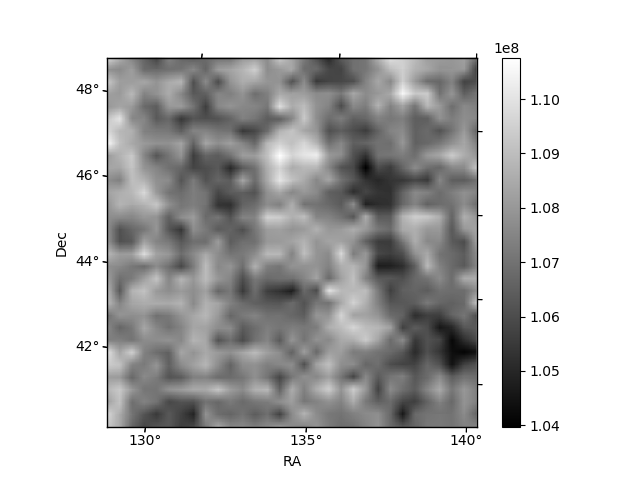
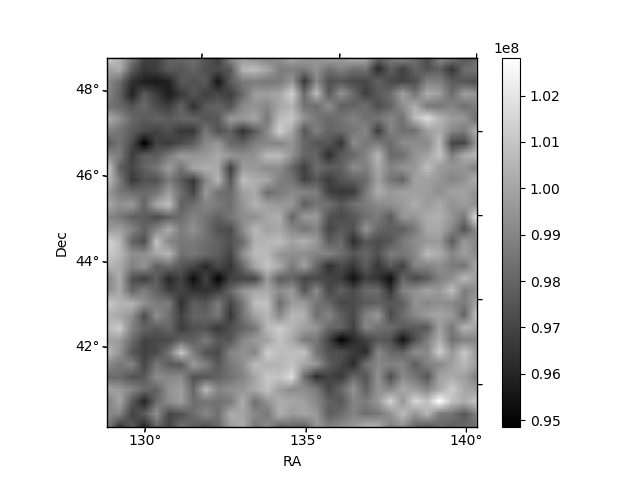
Histogram calculated using DETX and DETY for each event in the final _common_clean file
| Quadrant A | 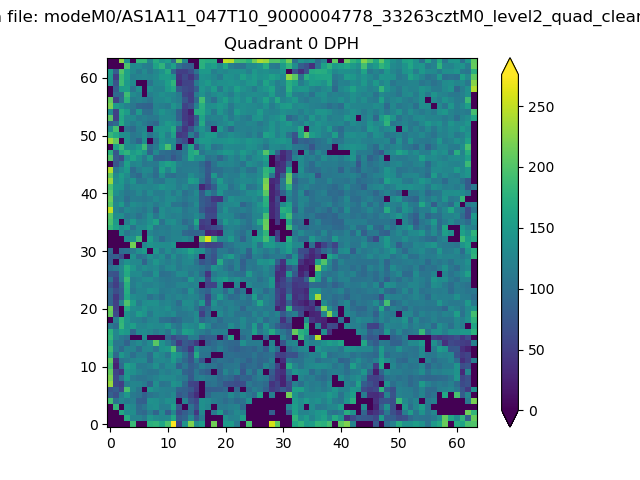 |
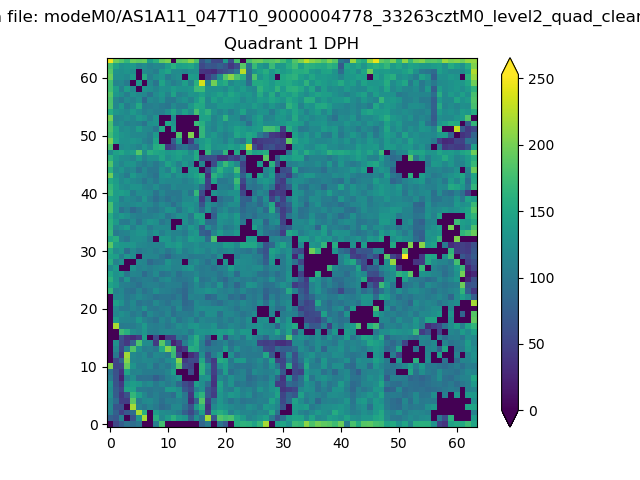 |
Quadrant B |
|---|---|---|---|
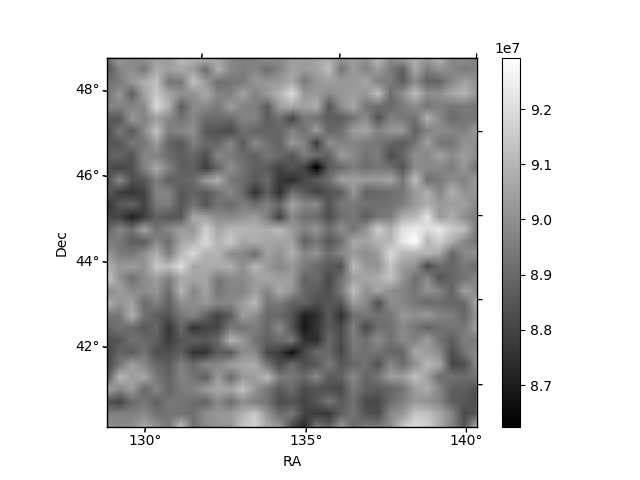
| Quadrant D | 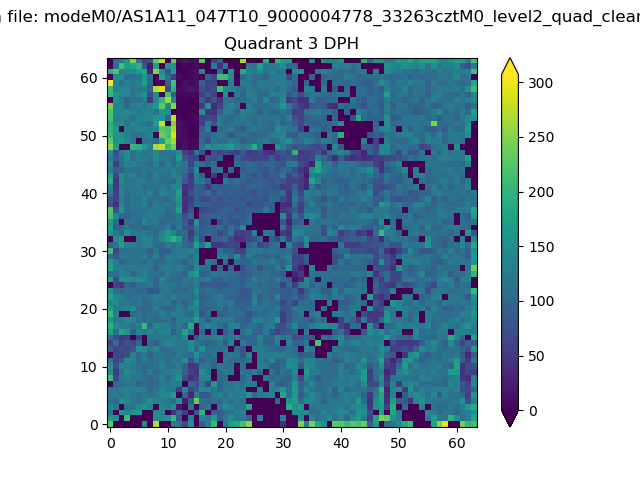 |
 |
Quadrant C |
| Plot type | Count rate plots | Images |
|---|---|---|
| Comparison with Poisson distribution Blue bars denote a histogram of data divided into 1 sec bins. Red curve is a Poisson curve with rate = median count rate of data. |
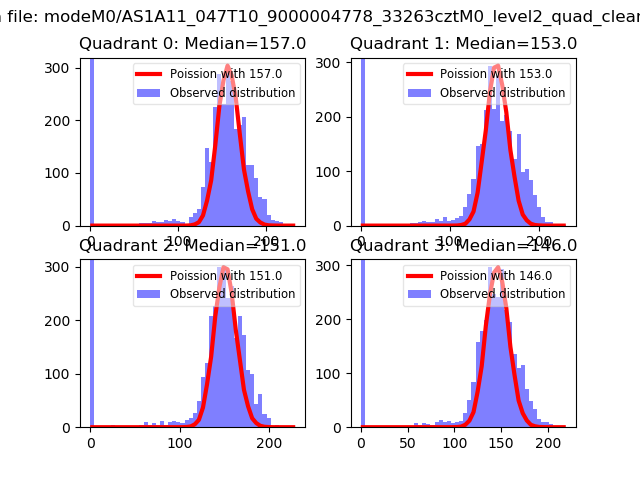 |
 |
| Quadrant-wise count rates Data is divided into 100 sec bins |
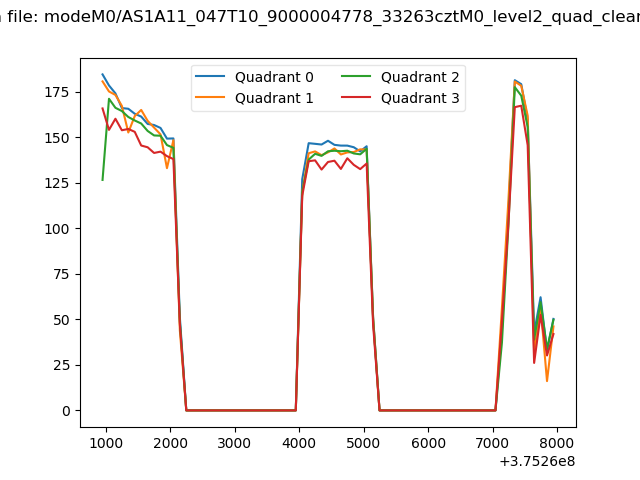 |
|
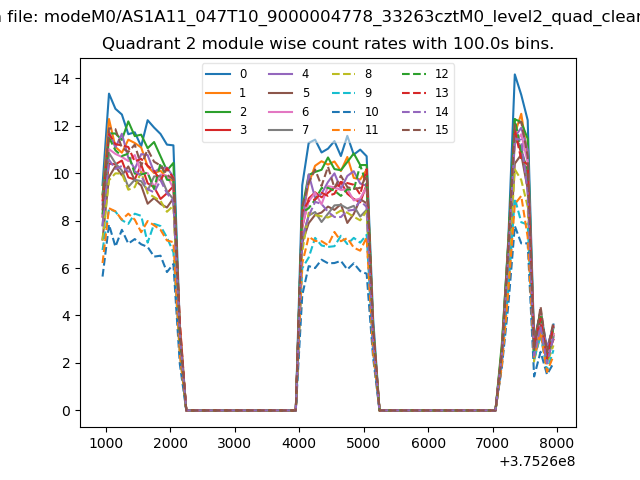
| Module-wise count rates for Quadrant A Data is divided into 100 sec bins |
 |
 |
| Module-wise count rates for Quadrant B Data is divided into 100 sec bins |
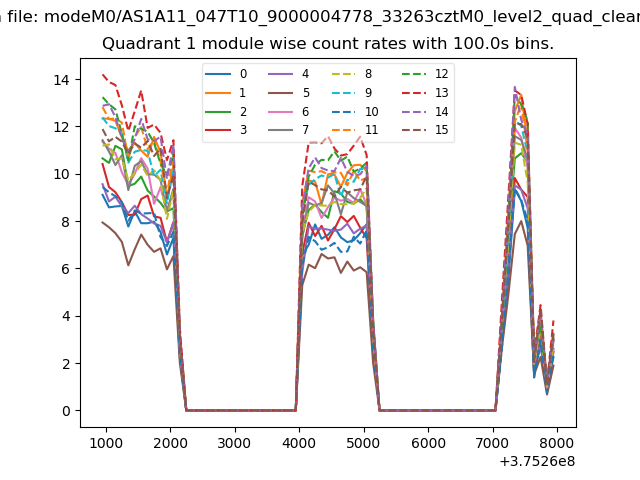 |
 |
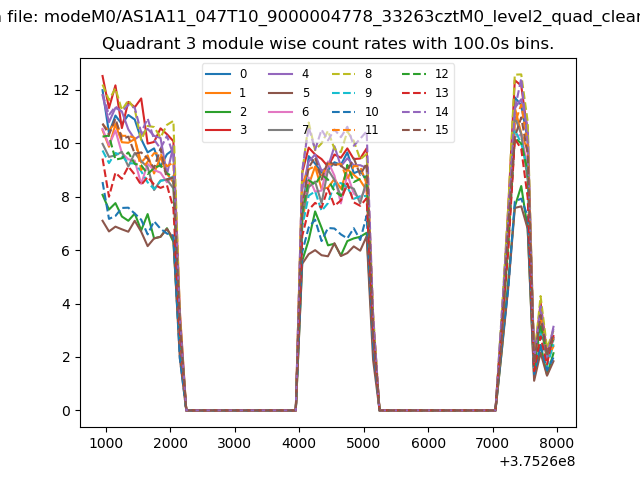
| Module-wise count rates for Quadrant C Data is divided into 100 sec bins |
 |
 |
| Module-wise count rates for Quadrant D Data is divided into 100 sec bins |
 |
 |
| Parameter | Plot |
|---|---|
| CZT HV Monitor | 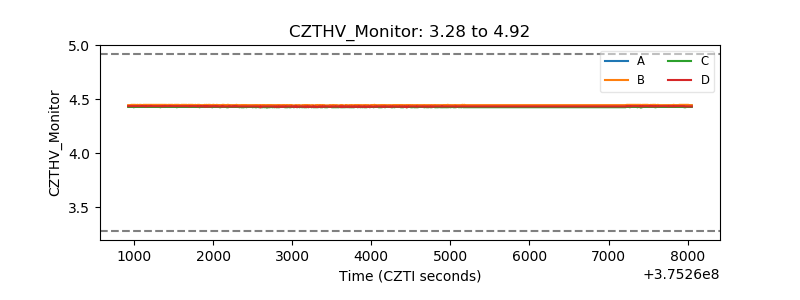 |
| D_VDD | 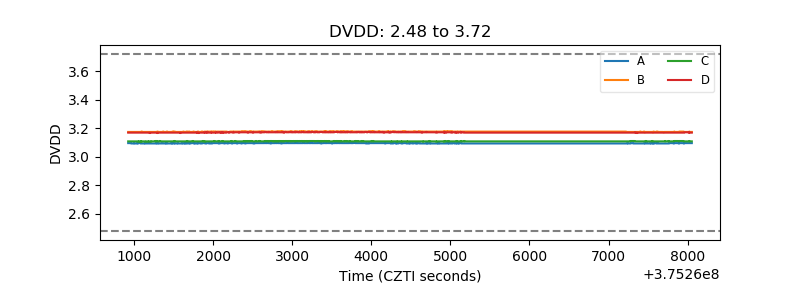 |
| Temperature 1 |  |
| Veto HV Monitor | 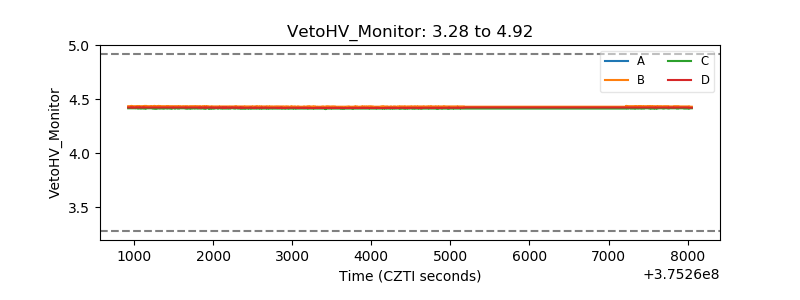 |
| Veto LLD | 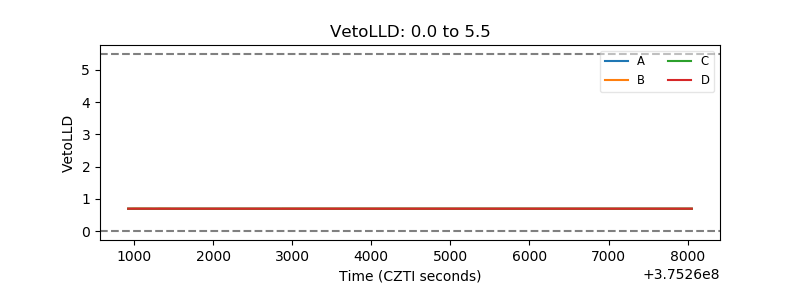 |
| Alpha Counter | 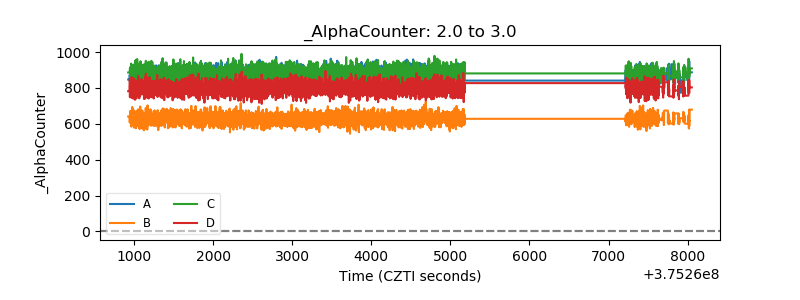 |
| _CPM_Rate | 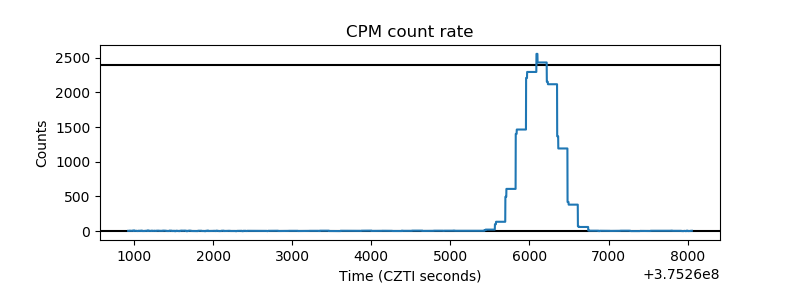 |
| CZT Counter | 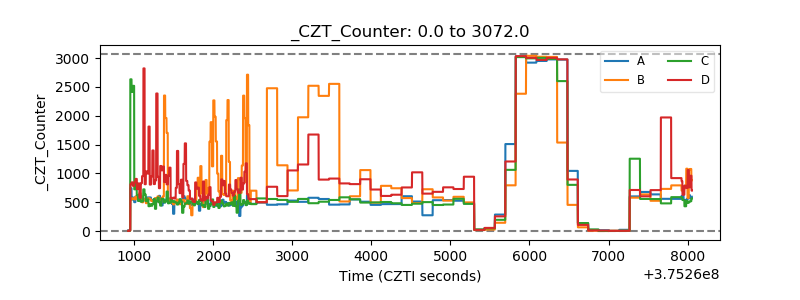 |
| +2.5 Volts monitor |  |
| +5 Volts monitor |  |
| _ROLL_ROT | 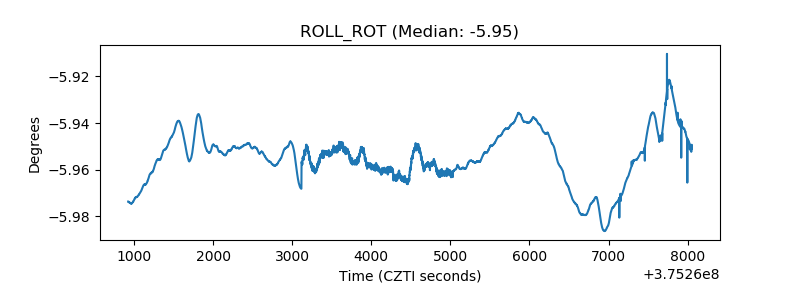 |
| _Roll_DEC | 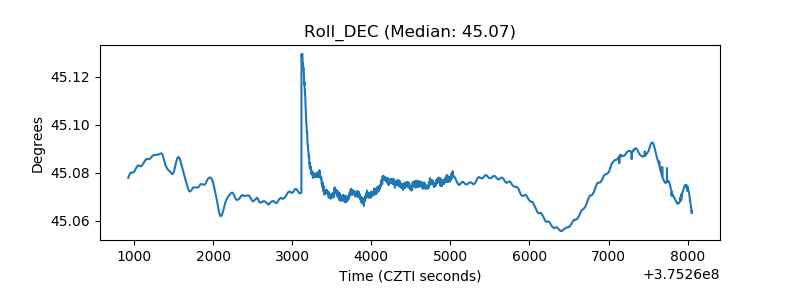 |
| _Roll_RA | 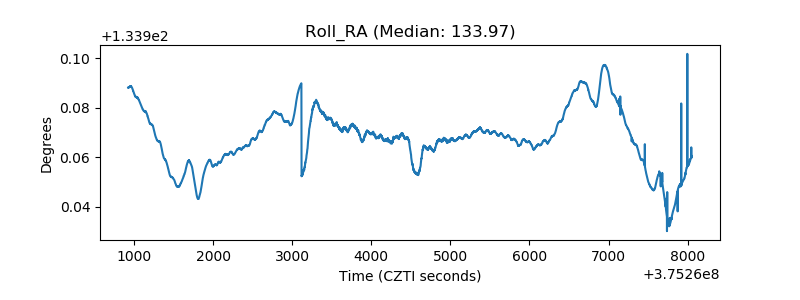 |
| Veto Counter |  |