| Param | Original file | Final file |
|---|---|---|
| Filename | modeM0/AS1A11_047T10_9000004778_33264cztM0_level2.evt | modeM0/AS1A11_047T10_9000004778_33264cztM0_level2_quad_clean.evt |
| Size (bytes) | 543,081,600 | 64,658,880 |
| Size | 517.9 MB | 61.7 MB |
| Events in quadrant A | 2,751,601 | 425,064 |
| Events in quadrant B | 4,208,006 | 414,590 |
| Events in quadrant C | 3,388,732 | 409,416 |
| Events in quadrant D | 5,760,403 | 357,493 |
| Mode M0 | |||
|---|---|---|---|
| Quadrant | BADHDUFLAG | Total packets | Discarded packets |
| A | 0 | 11018 | 2 |
| B | 0 | 15795 | 1 |
| C | 0 | 13049 | 1 |
| D | 0 | 20694 | 1 |
| Mode SS | |||
|---|---|---|---|
| Quadrant | BADHDUFLAG | Total packets | Discarded packets |
| A | 0 | 102 | 0 |
| B | 0 | 102 | 0 |
| C | 0 | 102 | 0 |
| D | 0 | 102 | 0 |
| Mode M9 | |||
|---|---|---|---|
| Quadrant | BADHDUFLAG | Total packets | Discarded packets |
| A | 0 | 21 | 0 |
| B | 0 | 21 | 0 |
| C | 0 | 21 | 0 |
| D | 0 | 21 | 0 |
| Quadrant | Total seconds | Saturated seconds | Saturation percentage |
|---|---|---|---|
| A | 5005 | 14 | 0.279720% |
| B | 5005 | 362 | 7.232767% |
| C | 5005 | 76 | 1.518482% |
| D | 5005 | 905 | 18.081918% |
Noise dominated data is calculated using 1-second bins in cleaned event files. If a bin has >2000 counts, and if more than 50% of those come from <1% of pixels, then it is considered to be noise-dominated and hence unusable.
| Quadrant | # 1 sec bins | Bins with >0 counts | Bins with >2000 counts | High rate bins dominated by noise | Noise dominated (total time) | Noise dominated (detector-on time) | Marked lightcurve |
|---|---|---|---|---|---|---|---|
| A | 7098 | 5006 | 9 | 9 | 0.13% | 0.18% | 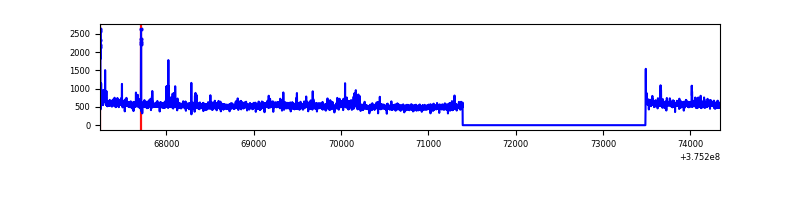 |
| B | 7098 | 5006 | 272 | 272 | 3.83% | 5.43% | 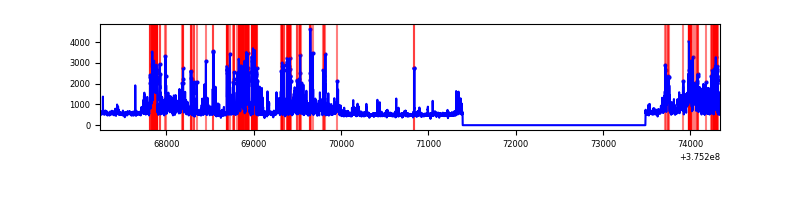 |
| C | 7098 | 5006 | 66 | 66 | 0.93% | 1.32% | 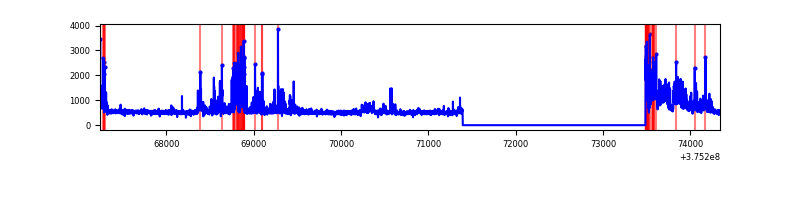 |
| D | 7098 | 5006 | 735 | 735 | 10.36% | 14.68% | 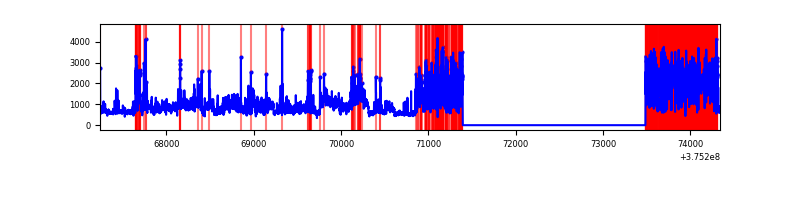 |
Top three noisy pixels from each quadrant. If the there are fewer than three noisy pixels in the level2.evt file, extra rows are filled as -1
| Pixel properties | Quadrant properties | ||||||
|---|---|---|---|---|---|---|---|
| Quadrant | DetID | PixID | Counts | Sigma | Mean | Median | Sigma |
| A | 15 | 169 | 126528 | 950.8 | 673 | 662 | 132.4 |
| A | 13 | 210 | 14494 | 104.49 | 673 | 662 | 132.4 |
| A | 13 | 6 | 10960 | 77.79 | 673 | 662 | 132.4 |
| B | 5 | 172 | 846821 | 7134.66 | 637 | 623 | 118.6 |
| B | 0 | 219 | 449688 | 3786.26 | 637 | 623 | 118.6 |
| B | 5 | 200 | 291603 | 2453.38 | 637 | 623 | 118.6 |
| C | 10 | 49 | 660832 | 4593.47 | 637 | 644 | 143.7 |
| C | 0 | 10 | 117886 | 815.75 | 637 | 644 | 143.7 |
| C | 15 | 159 | 95784 | 661.97 | 637 | 644 | 143.7 |
| D | 12 | 218 | 1844145 | 11384.97 | 589 | 576 | 161.9 |
| D | 8 | 195 | 956295 | 5902.05 | 589 | 576 | 161.9 |
| D | 7 | 223 | 119956 | 737.23 | 589 | 576 | 161.9 |
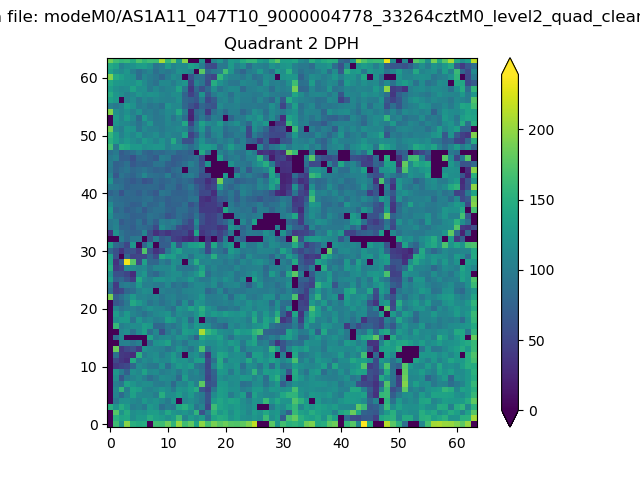
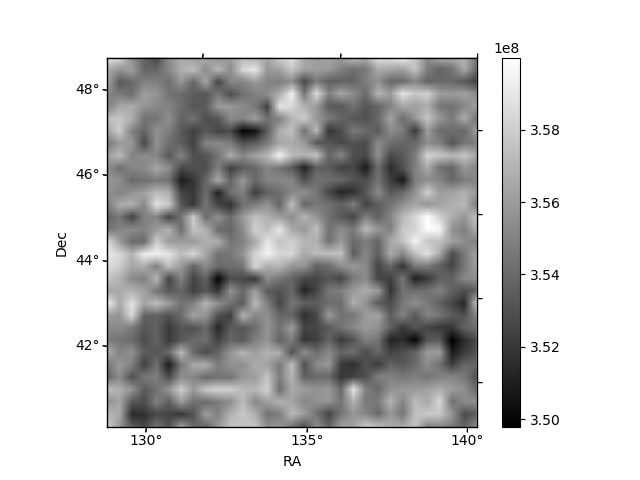
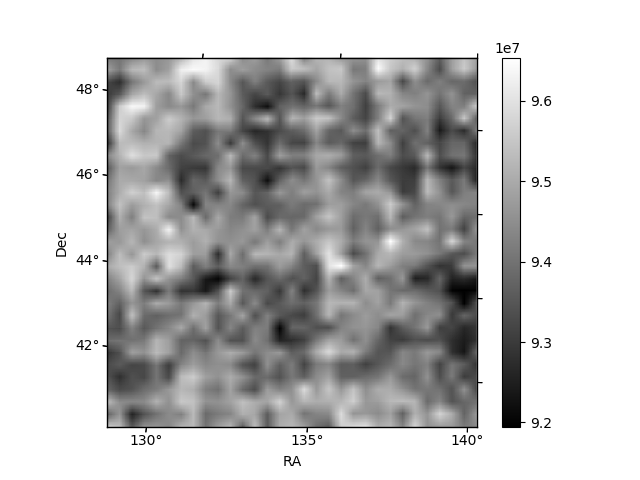
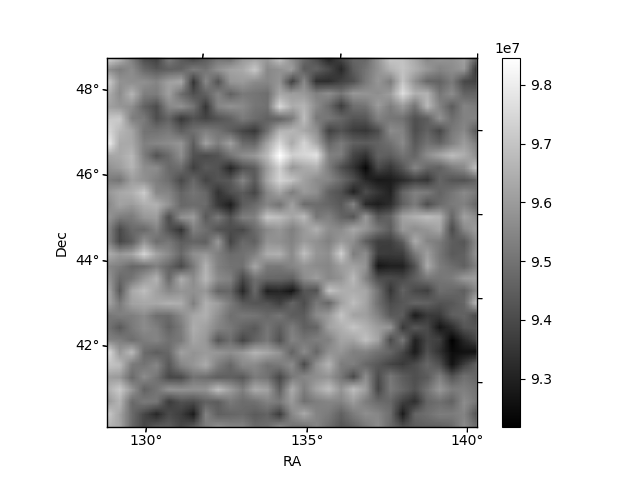
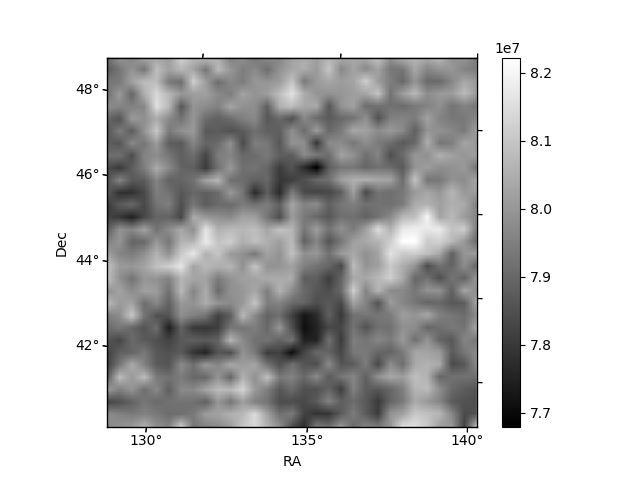
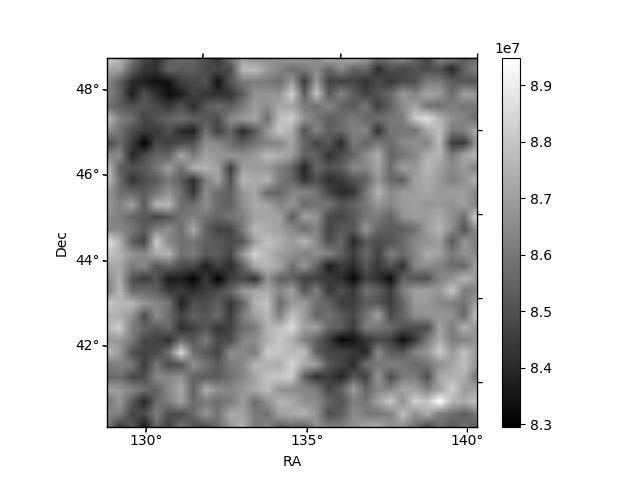
Histogram calculated using DETX and DETY for each event in the final _common_clean file
| Quadrant A | 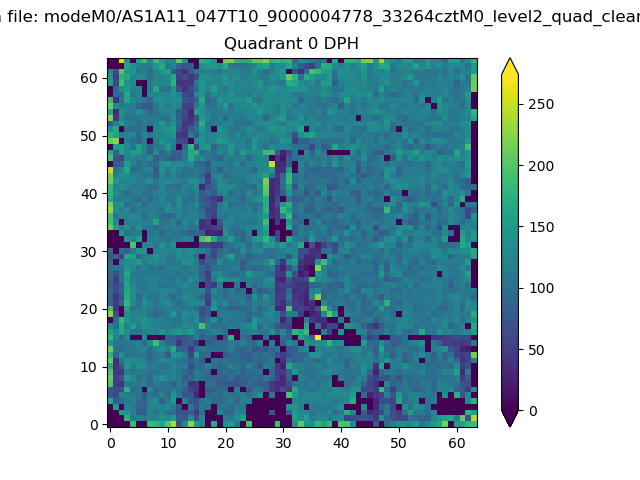 |
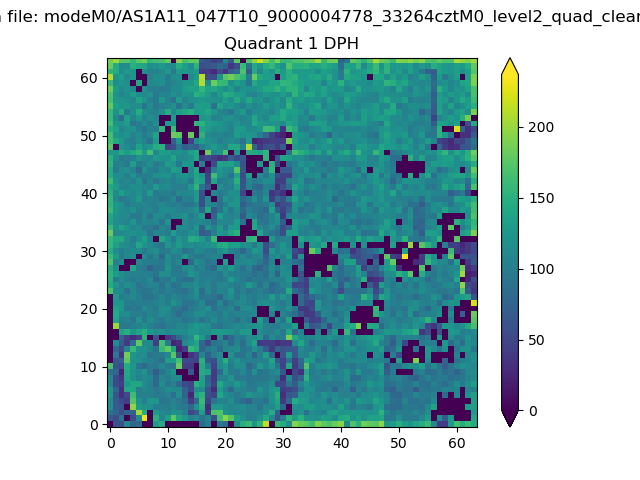 |
Quadrant B |
|---|---|---|---|
| Quadrant D | 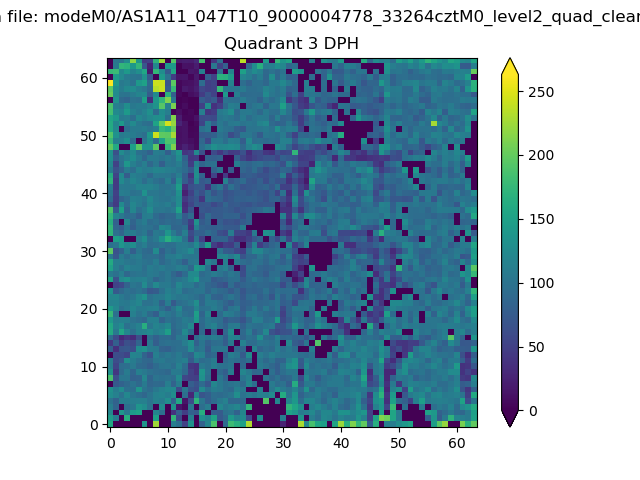 |
 |
Quadrant C |
| Plot type | Count rate plots | Images |
|---|---|---|
| Comparison with Poisson distribution Blue bars denote a histogram of data divided into 1 sec bins. Red curve is a Poisson curve with rate = median count rate of data. |
 |
 |
| Quadrant-wise count rates Data is divided into 100 sec bins |
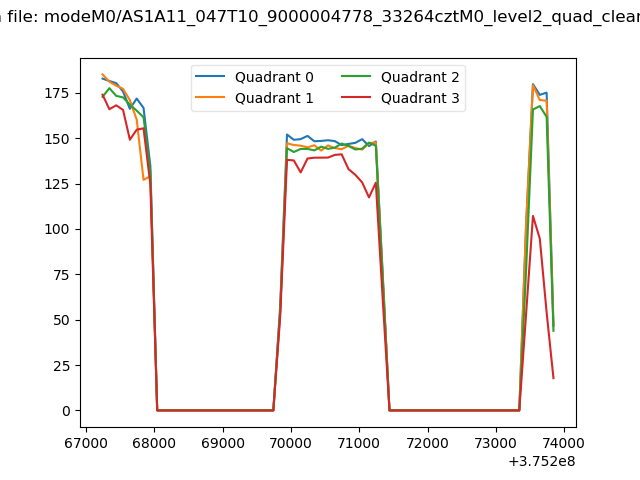 |
|
| Module-wise count rates for Quadrant A Data is divided into 100 sec bins |
 |
 |
| Module-wise count rates for Quadrant B Data is divided into 100 sec bins |
 |
 |
| Module-wise count rates for Quadrant C Data is divided into 100 sec bins |
 |
 |
| Module-wise count rates for Quadrant D Data is divided into 100 sec bins |
 |
 |
| Parameter | Plot |
|---|---|
| CZT HV Monitor |  |
| D_VDD | 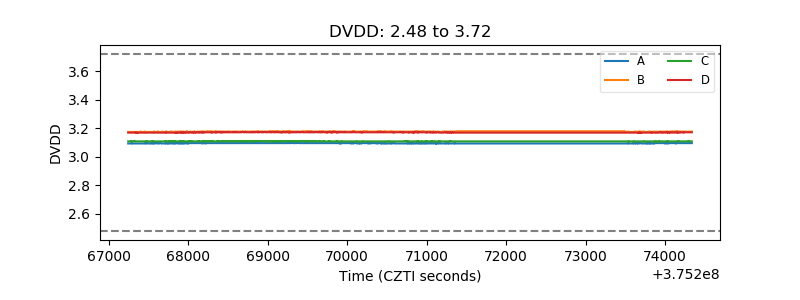 |
| Temperature 1 | 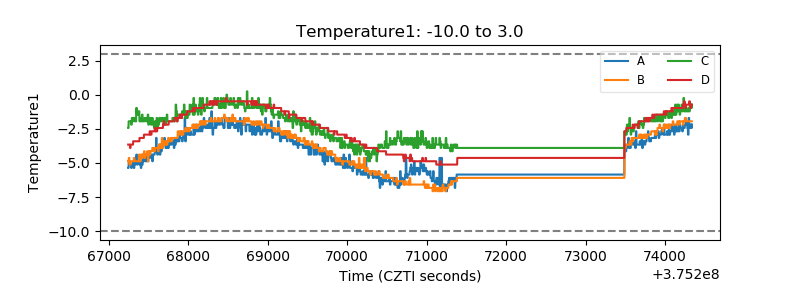 |
| Veto HV Monitor |  |
| Veto LLD | 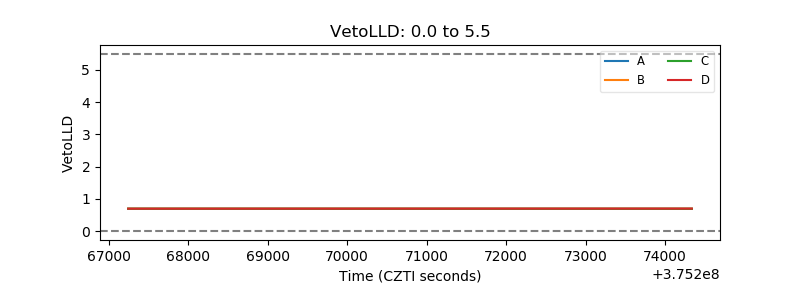 |
| Alpha Counter | 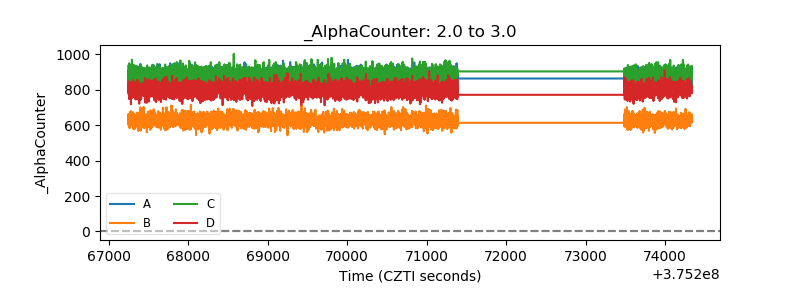 |
| _CPM_Rate | 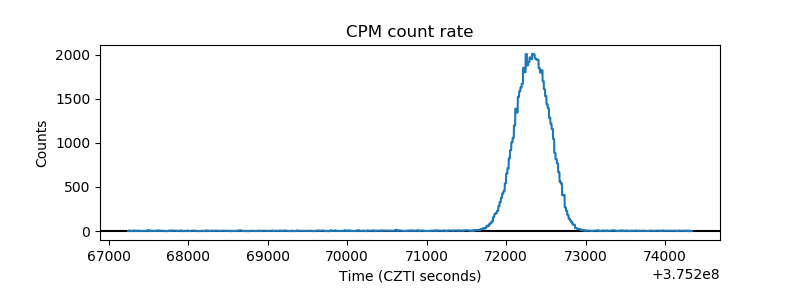 |
| CZT Counter | 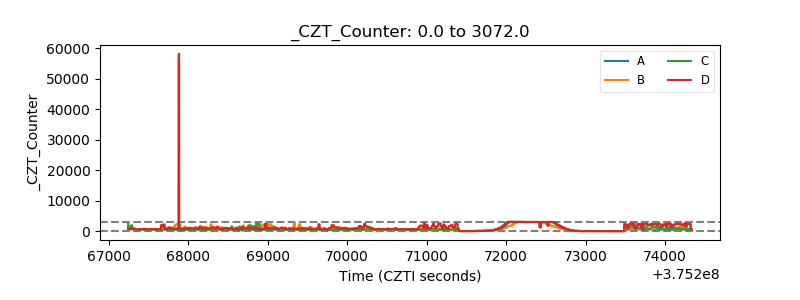 |
| +2.5 Volts monitor |  |
| +5 Volts monitor |  |
| _ROLL_ROT |  |
| _Roll_DEC |  |
| _Roll_RA | 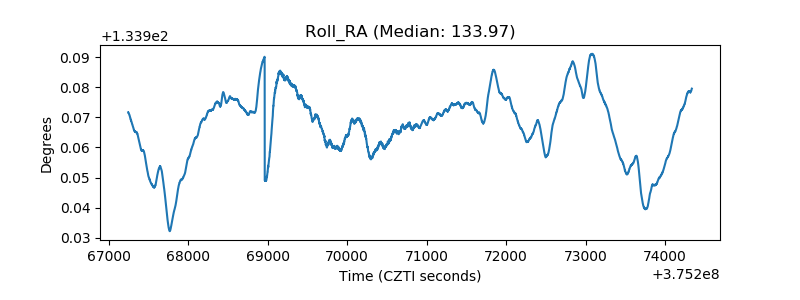 |
| Veto Counter |  |