| Param | Original file | Final file |
|---|---|---|
| Filename | modeM0/AS1A11_047T10_9000004778_33265cztM0_level2.evt | modeM0/AS1A11_047T10_9000004778_33265cztM0_level2_quad_clean.evt |
| Size (bytes) | 575,006,400 | 55,085,760 |
| Size | 548.4 MB | 52.5 MB |
| Events in quadrant A | 2,715,978 | 345,664 |
| Events in quadrant B | 4,661,352 | 331,373 |
| Events in quadrant C | 3,377,090 | 332,288 |
| Events in quadrant D | 6,306,062 | 291,833 |
| Mode M0 | |||
|---|---|---|---|
| Quadrant | BADHDUFLAG | Total packets | Discarded packets |
| A | 0 | 10973 | 3 |
| B | 0 | 17214 | 2 |
| C | 0 | 13151 | 2 |
| D | 0 | 22415 | 2 |
| Mode SS | |||
|---|---|---|---|
| Quadrant | BADHDUFLAG | Total packets | Discarded packets |
| A | 0 | 108 | 0 |
| B | 0 | 108 | 0 |
| C | 0 | 108 | 0 |
| D | 0 | 108 | 0 |
| Mode M9 | |||
|---|---|---|---|
| Quadrant | BADHDUFLAG | Total packets | Discarded packets |
| A | 0 | 26 | 0 |
| B | 0 | 26 | 0 |
| C | 0 | 26 | 0 |
| D | 0 | 27 | 0 |
| Quadrant | Total seconds | Saturated seconds | Saturation percentage |
|---|---|---|---|
| A | 5226 | 6 | 0.114811% |
| B | 5226 | 602 | 11.519326% |
| C | 5226 | 87 | 1.664753% |
| D | 5226 | 1032 | 19.747417% |
Noise dominated data is calculated using 1-second bins in cleaned event files. If a bin has >2000 counts, and if more than 50% of those come from <1% of pixels, then it is considered to be noise-dominated and hence unusable.
| Quadrant | # 1 sec bins | Bins with >0 counts | Bins with >2000 counts | High rate bins dominated by noise | Noise dominated (total time) | Noise dominated (detector-on time) | Marked lightcurve |
|---|---|---|---|---|---|---|---|
| A | 7349 | 5227 | 0 | 0 | 0.00% | 0.00% | 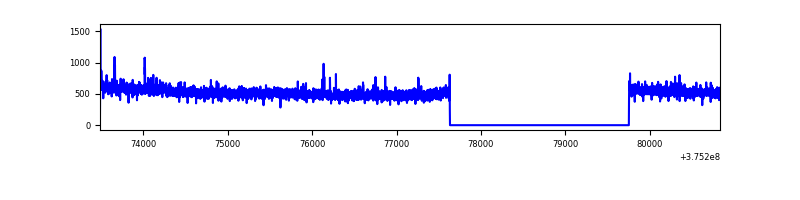 |
| B | 7349 | 5227 | 432 | 432 | 5.88% | 8.26% | 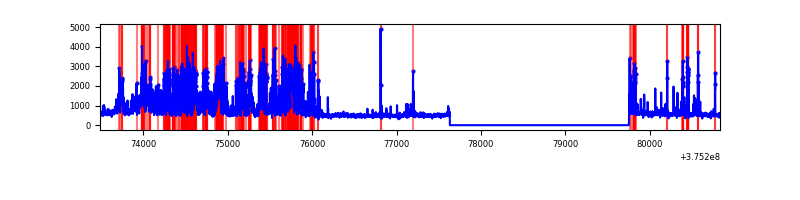 |
| C | 7349 | 5227 | 72 | 72 | 0.98% | 1.38% |  |
| D | 7349 | 5227 | 836 | 836 | 11.38% | 15.99% | 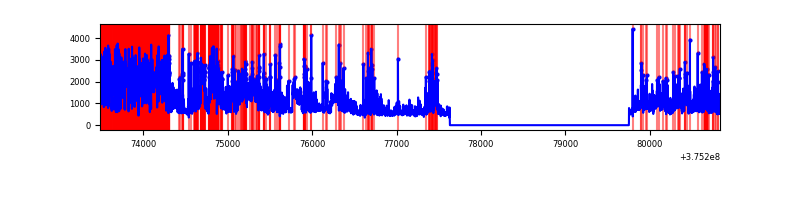 |
Top three noisy pixels from each quadrant. If the there are fewer than three noisy pixels in the level2.evt file, extra rows are filled as -1
| Pixel properties | Quadrant properties | ||||||
|---|---|---|---|---|---|---|---|
| Quadrant | DetID | PixID | Counts | Sigma | Mean | Median | Sigma |
| A | 15 | 169 | 30058 | 217.32 | 688 | 677 | 135.2 |
| A | 13 | 6 | 12534 | 87.7 | 688 | 677 | 135.2 |
| A | 13 | 254 | 9512 | 65.35 | 688 | 677 | 135.2 |
| B | 5 | 172 | 1506584 | 12550.6 | 644 | 629 | 120.0 |
| B | 0 | 219 | 309336 | 2572.76 | 644 | 629 | 120.0 |
| B | 5 | 200 | 91151 | 754.41 | 644 | 629 | 120.0 |
| C | 10 | 49 | 553117 | 3718.62 | 655 | 661 | 148.6 |
| C | 0 | 10 | 141371 | 947.13 | 655 | 661 | 148.6 |
| C | 15 | 214 | 52350 | 347.92 | 655 | 661 | 148.6 |
| D | 12 | 218 | 1626451 | 9866.89 | 598 | 586 | 164.8 |
| D | 8 | 195 | 1040612 | 6311.61 | 598 | 586 | 164.8 |
| D | 2 | 249 | 439540 | 2663.88 | 598 | 586 | 164.8 |
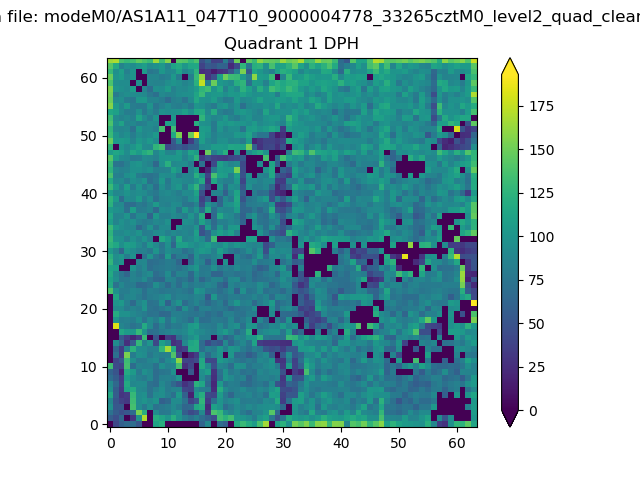
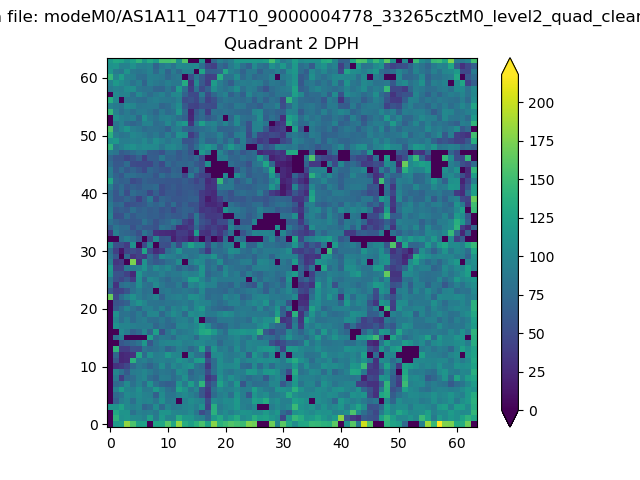
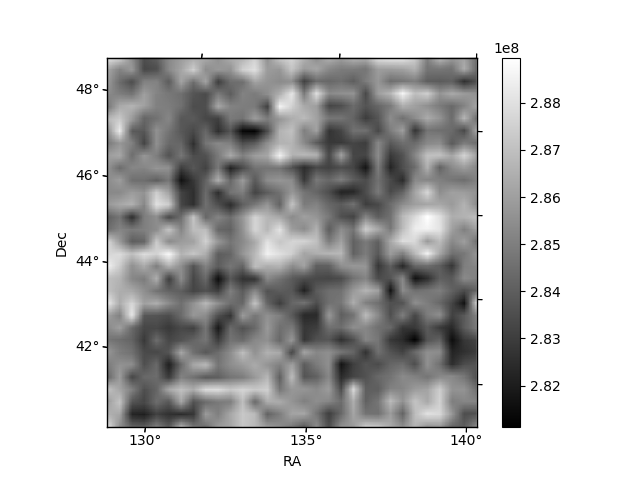
Histogram calculated using DETX and DETY for each event in the final _common_clean file
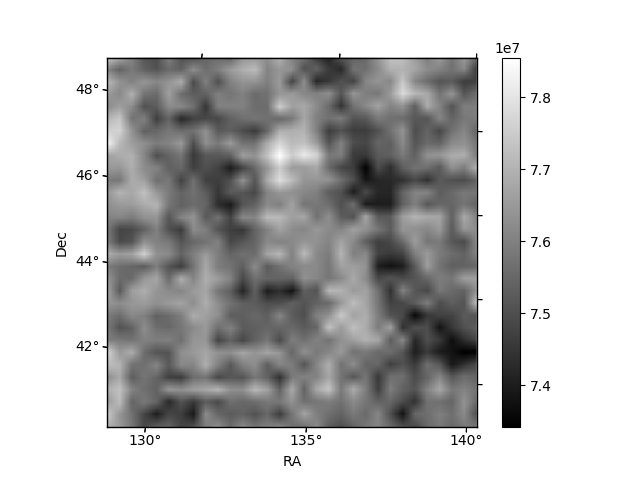
| Quadrant A | 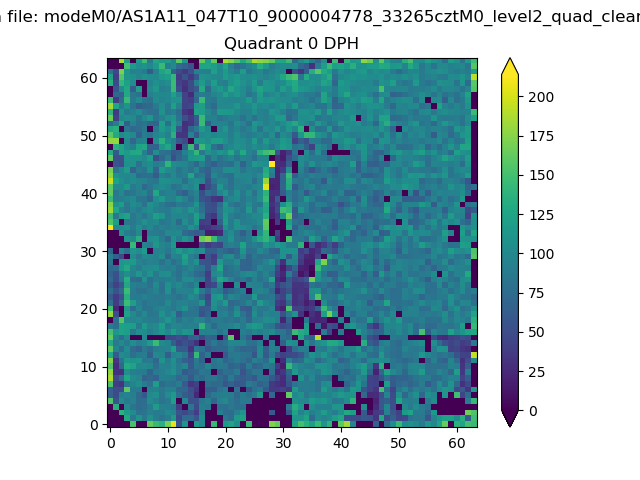 |
 |
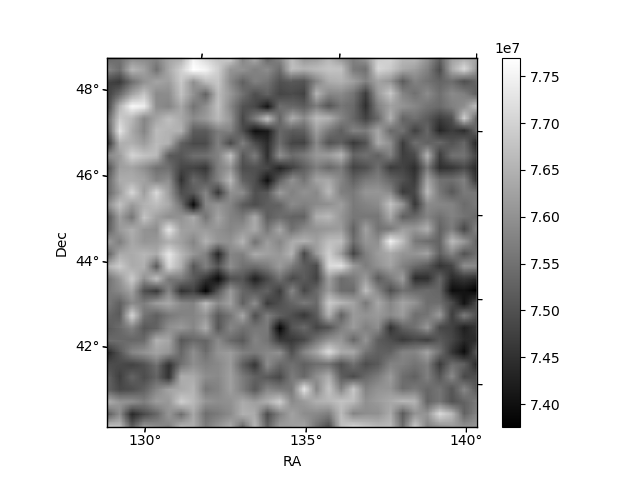
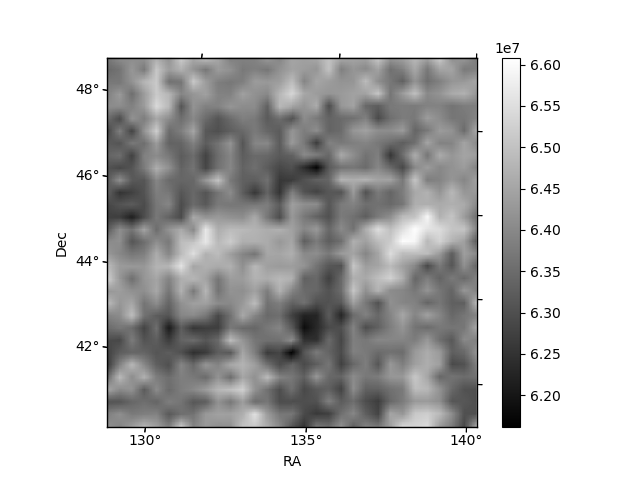
Quadrant B |
|---|---|---|---|
| Quadrant D | 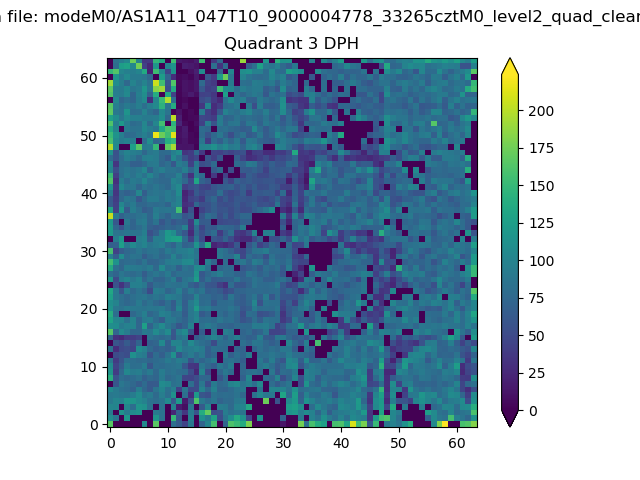 |
 |
Quadrant C |
| Plot type | Count rate plots | Images |
|---|---|---|
| Comparison with Poisson distribution Blue bars denote a histogram of data divided into 1 sec bins. Red curve is a Poisson curve with rate = median count rate of data. |
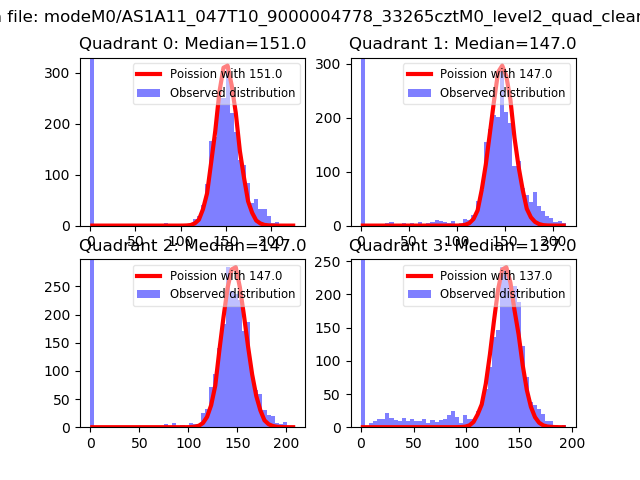 |
 |
| Quadrant-wise count rates Data is divided into 100 sec bins |
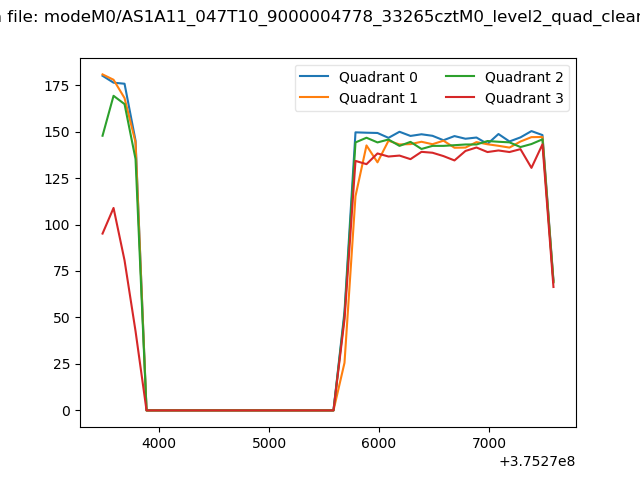 |
|
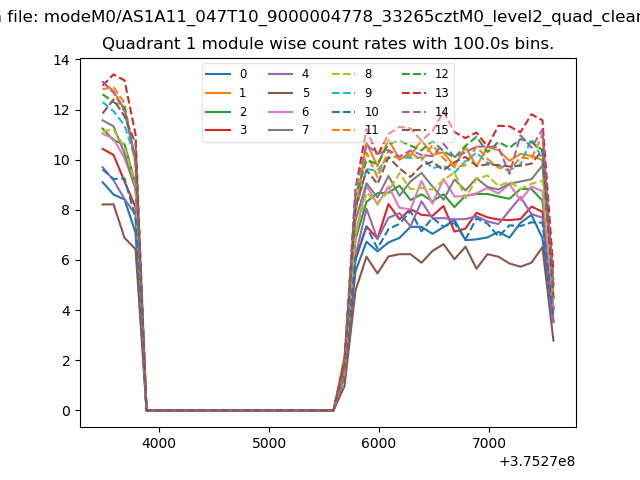
| Module-wise count rates for Quadrant A Data is divided into 100 sec bins |
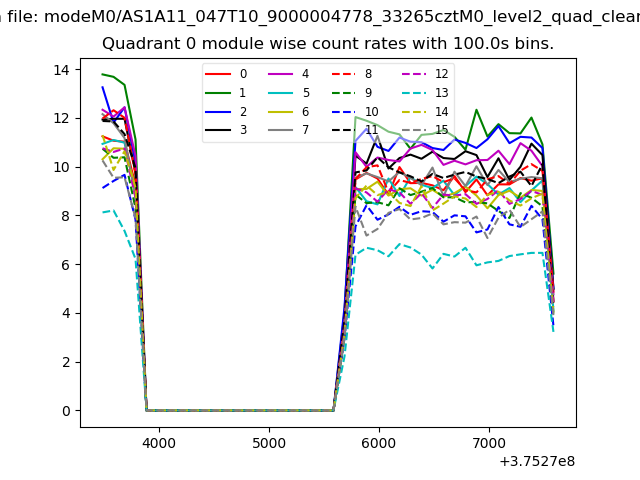 |
 |
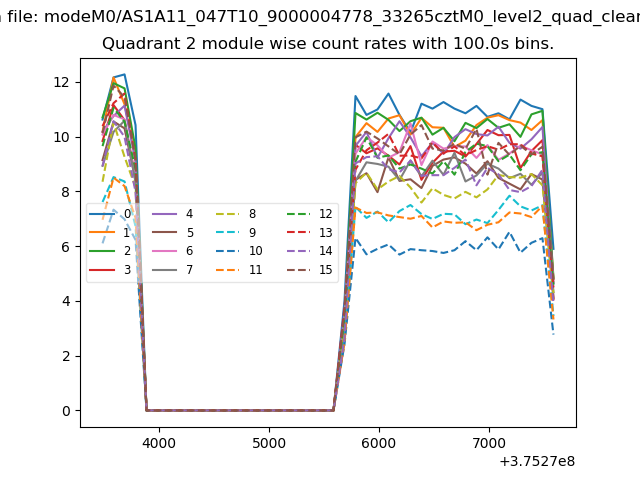
| Module-wise count rates for Quadrant B Data is divided into 100 sec bins |
 |
 |
| Module-wise count rates for Quadrant C Data is divided into 100 sec bins |
 |
 |
| Module-wise count rates for Quadrant D Data is divided into 100 sec bins |
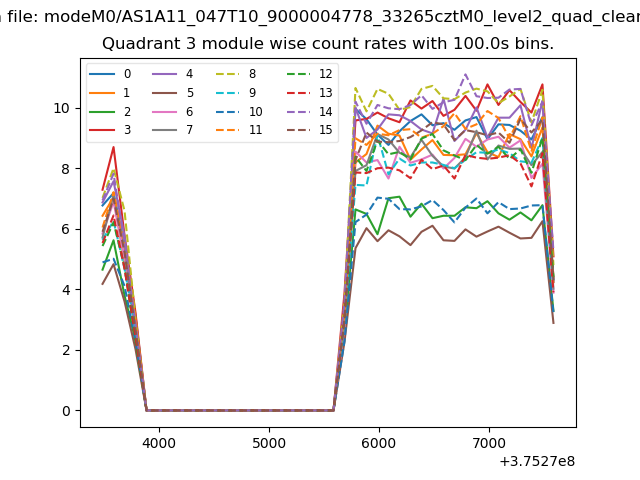 |
 |
| Parameter | Plot |
|---|---|
| CZT HV Monitor | 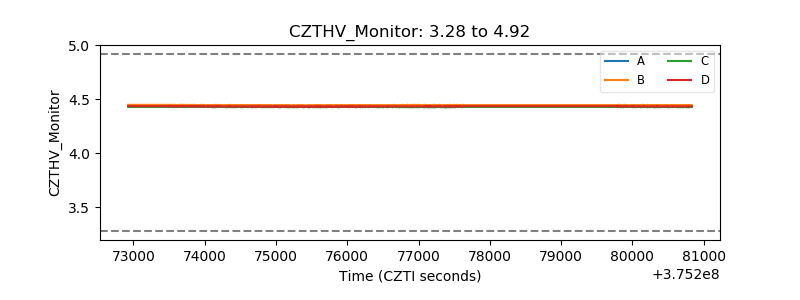 |
| D_VDD | 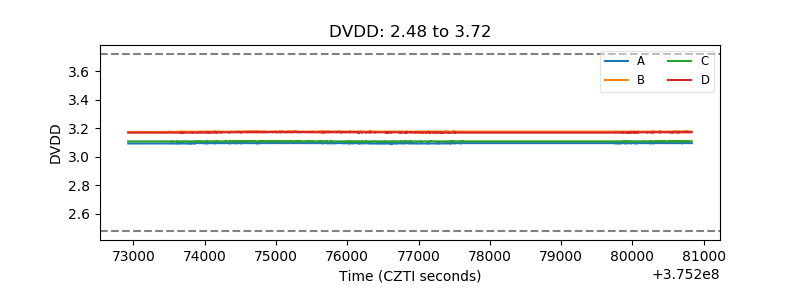 |
| Temperature 1 | 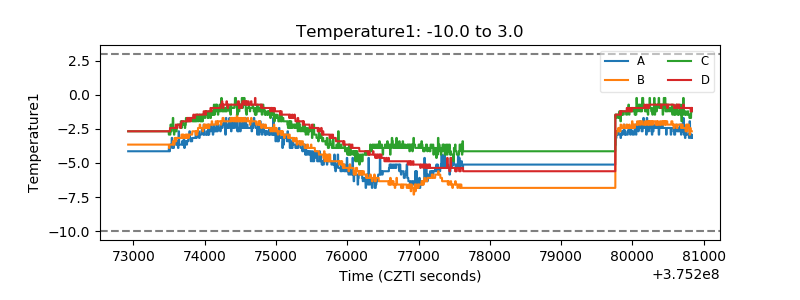 |
| Veto HV Monitor | 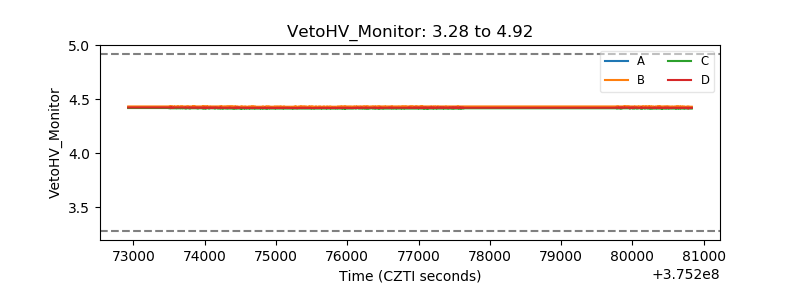 |
| Veto LLD | 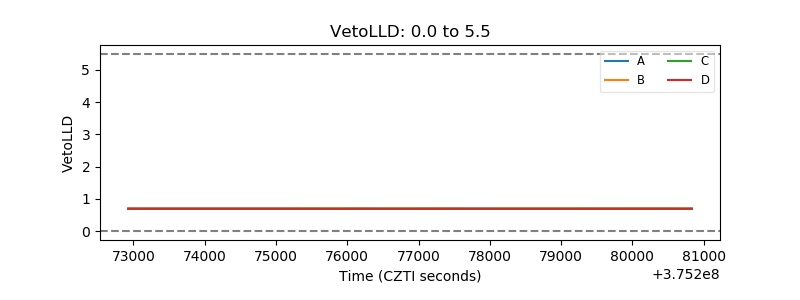 |
| Alpha Counter | 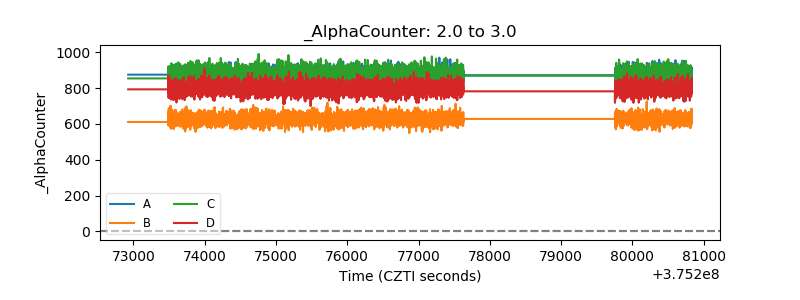 |
| _CPM_Rate | 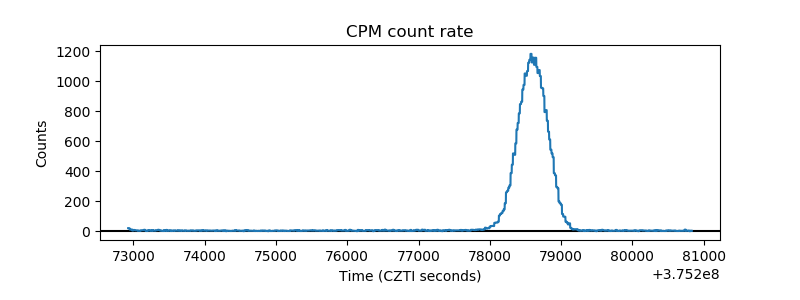 |
| CZT Counter | 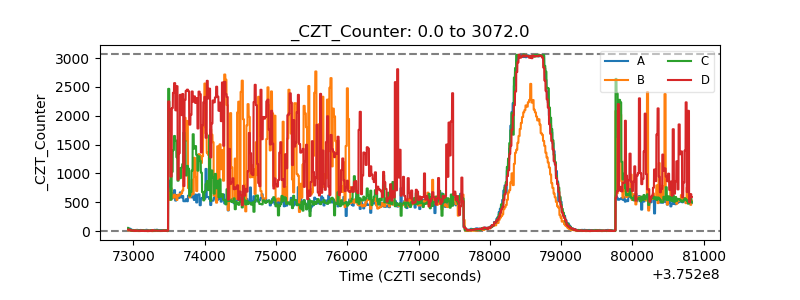 |
| +2.5 Volts monitor |  |
| +5 Volts monitor |  |
| _ROLL_ROT | 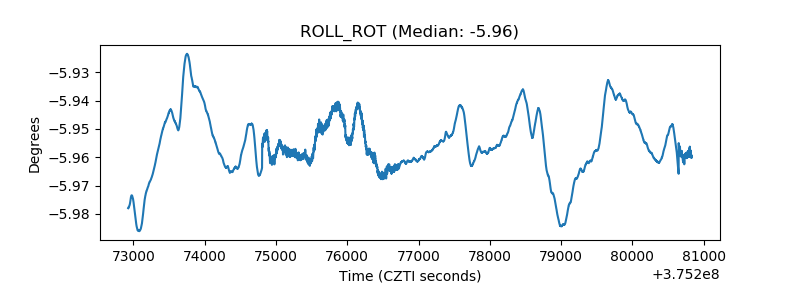 |
| _Roll_DEC | 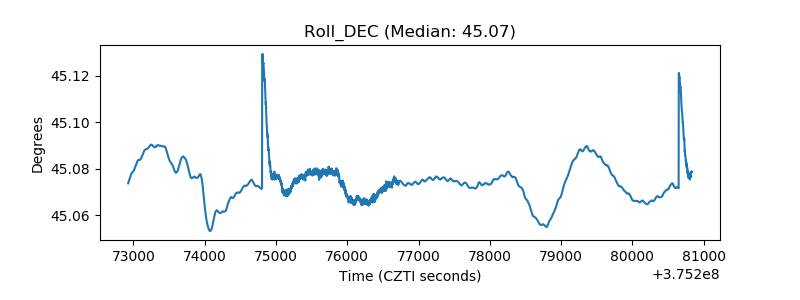 |
| _Roll_RA | 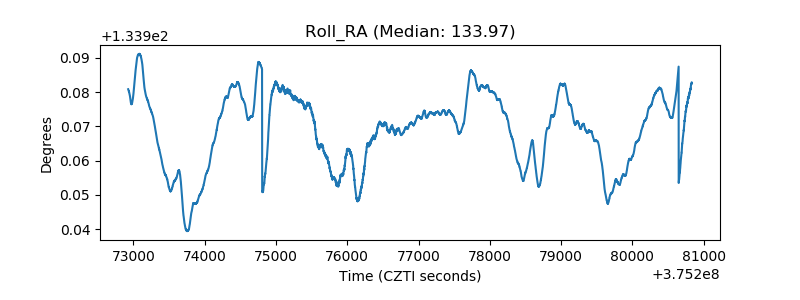 |
| Veto Counter | 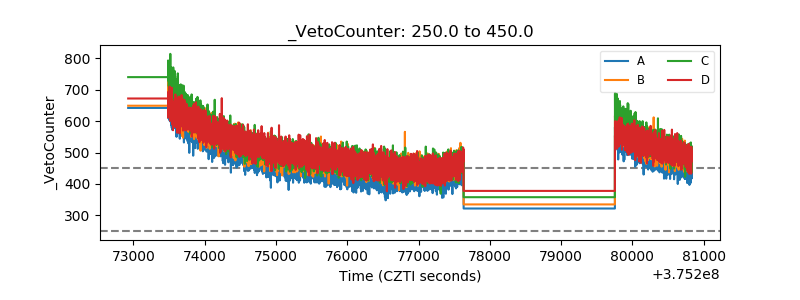 |