| Param | Original file | Final file |
|---|---|---|
| Filename | modeM0/AS1A11_047T10_9000004778_33266cztM0_level2.evt | modeM0/AS1A11_047T10_9000004778_33266cztM0_level2_quad_clean.evt |
| Size (bytes) | 513,046,080 | 54,630,720 |
| Size | 489.3 MB | 52.1 MB |
| Events in quadrant A | 2,593,197 | 335,237 |
| Events in quadrant B | 4,564,177 | 314,165 |
| Events in quadrant C | 3,000,265 | 327,802 |
| Events in quadrant D | 5,029,292 | 313,864 |
| Mode M0 | |||
|---|---|---|---|
| Quadrant | BADHDUFLAG | Total packets | Discarded packets |
| A | 0 | 10721 | 2 |
| B | 0 | 16862 | 1 |
| C | 0 | 11759 | 1 |
| D | 0 | 18542 | 1 |
| Mode SS | |||
|---|---|---|---|
| Quadrant | BADHDUFLAG | Total packets | Discarded packets |
| A | 0 | 104 | 0 |
| B | 0 | 104 | 0 |
| C | 0 | 104 | 0 |
| D | 0 | 104 | 0 |
| Mode M9 | |||
|---|---|---|---|
| Quadrant | BADHDUFLAG | Total packets | Discarded packets |
| A | 0 | 23 | 0 |
| B | 0 | 23 | 0 |
| C | 0 | 23 | 0 |
| D | 0 | 24 | 0 |
| Quadrant | Total seconds | Saturated seconds | Saturation percentage |
|---|---|---|---|
| A | 5181 | 6 | 0.115808% |
| B | 5181 | 821 | 15.846362% |
| C | 5181 | 79 | 1.524802% |
| D | 5181 | 310 | 5.983401% |
Noise dominated data is calculated using 1-second bins in cleaned event files. If a bin has >2000 counts, and if more than 50% of those come from <1% of pixels, then it is considered to be noise-dominated and hence unusable.
| Quadrant | # 1 sec bins | Bins with >0 counts | Bins with >2000 counts | High rate bins dominated by noise | Noise dominated (total time) | Noise dominated (detector-on time) | Marked lightcurve |
|---|---|---|---|---|---|---|---|
| A | 7244 | 5182 | 0 | 0 | 0.00% | 0.00% | 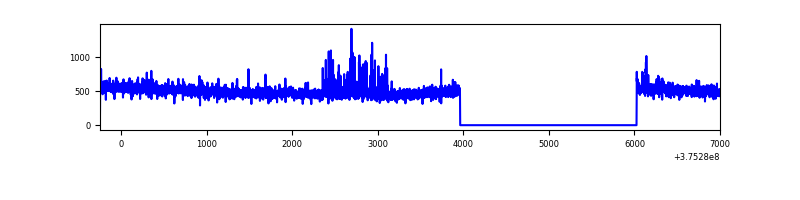 |
| B | 7244 | 5182 | 633 | 633 | 8.74% | 12.22% | 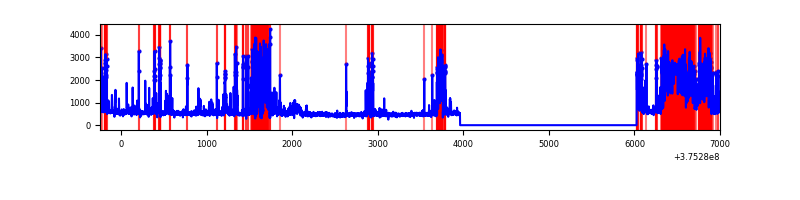 |
| C | 7244 | 5182 | 61 | 61 | 0.84% | 1.18% | 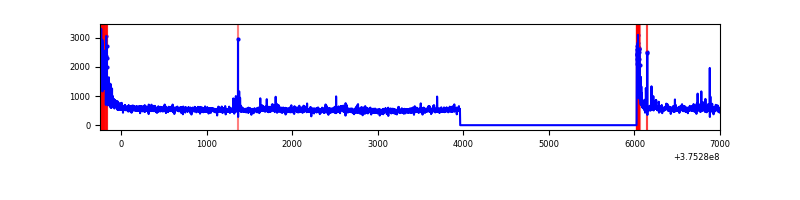 |
| D | 7244 | 5182 | 254 | 254 | 3.51% | 4.90% | 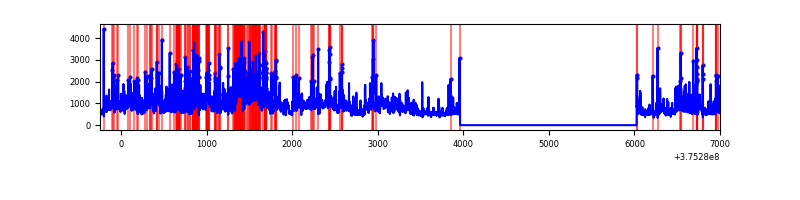 |
Top three noisy pixels from each quadrant. If the there are fewer than three noisy pixels in the level2.evt file, extra rows are filled as -1
| Pixel properties | Quadrant properties | ||||||
|---|---|---|---|---|---|---|---|
| Quadrant | DetID | PixID | Counts | Sigma | Mean | Median | Sigma |
| A | 15 | 169 | 69684 | 535.08 | 648 | 636 | 129.0 |
| A | 13 | 6 | 12104 | 88.87 | 648 | 636 | 129.0 |
| A | 13 | 254 | 9211 | 66.45 | 648 | 636 | 129.0 |
| B | 5 | 172 | 1845652 | 16492.72 | 593 | 578 | 111.9 |
| B | 15 | 85 | 107321 | 954.15 | 593 | 578 | 111.9 |
| B | 5 | 200 | 96910 | 861.09 | 593 | 578 | 111.9 |
| C | 15 | 214 | 234825 | 1646.26 | 623 | 627 | 142.3 |
| C | 0 | 10 | 153641 | 1075.59 | 623 | 627 | 142.3 |
| C | 10 | 49 | 133056 | 930.89 | 623 | 627 | 142.3 |
| D | 8 | 195 | 1187671 | 7025.45 | 618 | 606 | 169.0 |
| D | 2 | 250 | 544290 | 3217.71 | 618 | 606 | 169.0 |
| D | 12 | 233 | 235611 | 1390.84 | 618 | 606 | 169.0 |
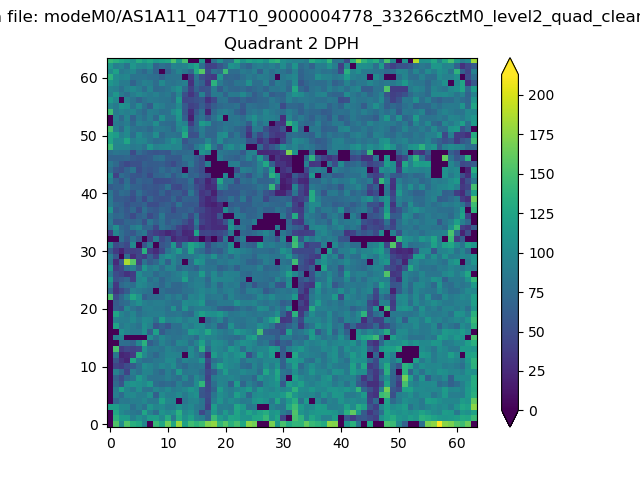
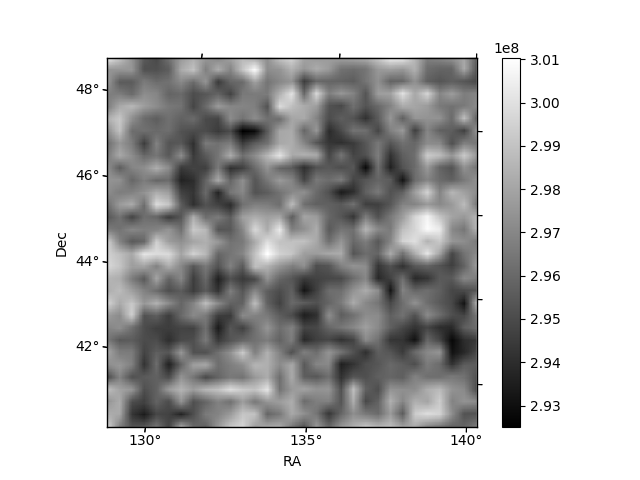
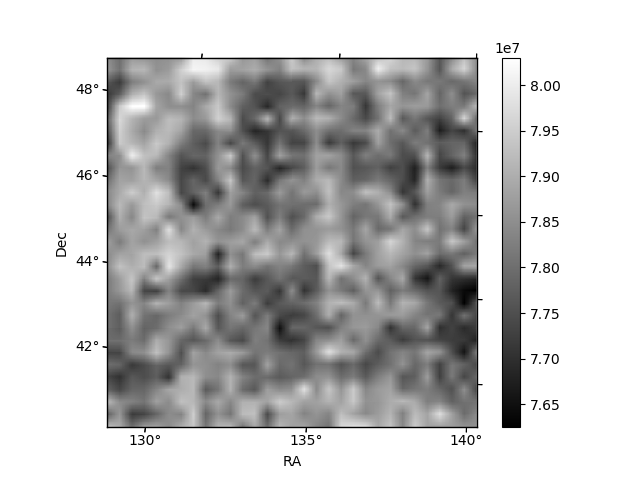
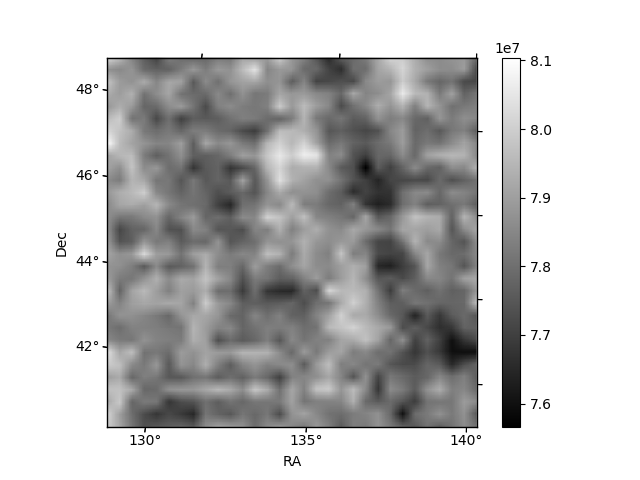
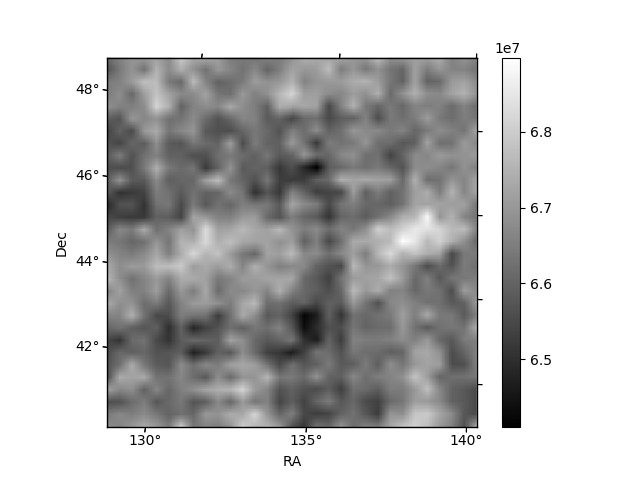
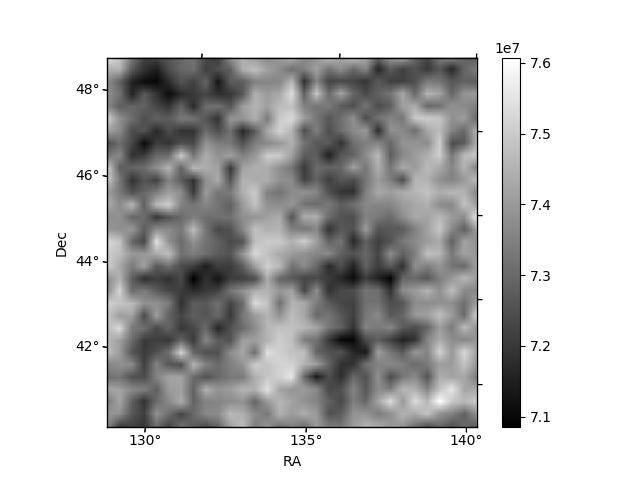
Histogram calculated using DETX and DETY for each event in the final _common_clean file
| Quadrant A | 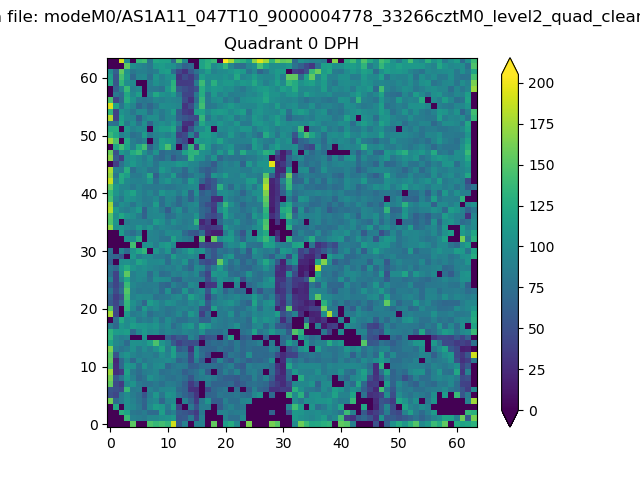 |
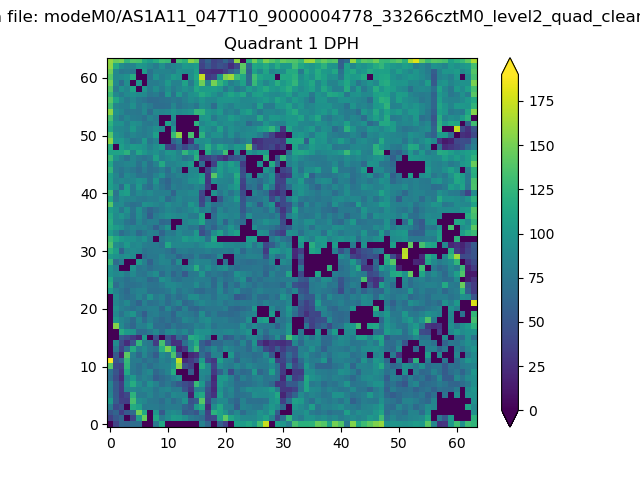 |
Quadrant B |
|---|---|---|---|
| Quadrant D | 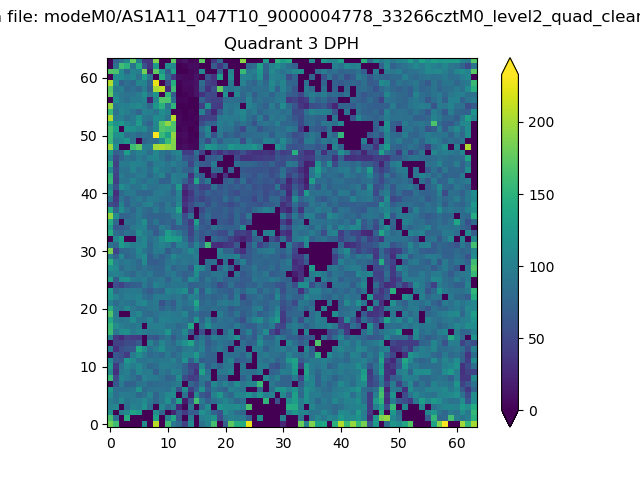 |
 |
Quadrant C |
| Plot type | Count rate plots | Images |
|---|---|---|
| Comparison with Poisson distribution Blue bars denote a histogram of data divided into 1 sec bins. Red curve is a Poisson curve with rate = median count rate of data. |
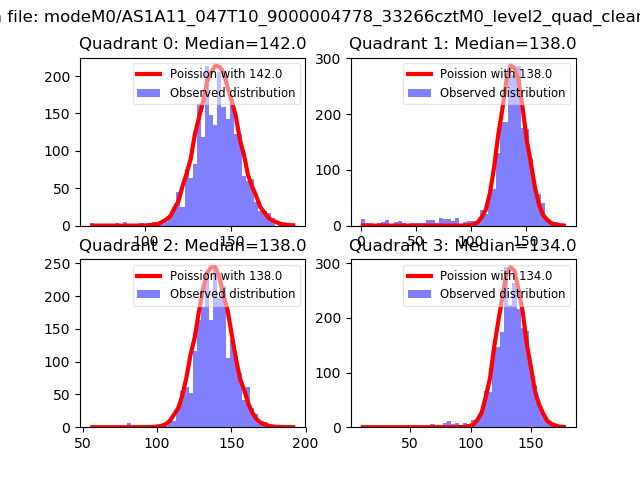 |
 |
| Quadrant-wise count rates Data is divided into 100 sec bins |
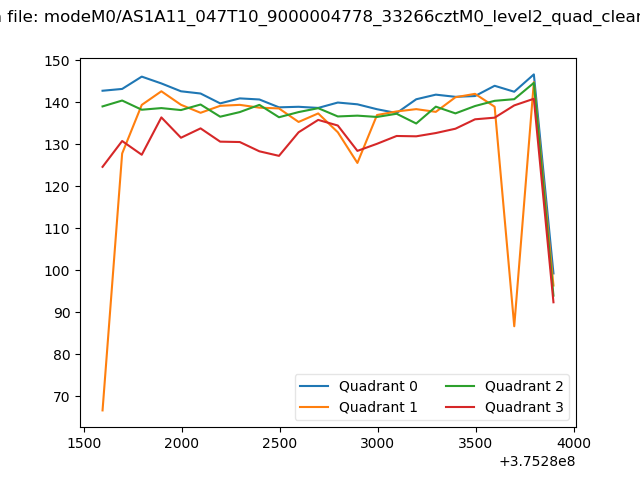 |
|
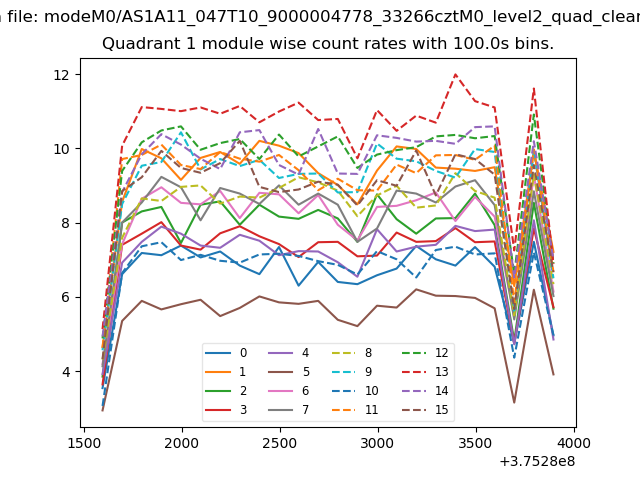
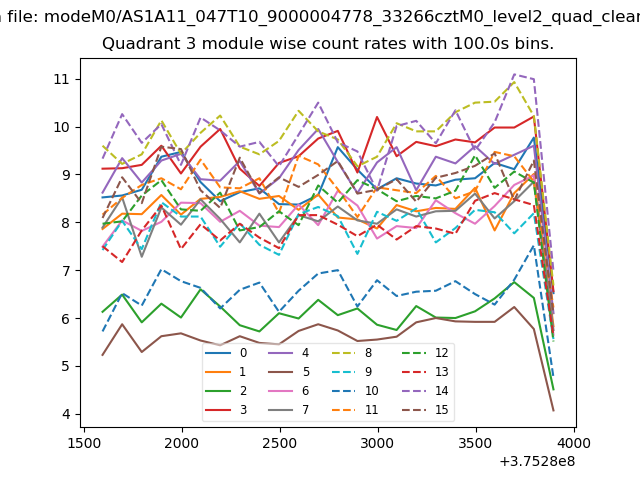
| Module-wise count rates for Quadrant A Data is divided into 100 sec bins |
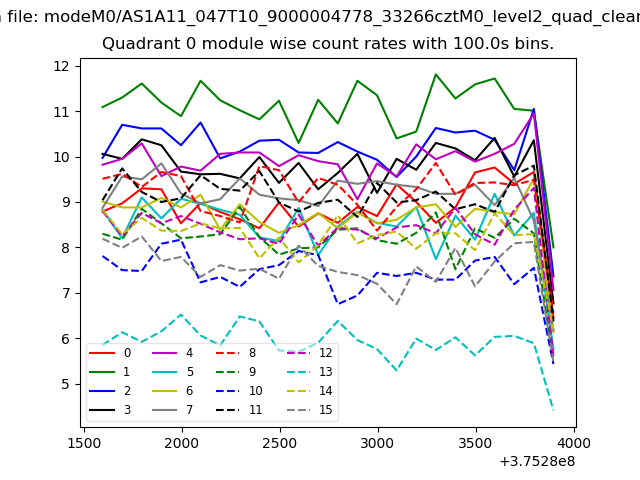 |
 |
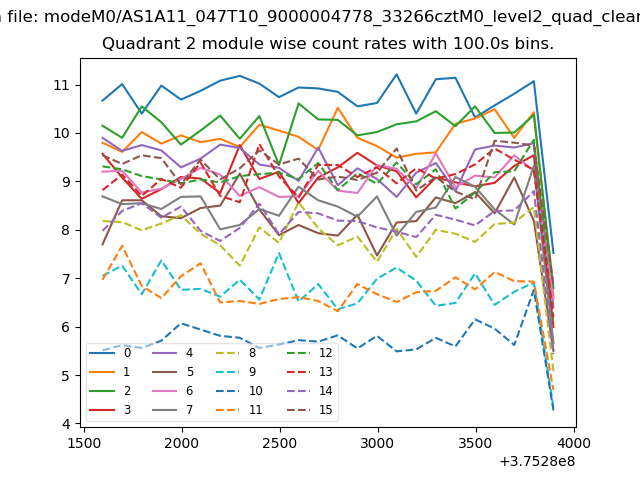
| Module-wise count rates for Quadrant B Data is divided into 100 sec bins |
 |
 |
| Module-wise count rates for Quadrant C Data is divided into 100 sec bins |
 |
 |
| Module-wise count rates for Quadrant D Data is divided into 100 sec bins |
 |
 |
| Parameter | Plot |
|---|---|
| CZT HV Monitor | 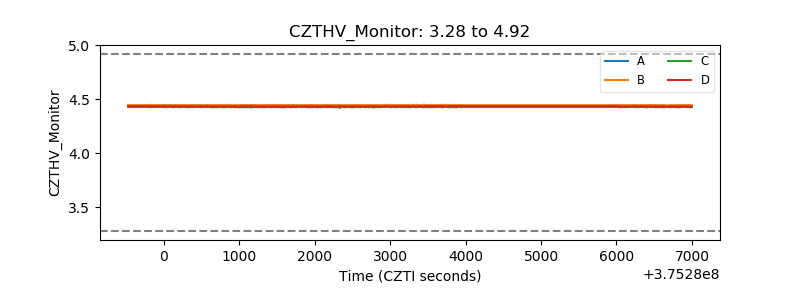 |
| D_VDD | 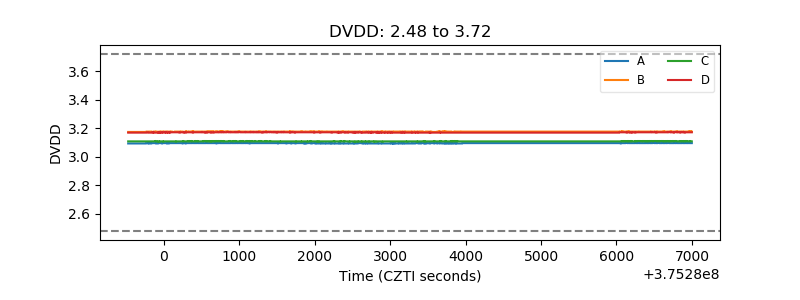 |
| Temperature 1 | 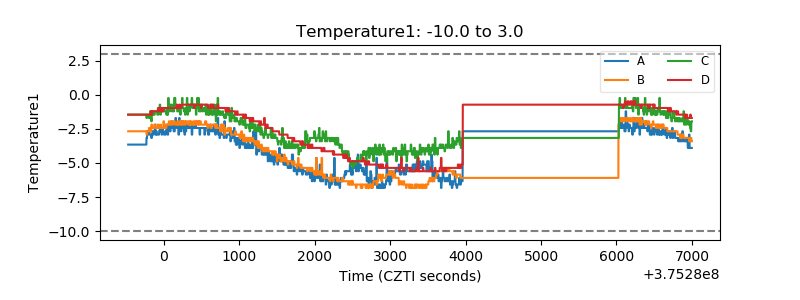 |
| Veto HV Monitor |  |
| Veto LLD | 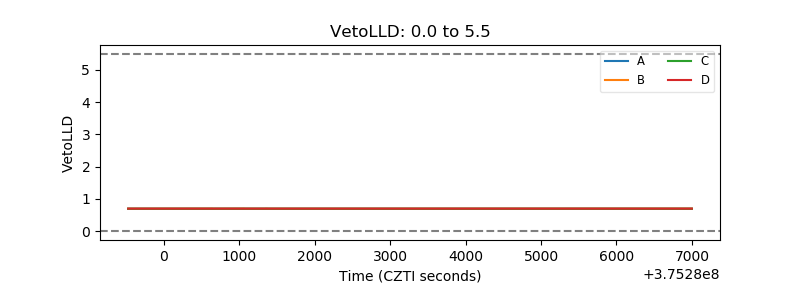 |
| Alpha Counter | 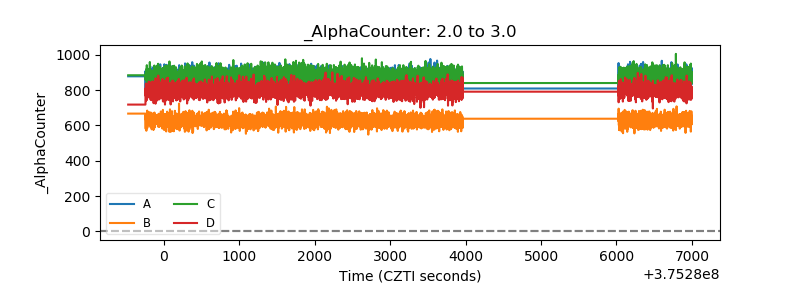 |
| _CPM_Rate | 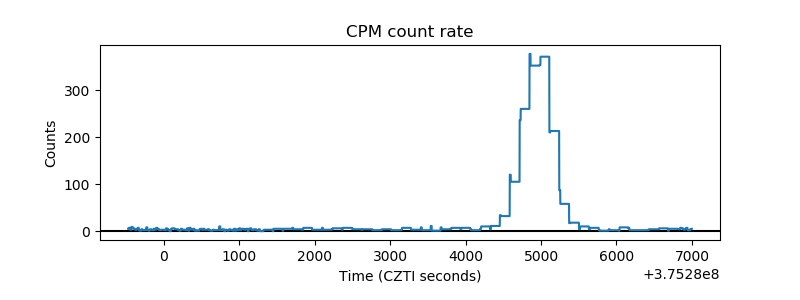 |
| CZT Counter |  |
| +2.5 Volts monitor |  |
| +5 Volts monitor |  |
| _ROLL_ROT | 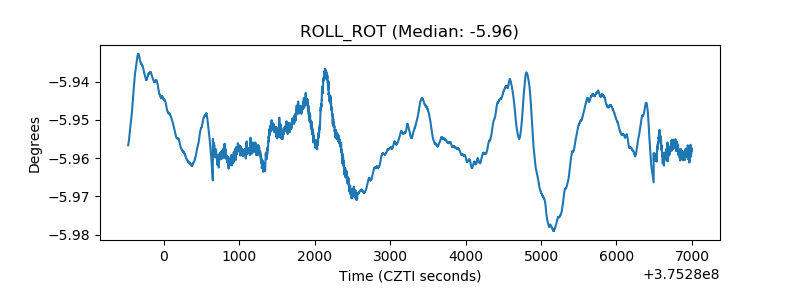 |
| _Roll_DEC | 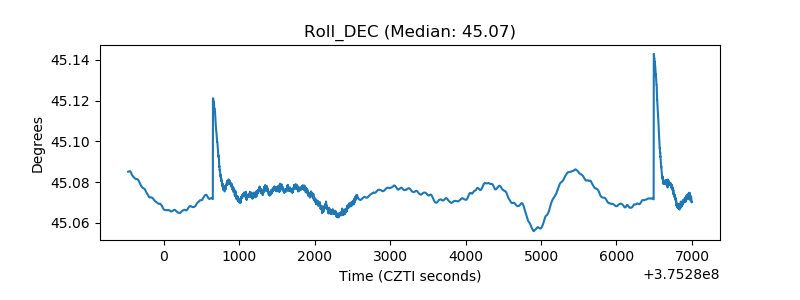 |
| _Roll_RA | 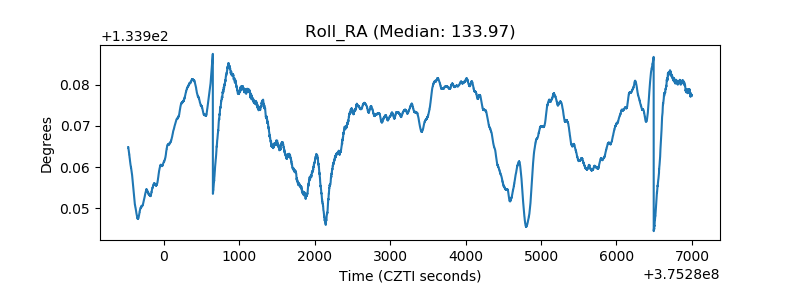 |
| Veto Counter | 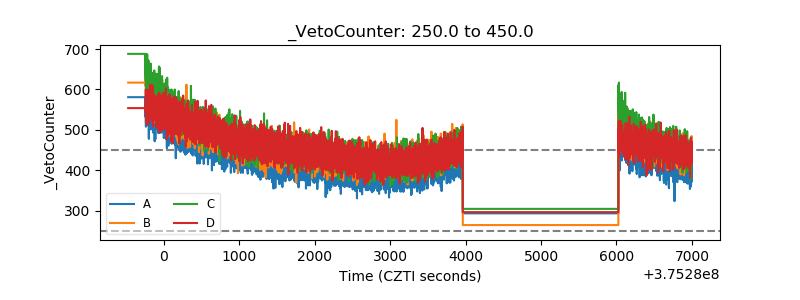 |