| Param | Original file | Final file |
|---|---|---|
| Filename | modeM0/AS1A11_047T10_9000004778_33267cztM0_level2.evt | modeM0/AS1A11_047T10_9000004778_33267cztM0_level2_quad_clean.evt |
| Size (bytes) | 495,936,000 | 64,563,840 |
| Size | 473.0 MB | 61.6 MB |
| Events in quadrant A | 2,491,139 | 408,313 |
| Events in quadrant B | 4,605,120 | 395,319 |
| Events in quadrant C | 3,083,752 | 399,321 |
| Events in quadrant D | 4,480,676 | 381,502 |
| Mode M0 | |||
|---|---|---|---|
| Quadrant | BADHDUFLAG | Total packets | Discarded packets |
| A | 0 | 10728 | 2 |
| B | 0 | 17154 | 1 |
| C | 0 | 12281 | 1 |
| D | 0 | 17061 | 1 |
| Mode SS | |||
|---|---|---|---|
| Quadrant | BADHDUFLAG | Total packets | Discarded packets |
| A | 0 | 108 | 0 |
| B | 0 | 108 | 0 |
| C | 0 | 108 | 0 |
| D | 0 | 108 | 0 |
| Mode M9 | |||
|---|---|---|---|
| Quadrant | BADHDUFLAG | Total packets | Discarded packets |
| A | 0 | 26 | 0 |
| B | 0 | 26 | 0 |
| C | 0 | 26 | 0 |
| D | 0 | 27 | 0 |
| Quadrant | Total seconds | Saturated seconds | Saturation percentage |
|---|---|---|---|
| A | 5289 | 6 | 0.113443% |
| B | 5289 | 864 | 16.335791% |
| C | 5289 | 51 | 0.964265% |
| D | 5289 | 249 | 4.707884% |
Noise dominated data is calculated using 1-second bins in cleaned event files. If a bin has >2000 counts, and if more than 50% of those come from <1% of pixels, then it is considered to be noise-dominated and hence unusable.
| Quadrant | # 1 sec bins | Bins with >0 counts | Bins with >2000 counts | High rate bins dominated by noise | Noise dominated (total time) | Noise dominated (detector-on time) | Marked lightcurve |
|---|---|---|---|---|---|---|---|
| A | 7111 | 5290 | 0 | 0 | 0.00% | 0.00% | 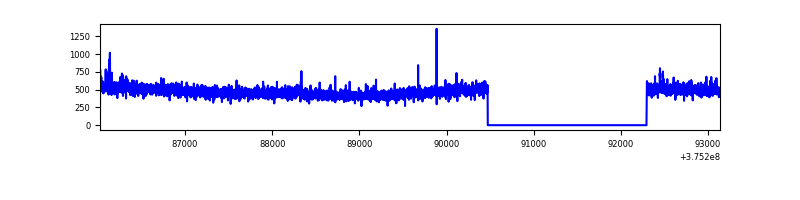 |
| B | 7111 | 5290 | 658 | 658 | 9.25% | 12.44% | 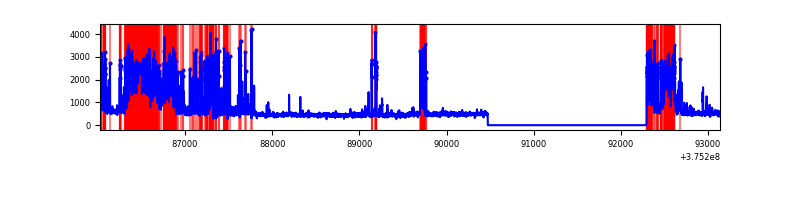 |
| C | 7111 | 5290 | 30 | 30 | 0.42% | 0.57% | 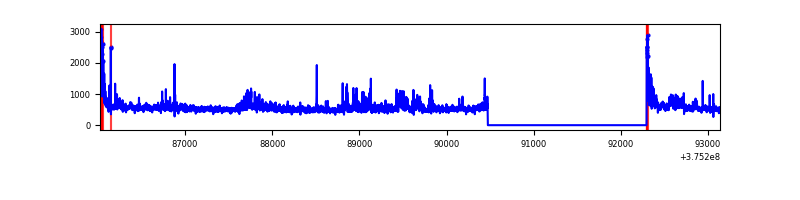 |
| D | 7111 | 5290 | 200 | 200 | 2.81% | 3.78% | 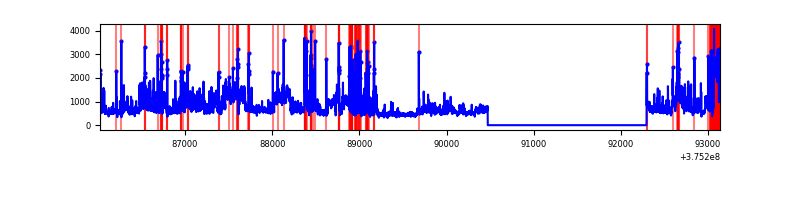 |
Top three noisy pixels from each quadrant. If the there are fewer than three noisy pixels in the level2.evt file, extra rows are filled as -1
| Pixel properties | Quadrant properties | ||||||
|---|---|---|---|---|---|---|---|
| Quadrant | DetID | PixID | Counts | Sigma | Mean | Median | Sigma |
| A | 15 | 169 | 29401 | 228.59 | 632 | 620 | 125.9 |
| A | 13 | 6 | 10023 | 74.68 | 632 | 620 | 125.9 |
| A | 13 | 254 | 9211 | 68.23 | 632 | 620 | 125.9 |
| B | 5 | 172 | 2033877 | 18445.21 | 579 | 564 | 110.2 |
| B | 5 | 200 | 105424 | 951.24 | 579 | 564 | 110.2 |
| B | 0 | 219 | 50200 | 450.27 | 579 | 564 | 110.2 |
| C | 15 | 214 | 239419 | 1703.12 | 610 | 616 | 140.2 |
| C | 10 | 49 | 194561 | 1383.2 | 610 | 616 | 140.2 |
| C | 0 | 10 | 133233 | 945.81 | 610 | 616 | 140.2 |
| D | 8 | 195 | 1082560 | 6826.68 | 602 | 590 | 158.5 |
| D | 12 | 218 | 356050 | 2242.77 | 602 | 590 | 158.5 |
| D | 2 | 250 | 304354 | 1916.6 | 602 | 590 | 158.5 |
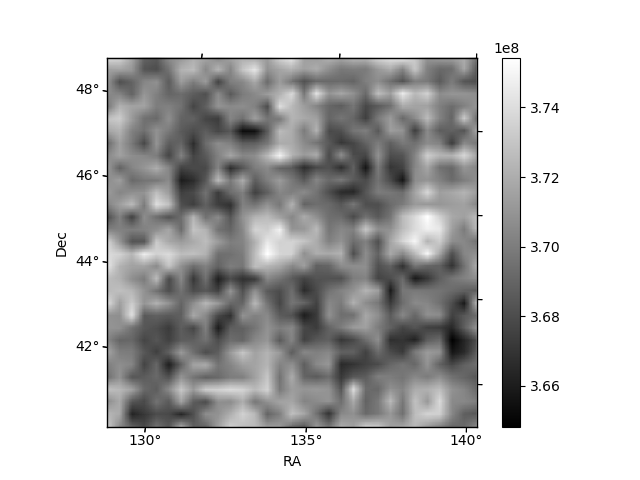
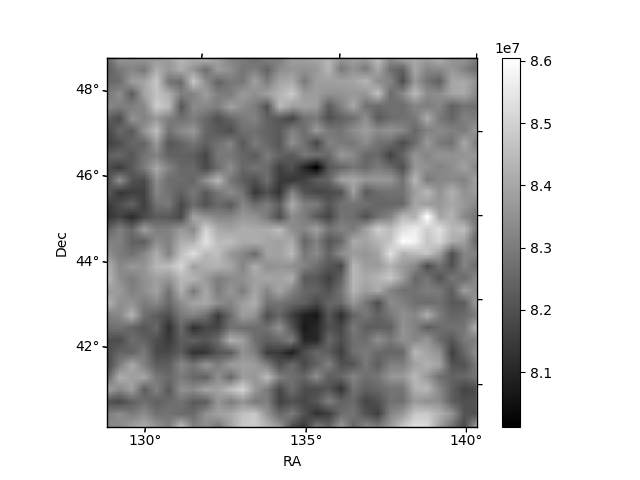
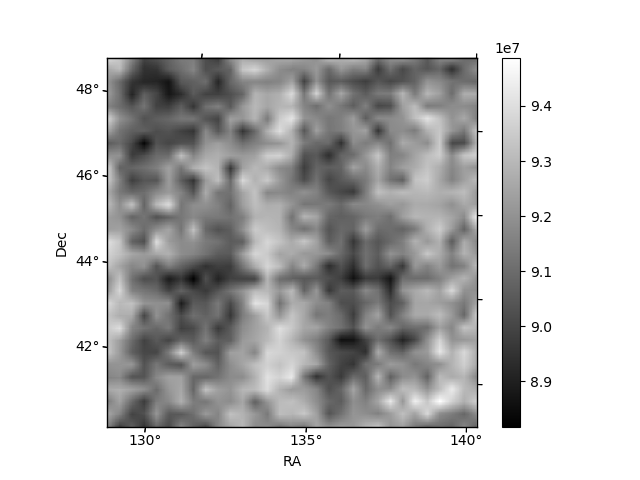
Histogram calculated using DETX and DETY for each event in the final _common_clean file
| Quadrant A | 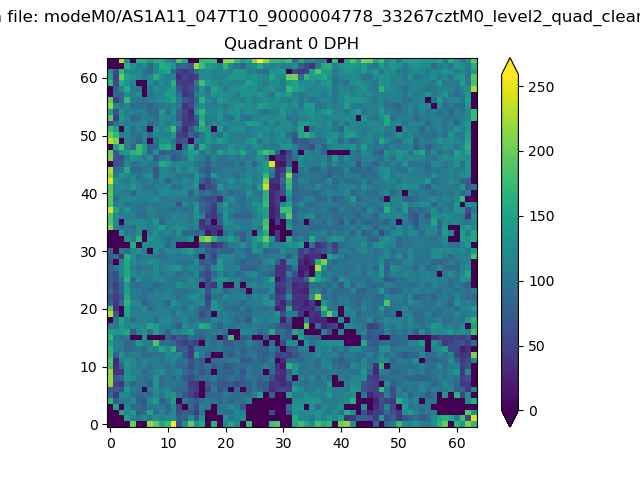 |
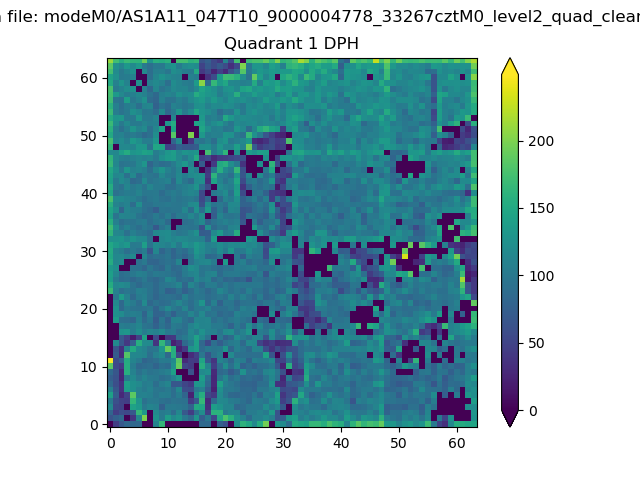 |
Quadrant B |
|---|---|---|---|
| Quadrant D | 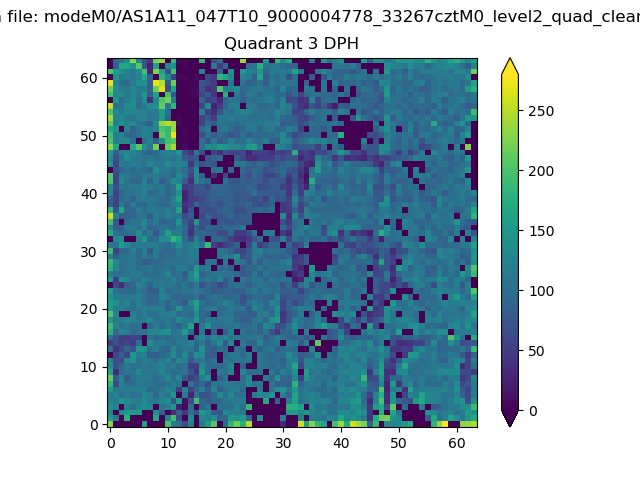 |
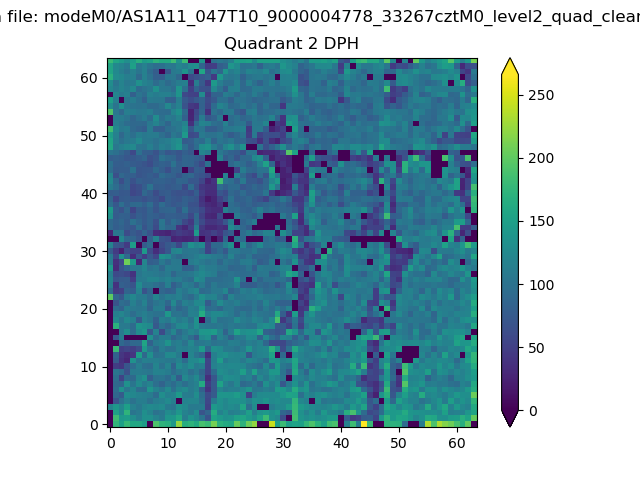 |
Quadrant C |
| Plot type | Count rate plots | Images |
|---|---|---|
| Comparison with Poisson distribution Blue bars denote a histogram of data divided into 1 sec bins. Red curve is a Poisson curve with rate = median count rate of data. |
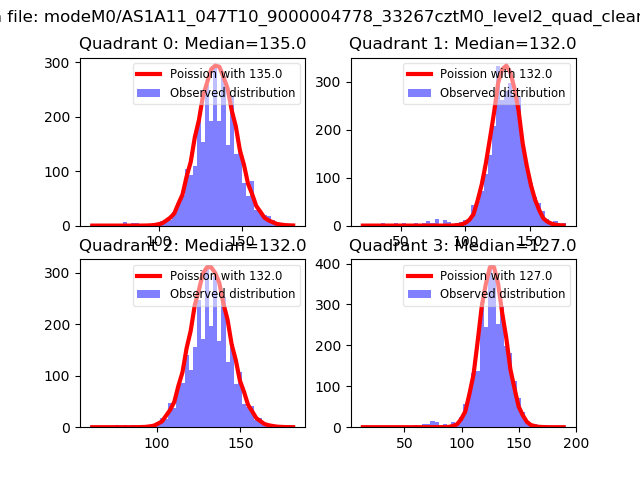 |
 |
| Quadrant-wise count rates Data is divided into 100 sec bins |
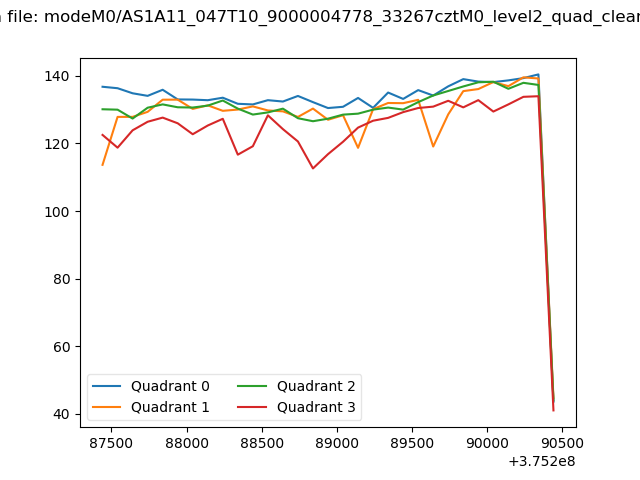 |
|
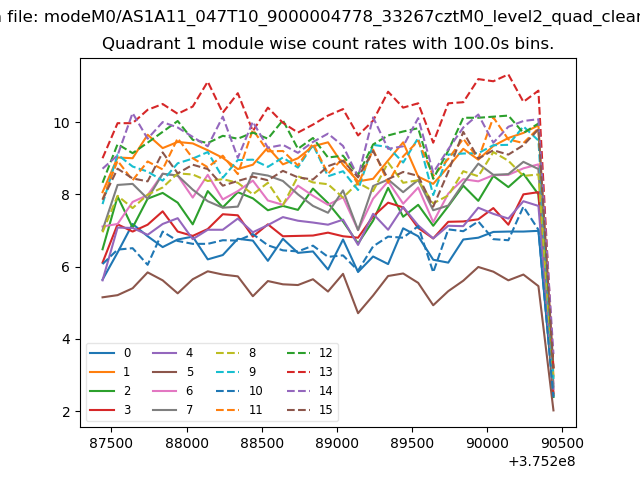
| Module-wise count rates for Quadrant A Data is divided into 100 sec bins |
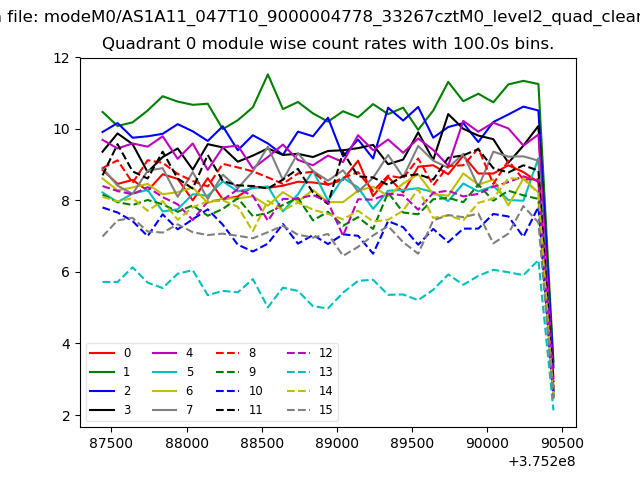 |
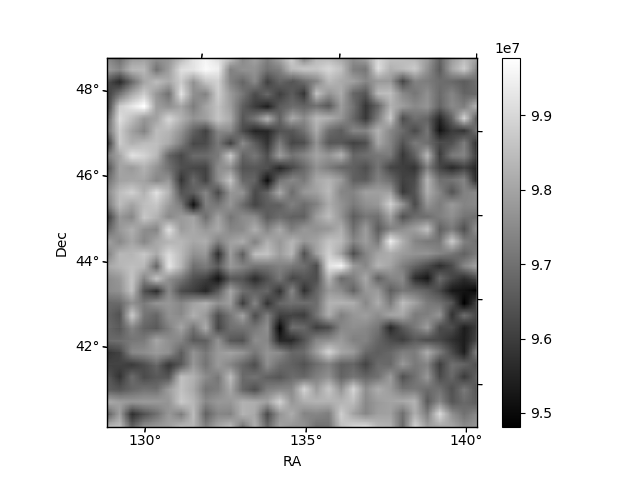 |
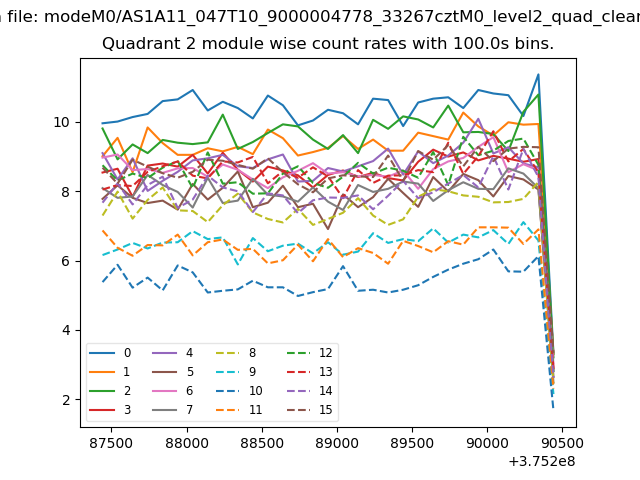
| Module-wise count rates for Quadrant B Data is divided into 100 sec bins |
 |
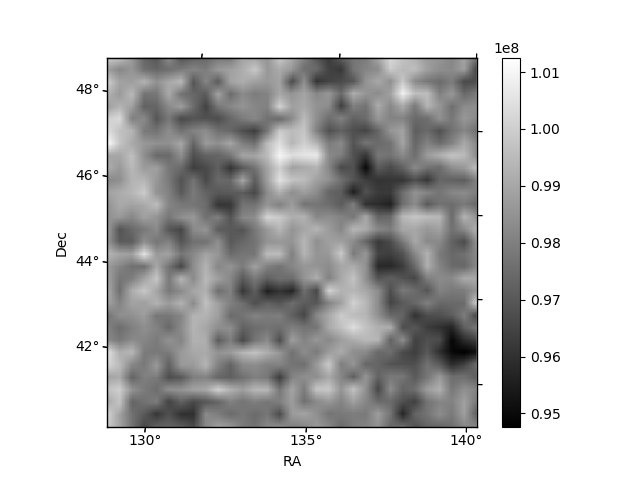 |
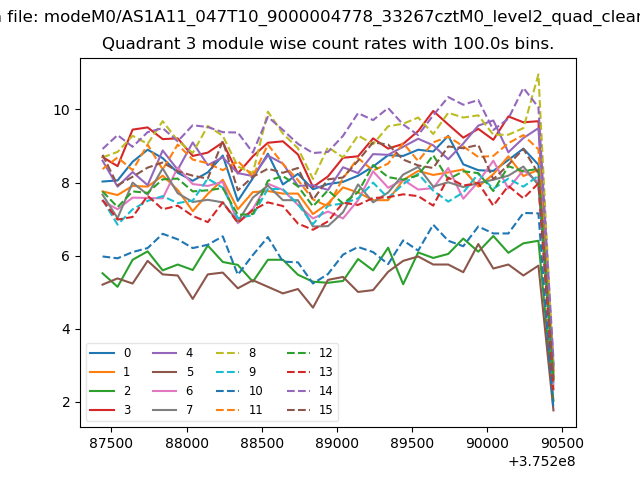
| Module-wise count rates for Quadrant C Data is divided into 100 sec bins |
 |
 |
| Module-wise count rates for Quadrant D Data is divided into 100 sec bins |
 |
 |
| Parameter | Plot |
|---|---|
| CZT HV Monitor | 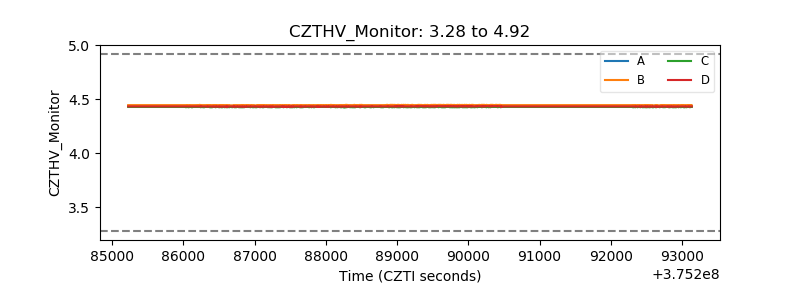 |
| D_VDD | 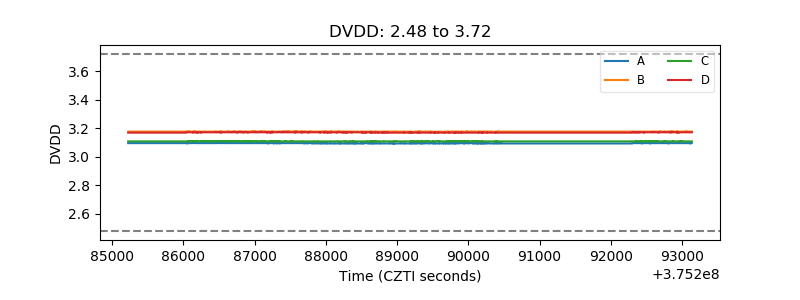 |
| Temperature 1 | 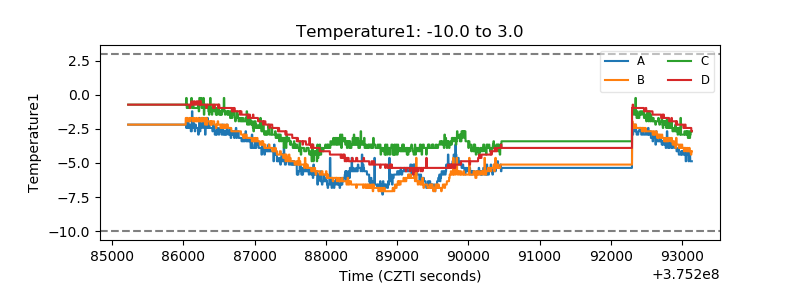 |
| Veto HV Monitor | 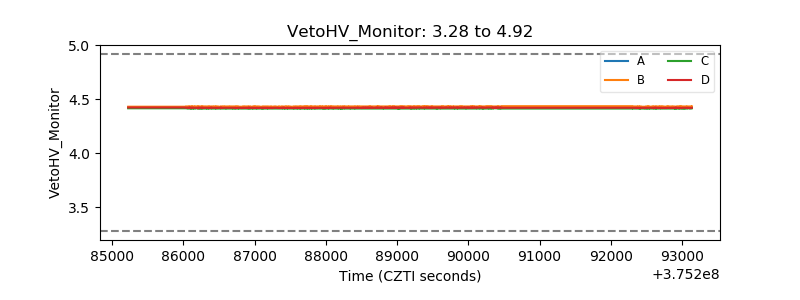 |
| Veto LLD |  |
| Alpha Counter | 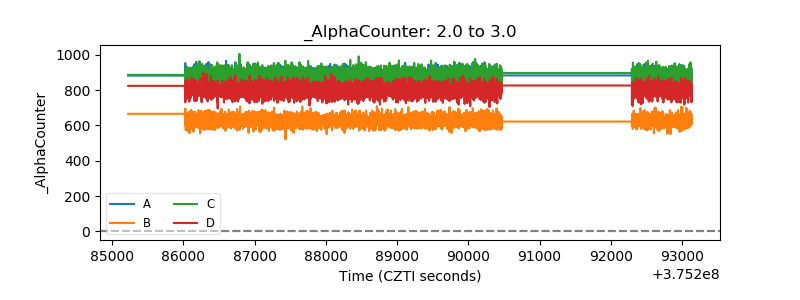 |
| _CPM_Rate | 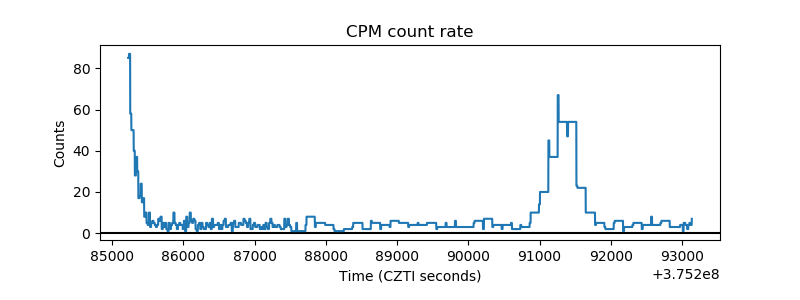 |
| CZT Counter | 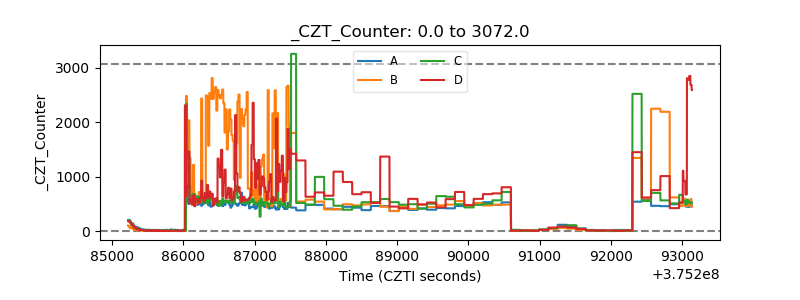 |
| +2.5 Volts monitor |  |
| +5 Volts monitor |  |
| _ROLL_ROT | 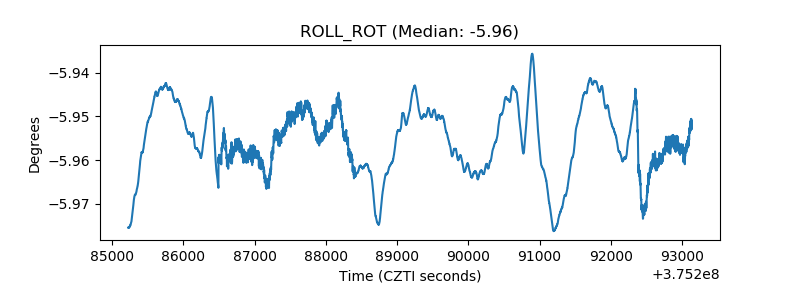 |
| _Roll_DEC | 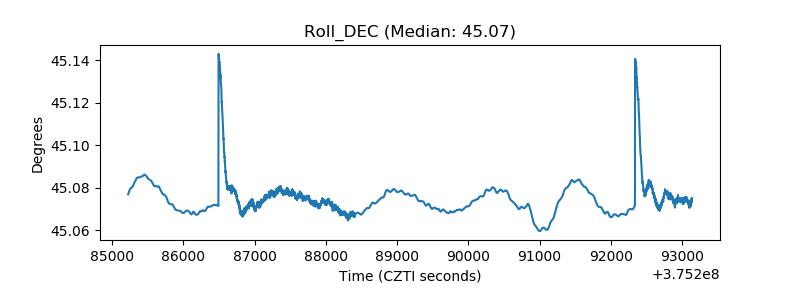 |
| _Roll_RA | 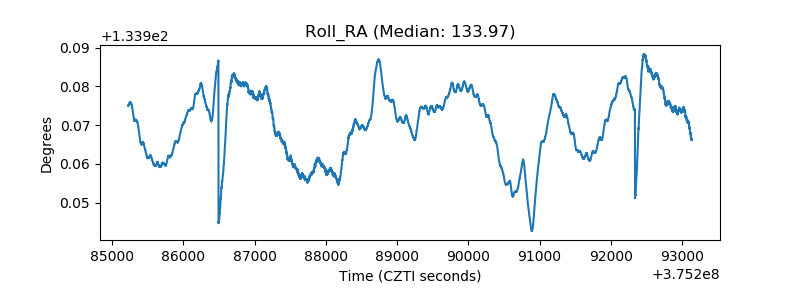 |
| Veto Counter | 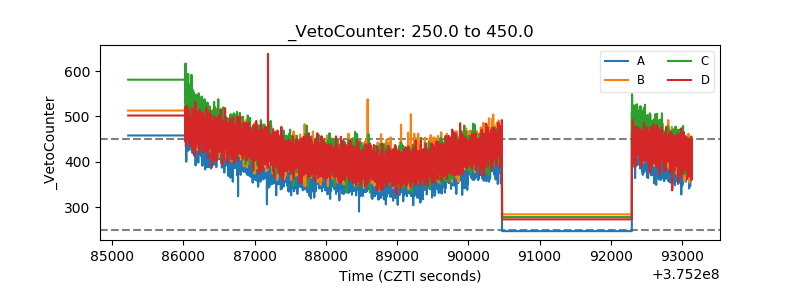 |