| Param | Original file | Final file |
|---|---|---|
| Filename | modeM0/AS1A11_047T10_9000004778_33268cztM0_level2.evt | modeM0/AS1A11_047T10_9000004778_33268cztM0_level2_quad_clean.evt |
| Size (bytes) | 492,459,840 | 81,385,920 |
| Size | 469.6 MB | 77.6 MB |
| Events in quadrant A | 2,642,910 | 532,965 |
| Events in quadrant B | 4,574,735 | 506,355 |
| Events in quadrant C | 3,146,128 | 521,826 |
| Events in quadrant D | 4,166,352 | 507,525 |
| Mode M0 | |||
|---|---|---|---|
| Quadrant | BADHDUFLAG | Total packets | Discarded packets |
| A | 0 | 11463 | 3 |
| B | 0 | 17420 | 2 |
| C | 0 | 12890 | 2 |
| D | 0 | 16278 | 2 |
| Mode SS | |||
|---|---|---|---|
| Quadrant | BADHDUFLAG | Total packets | Discarded packets |
| A | 0 | 114 | 0 |
| B | 0 | 114 | 0 |
| C | 0 | 114 | 0 |
| D | 0 | 114 | 0 |
| Mode M9 | |||
|---|---|---|---|
| Quadrant | BADHDUFLAG | Total packets | Discarded packets |
| A | 0 | 28 | 0 |
| B | 0 | 28 | 0 |
| C | 0 | 28 | 0 |
| D | 0 | 29 | 0 |
| Quadrant | Total seconds | Saturated seconds | Saturation percentage |
|---|---|---|---|
| A | 5663 | 4 | 0.070634% |
| B | 5663 | 742 | 13.102596% |
| C | 5663 | 37 | 0.653364% |
| D | 5663 | 213 | 3.761257% |
Noise dominated data is calculated using 1-second bins in cleaned event files. If a bin has >2000 counts, and if more than 50% of those come from <1% of pixels, then it is considered to be noise-dominated and hence unusable.
| Quadrant | # 1 sec bins | Bins with >0 counts | Bins with >2000 counts | High rate bins dominated by noise | Noise dominated (total time) | Noise dominated (detector-on time) | Marked lightcurve |
|---|---|---|---|---|---|---|---|
| A | 7125 | 5664 | 0 | 0 | 0.00% | 0.00% | 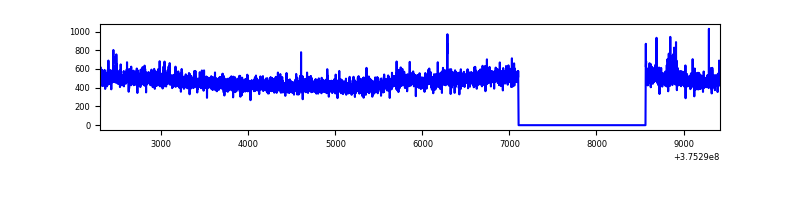 |
| B | 7125 | 5664 | 530 | 530 | 7.44% | 9.36% | 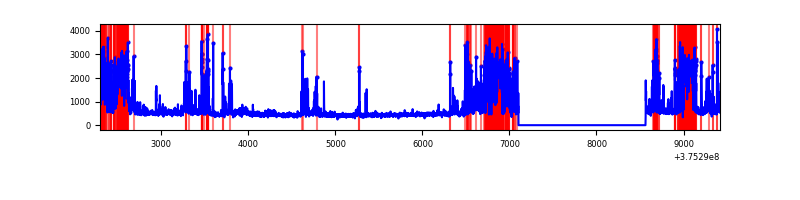 |
| C | 7125 | 5664 | 21 | 21 | 0.29% | 0.37% | 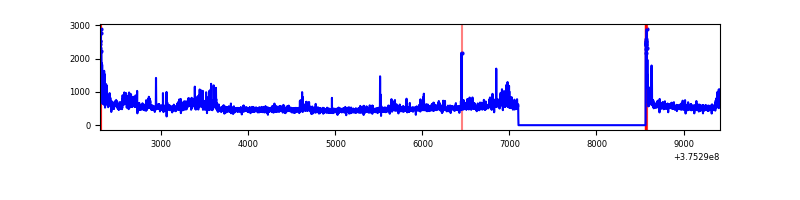 |
| D | 7125 | 5664 | 168 | 168 | 2.36% | 2.97% | 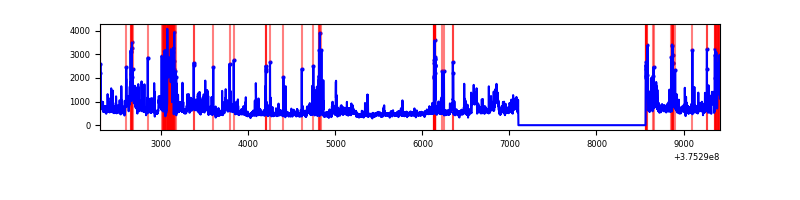 |
Top three noisy pixels from each quadrant. If the there are fewer than three noisy pixels in the level2.evt file, extra rows are filled as -1
| Pixel properties | Quadrant properties | ||||||
|---|---|---|---|---|---|---|---|
| Quadrant | DetID | PixID | Counts | Sigma | Mean | Median | Sigma |
| A | 15 | 169 | 24078 | 178.02 | 666 | 653 | 131.6 |
| A | 13 | 210 | 15600 | 113.59 | 666 | 653 | 131.6 |
| A | 13 | 6 | 13677 | 98.98 | 666 | 653 | 131.6 |
| B | 5 | 172 | 1781573 | 15045.63 | 618 | 603 | 118.4 |
| B | 5 | 200 | 126631 | 1064.68 | 618 | 603 | 118.4 |
| B | 0 | 219 | 93385 | 783.82 | 618 | 603 | 118.4 |
| C | 15 | 214 | 253184 | 1706.81 | 642 | 647 | 148.0 |
| C | 10 | 49 | 143816 | 967.63 | 642 | 647 | 148.0 |
| C | 0 | 10 | 109591 | 736.31 | 642 | 647 | 148.0 |
| D | 8 | 195 | 709259 | 4149.53 | 633 | 620 | 170.8 |
| D | 12 | 218 | 444716 | 2600.46 | 633 | 620 | 170.8 |
| D | 12 | 233 | 140058 | 816.5 | 633 | 620 | 170.8 |
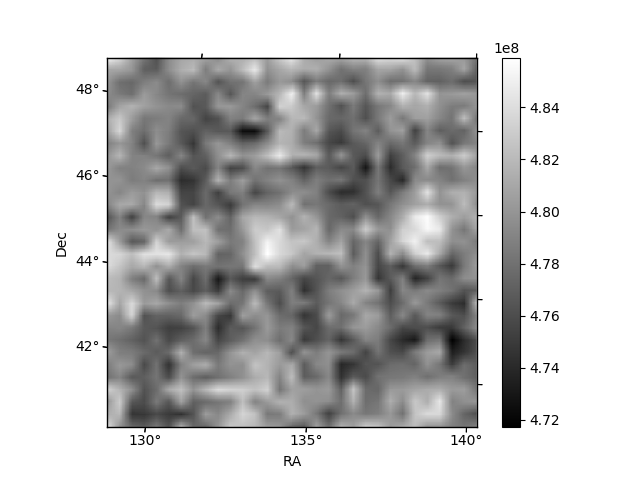
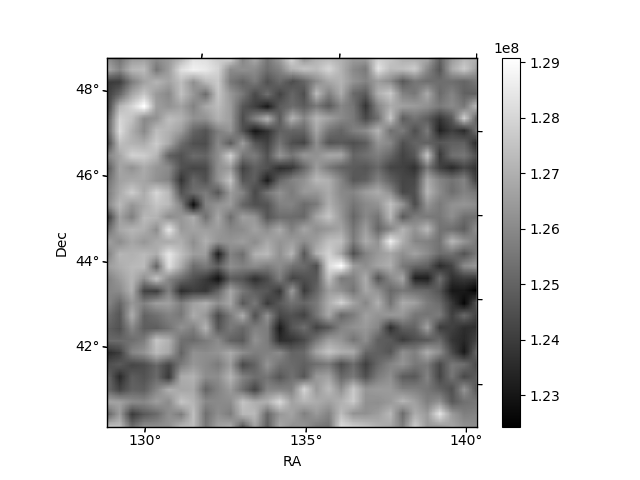
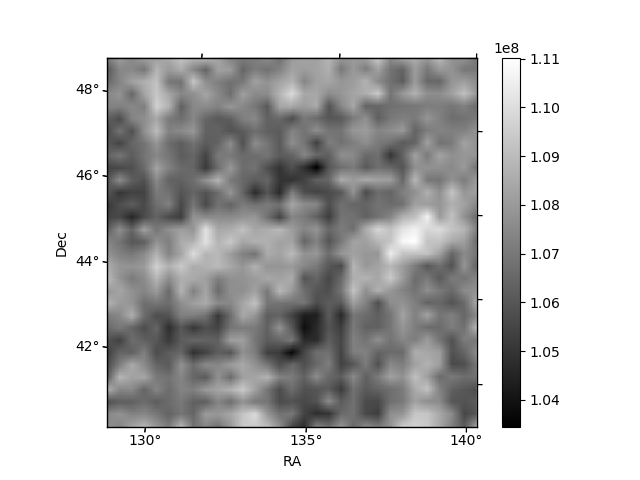
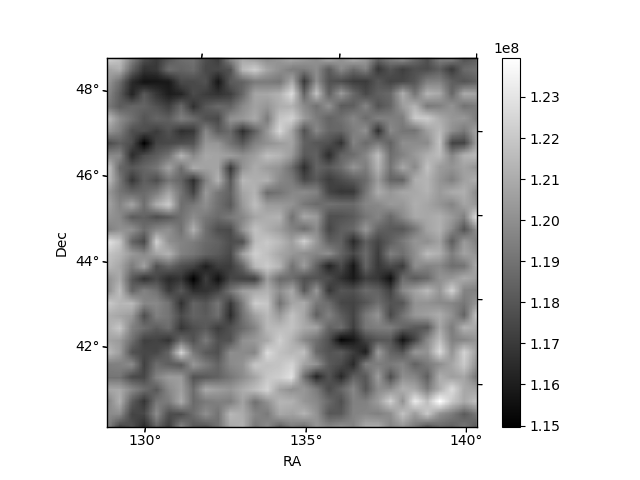
Histogram calculated using DETX and DETY for each event in the final _common_clean file
| Quadrant A | 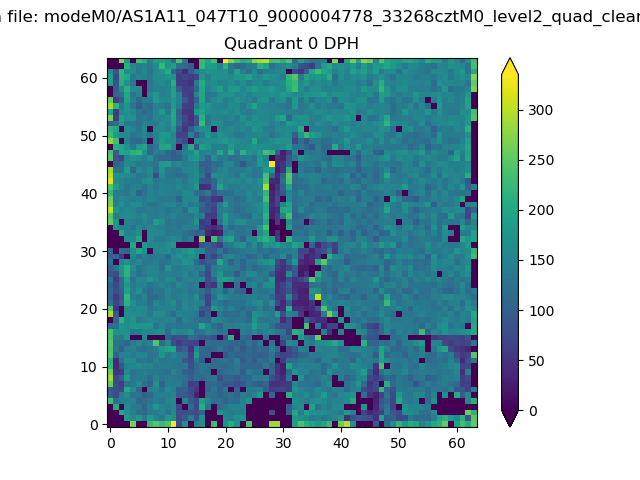 |
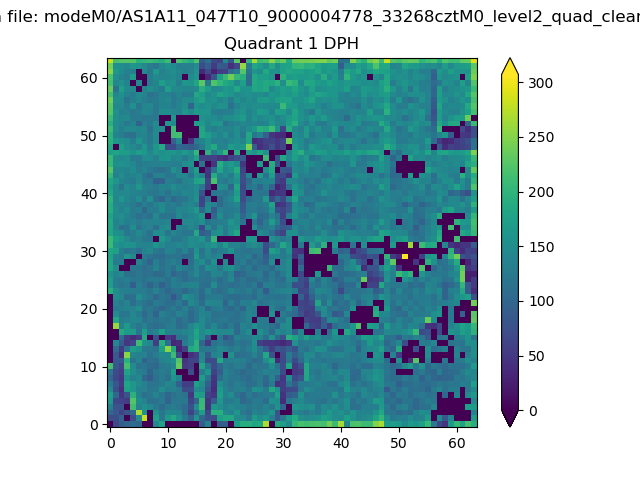 |
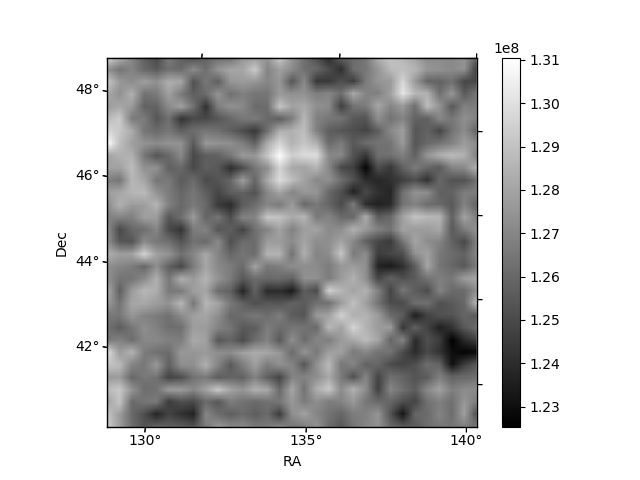
Quadrant B |
|---|---|---|---|
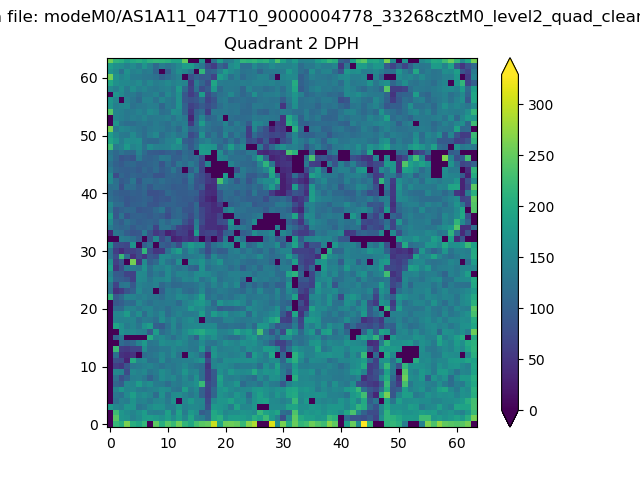
| Quadrant D | 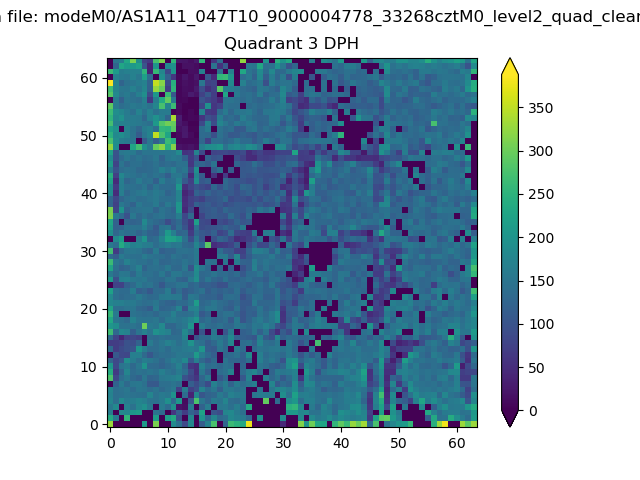 |
 |
Quadrant C |
| Plot type | Count rate plots | Images |
|---|---|---|
| Comparison with Poisson distribution Blue bars denote a histogram of data divided into 1 sec bins. Red curve is a Poisson curve with rate = median count rate of data. |
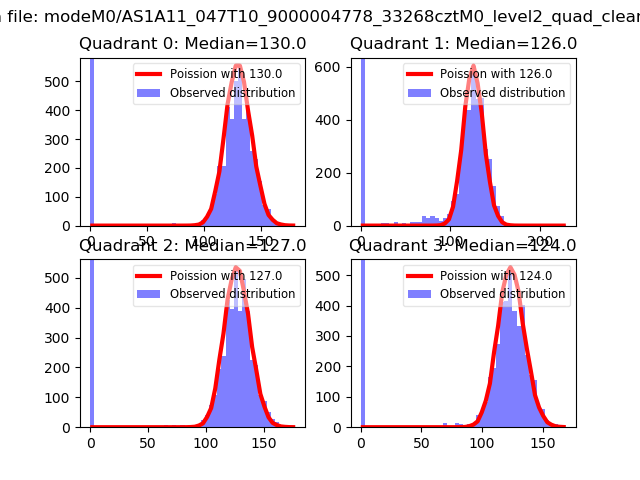 |
 |
| Quadrant-wise count rates Data is divided into 100 sec bins |
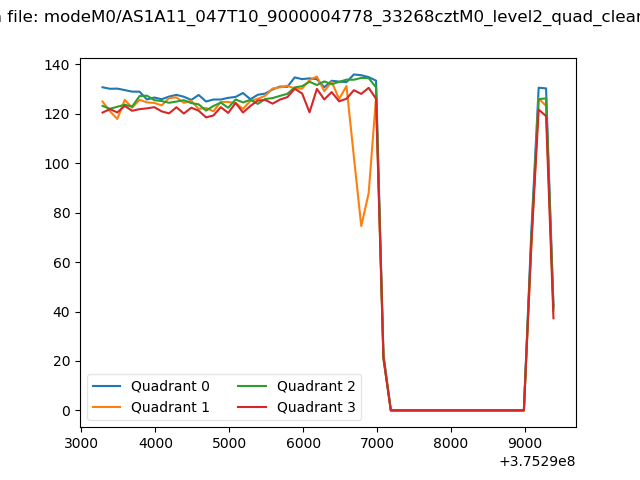 |
|
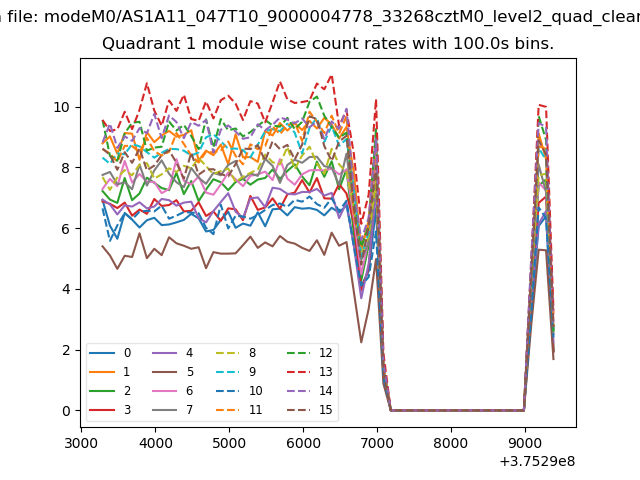
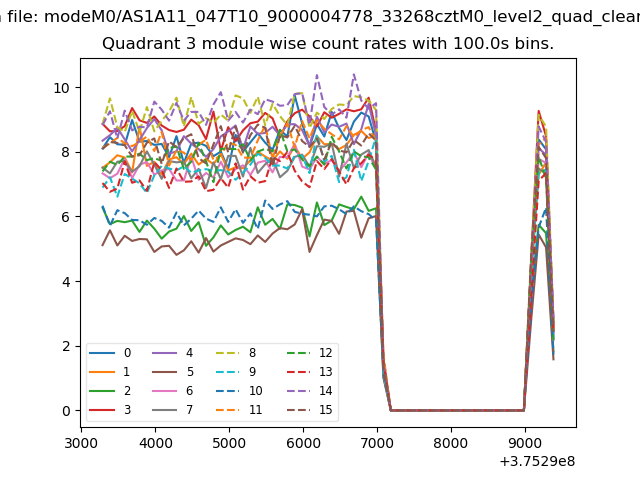
| Module-wise count rates for Quadrant A Data is divided into 100 sec bins |
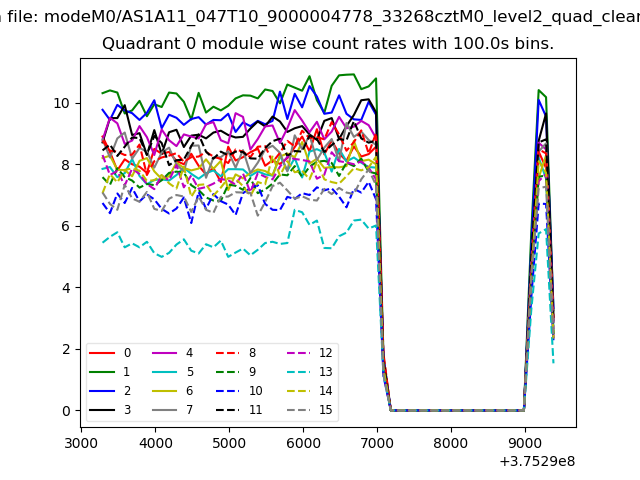 |
 |
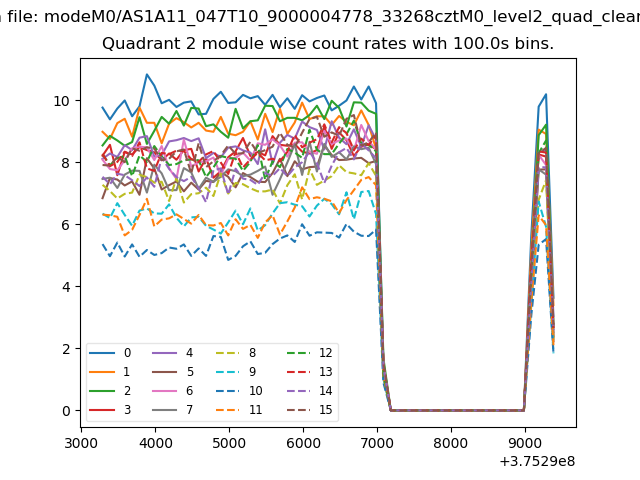
| Module-wise count rates for Quadrant B Data is divided into 100 sec bins |
 |
 |
| Module-wise count rates for Quadrant C Data is divided into 100 sec bins |
 |
 |
| Module-wise count rates for Quadrant D Data is divided into 100 sec bins |
 |
 |
| Parameter | Plot |
|---|---|
| CZT HV Monitor | 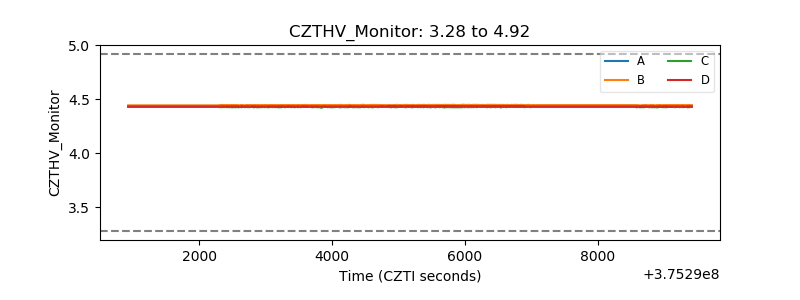 |
| D_VDD |  |
| Temperature 1 | 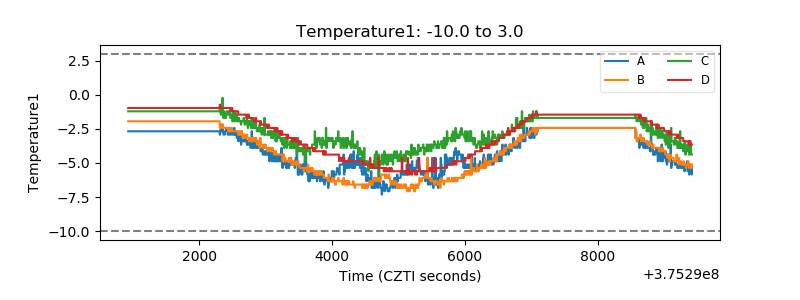 |
| Veto HV Monitor | 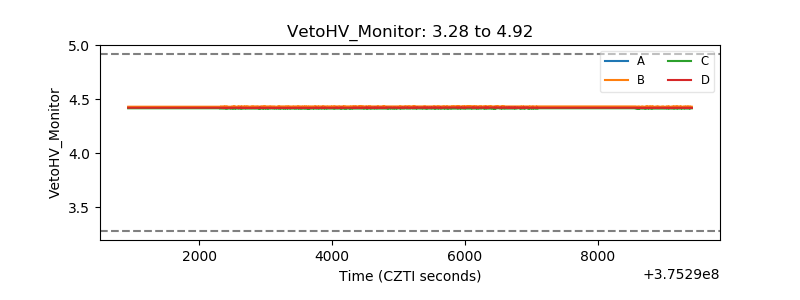 |
| Veto LLD | 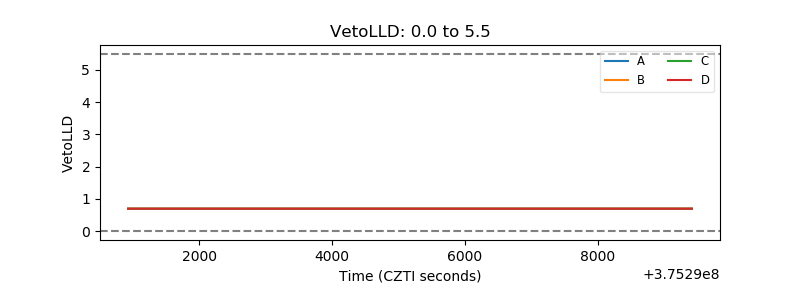 |
| Alpha Counter | 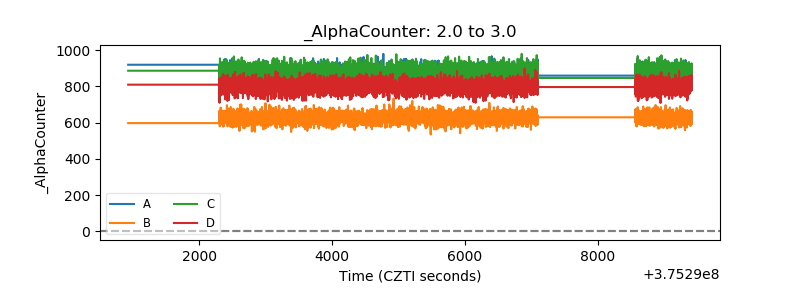 |
| _CPM_Rate | 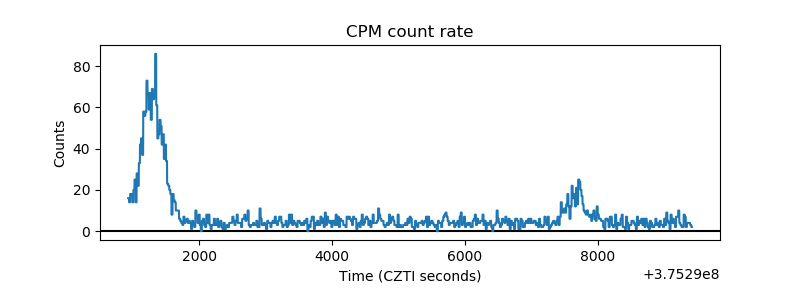 |
| CZT Counter | 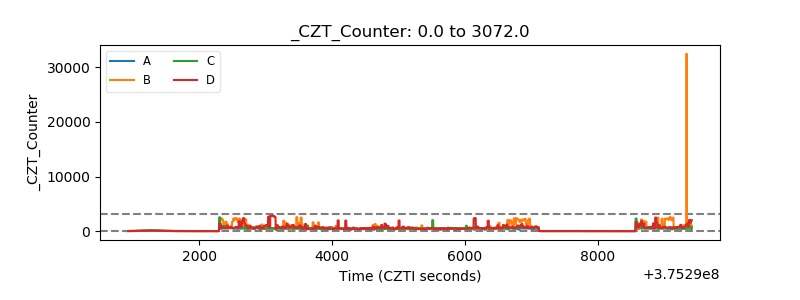 |
| +2.5 Volts monitor |  |
| +5 Volts monitor | 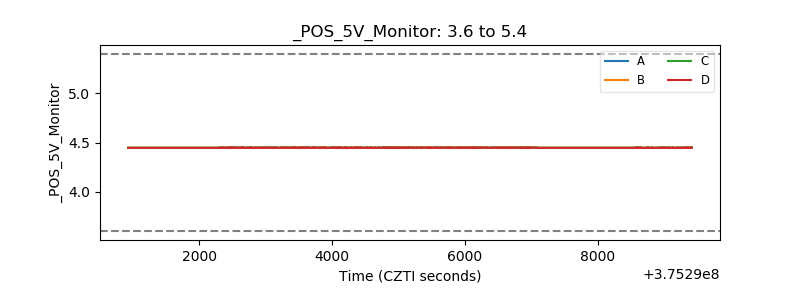 |
| _ROLL_ROT | 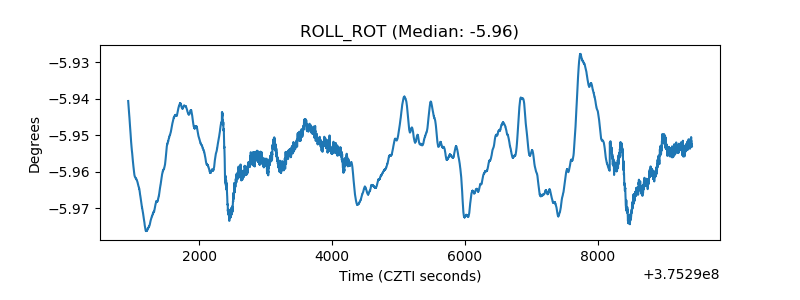 |
| _Roll_DEC | 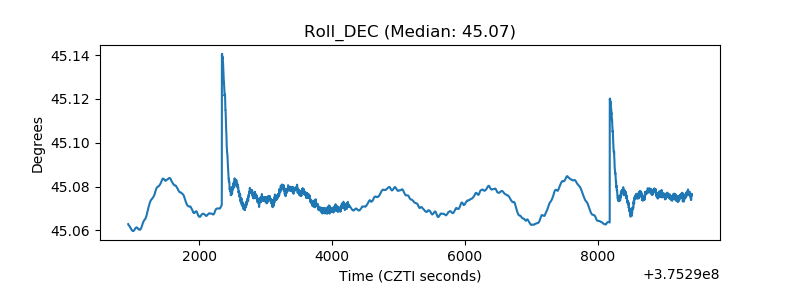 |
| _Roll_RA | 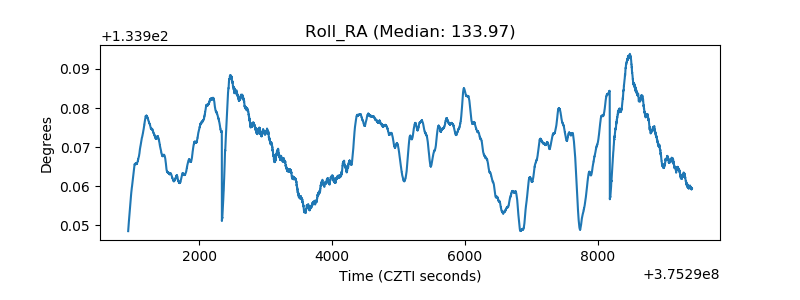 |
| Veto Counter | 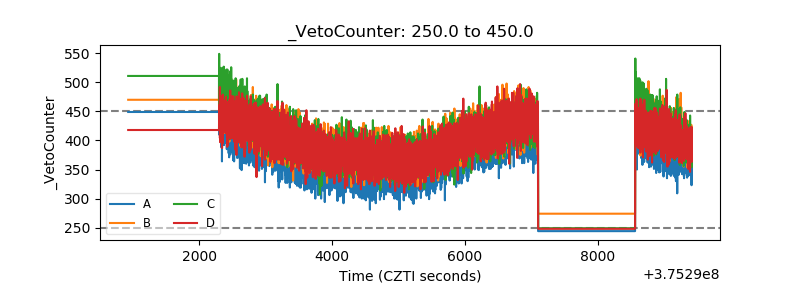 |