| Param | Original file | Final file |
|---|---|---|
| Filename | modeM0/AS1A11_047T10_9000004778_33269cztM0_level2.evt | modeM0/AS1A11_047T10_9000004778_33269cztM0_level2_quad_clean.evt |
| Size (bytes) | 512,277,120 | 90,581,760 |
| Size | 488.5 MB | 86.4 MB |
| Events in quadrant A | 2,708,210 | 603,338 |
| Events in quadrant B | 4,454,094 | 576,017 |
| Events in quadrant C | 3,300,390 | 586,749 |
| Events in quadrant D | 4,655,513 | 568,406 |
| Mode M0 | |||
|---|---|---|---|
| Quadrant | BADHDUFLAG | Total packets | Discarded packets |
| A | 0 | 11909 | 3 |
| B | 0 | 17009 | 2 |
| C | 0 | 13329 | 2 |
| D | 0 | 18049 | 2 |
| Mode SS | |||
|---|---|---|---|
| Quadrant | BADHDUFLAG | Total packets | Discarded packets |
| A | 0 | 118 | 0 |
| B | 0 | 118 | 0 |
| C | 0 | 118 | 0 |
| D | 0 | 118 | 0 |
| Mode M9 | |||
|---|---|---|---|
| Quadrant | BADHDUFLAG | Total packets | Discarded packets |
| A | 0 | 17 | 0 |
| B | 0 | 17 | 0 |
| C | 0 | 17 | 0 |
| D | 0 | 18 | 0 |
| Quadrant | Total seconds | Saturated seconds | Saturation percentage |
|---|---|---|---|
| A | 5848 | 12 | 0.205198% |
| B | 5848 | 638 | 10.909713% |
| C | 5848 | 59 | 1.008892% |
| D | 5848 | 108 | 1.846785% |
Noise dominated data is calculated using 1-second bins in cleaned event files. If a bin has >2000 counts, and if more than 50% of those come from <1% of pixels, then it is considered to be noise-dominated and hence unusable.
| Quadrant | # 1 sec bins | Bins with >0 counts | Bins with >2000 counts | High rate bins dominated by noise | Noise dominated (total time) | Noise dominated (detector-on time) | Marked lightcurve |
|---|---|---|---|---|---|---|---|
| A | 7162 | 5849 | 3 | 3 | 0.04% | 0.05% | 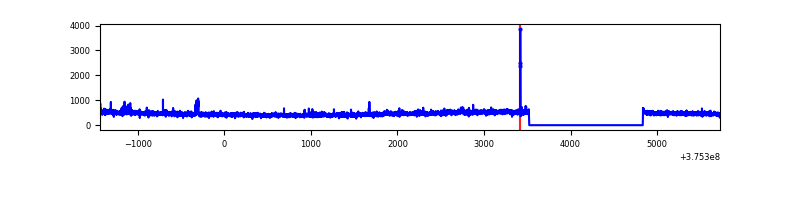 |
| B | 7162 | 5849 | 471 | 471 | 6.58% | 8.05% | 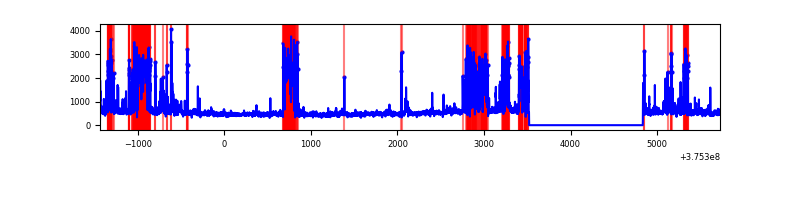 |
| C | 7162 | 5849 | 51 | 51 | 0.71% | 0.87% | 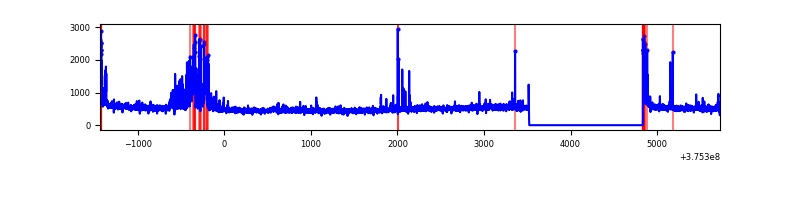 |
| D | 7162 | 5849 | 85 | 85 | 1.19% | 1.45% | 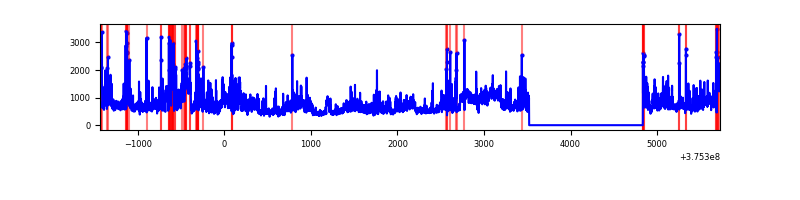 |
Top three noisy pixels from each quadrant. If the there are fewer than three noisy pixels in the level2.evt file, extra rows are filled as -1
| Pixel properties | Quadrant properties | ||||||
|---|---|---|---|---|---|---|---|
| Quadrant | DetID | PixID | Counts | Sigma | Mean | Median | Sigma |
| A | 12 | 16 | 28788 | 205.71 | 682 | 669 | 136.7 |
| A | 15 | 169 | 13724 | 95.5 | 682 | 669 | 136.7 |
| A | 15 | 17 | 11253 | 77.43 | 682 | 669 | 136.7 |
| B | 5 | 172 | 1439534 | 11639.39 | 642 | 624 | 123.6 |
| B | 0 | 230 | 193687 | 1561.69 | 642 | 624 | 123.6 |
| B | 5 | 200 | 92021 | 739.31 | 642 | 624 | 123.6 |
| C | 10 | 49 | 286731 | 1874.38 | 655 | 660 | 152.6 |
| C | 15 | 214 | 263603 | 1722.84 | 655 | 660 | 152.6 |
| C | 0 | 10 | 124181 | 809.33 | 655 | 660 | 152.6 |
| D | 8 | 195 | 1189123 | 6980.33 | 655 | 638 | 170.3 |
| D | 12 | 218 | 167782 | 981.69 | 655 | 638 | 170.3 |
| D | 12 | 233 | 167266 | 978.66 | 655 | 638 | 170.3 |
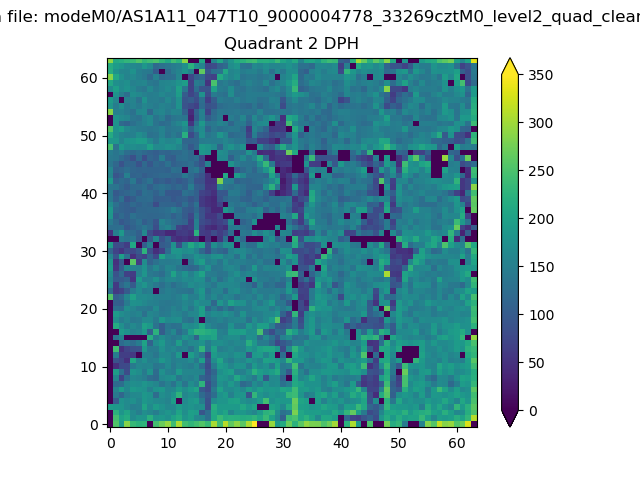
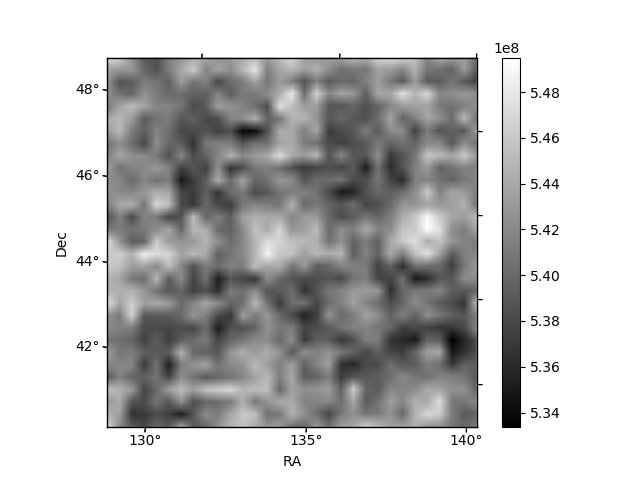
Histogram calculated using DETX and DETY for each event in the final _common_clean file
| Quadrant A | 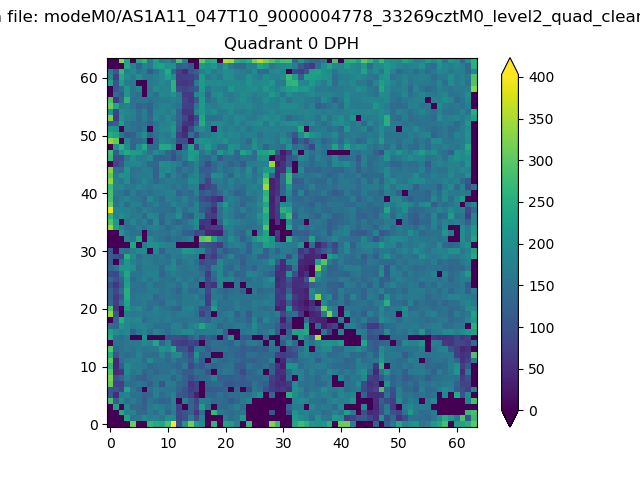 |
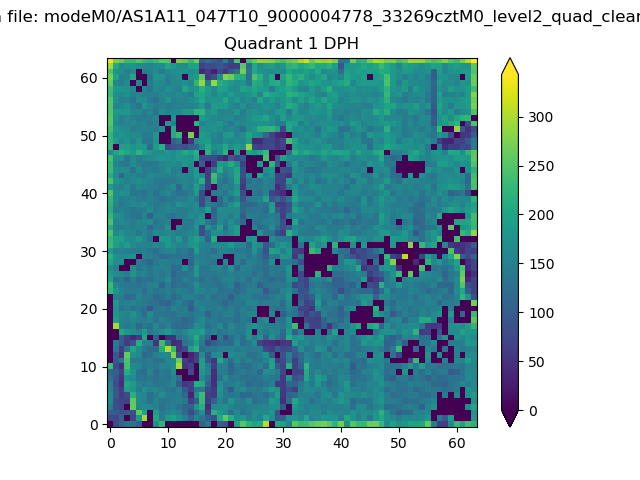 |
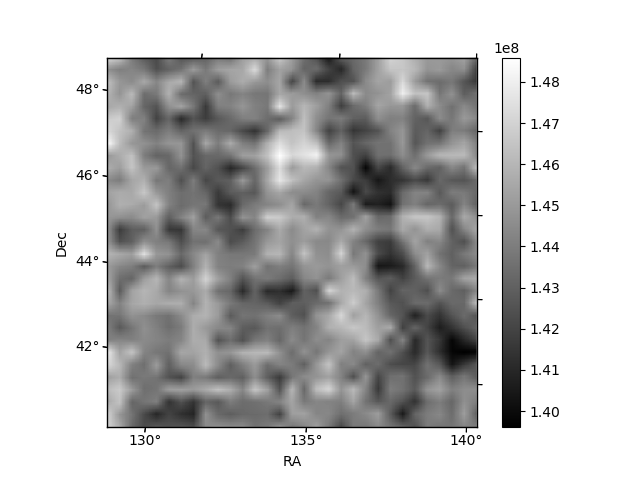
Quadrant B |
|---|---|---|---|
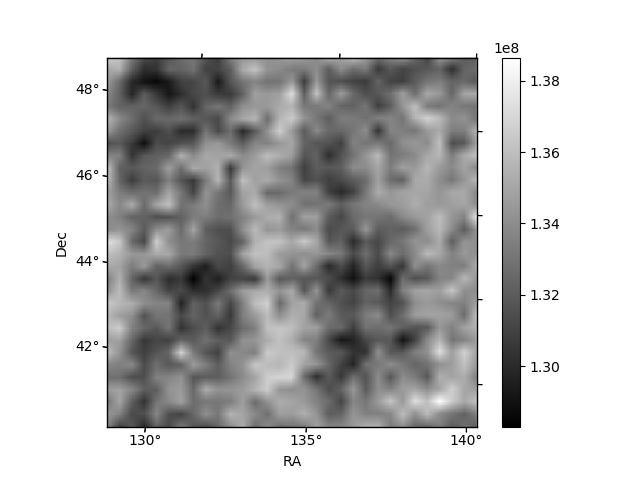
| Quadrant D | 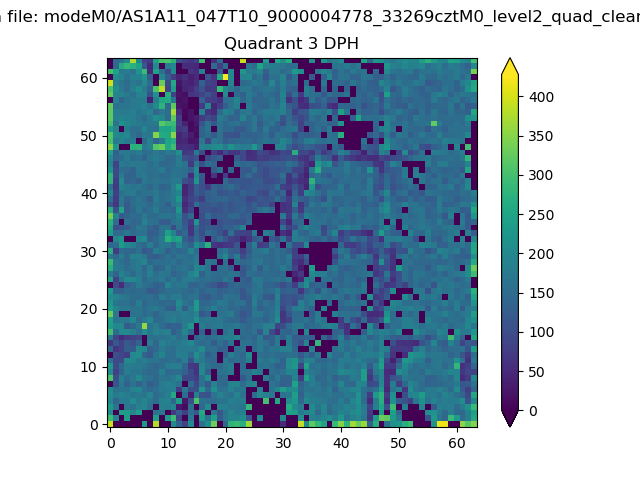 |
 |
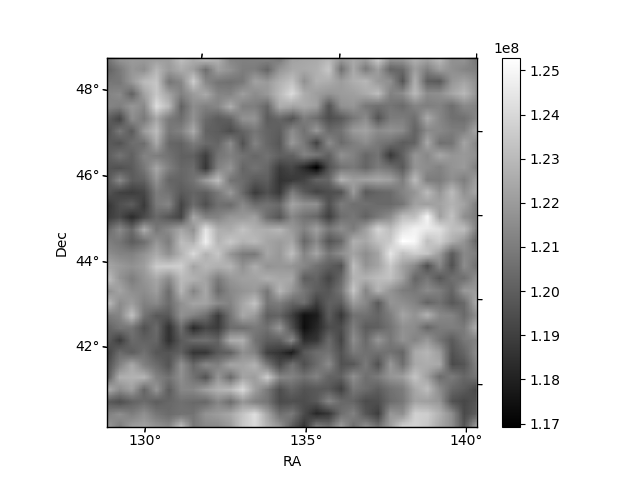
Quadrant C |
| Plot type | Count rate plots | Images |
|---|---|---|
| Comparison with Poisson distribution Blue bars denote a histogram of data divided into 1 sec bins. Red curve is a Poisson curve with rate = median count rate of data. |
 |
 |
| Quadrant-wise count rates Data is divided into 100 sec bins |
 |
|
| Module-wise count rates for Quadrant A Data is divided into 100 sec bins |
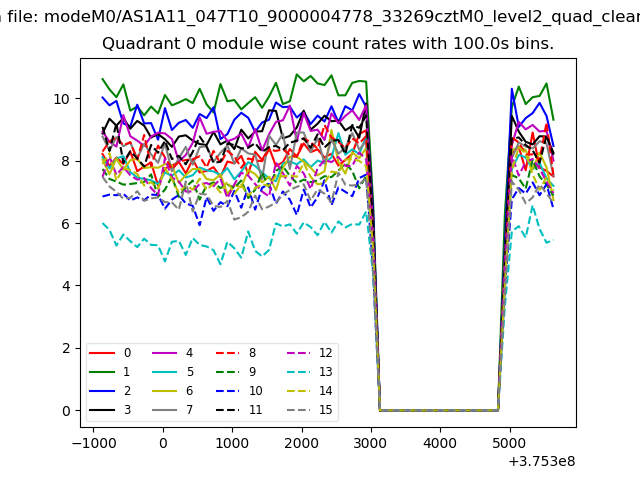 |
 |
| Module-wise count rates for Quadrant B Data is divided into 100 sec bins |
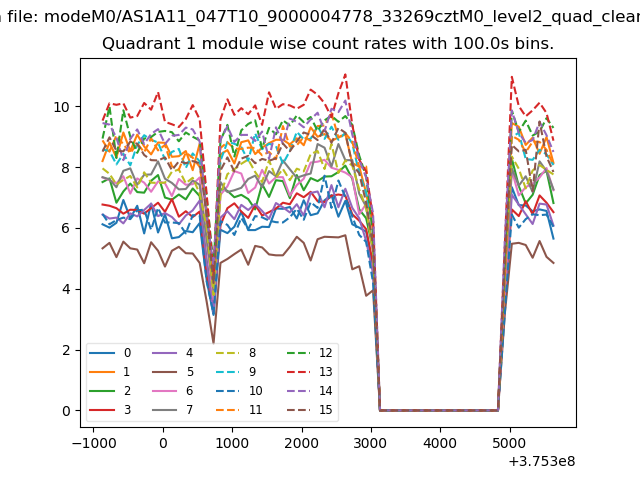 |
 |
| Module-wise count rates for Quadrant C Data is divided into 100 sec bins |
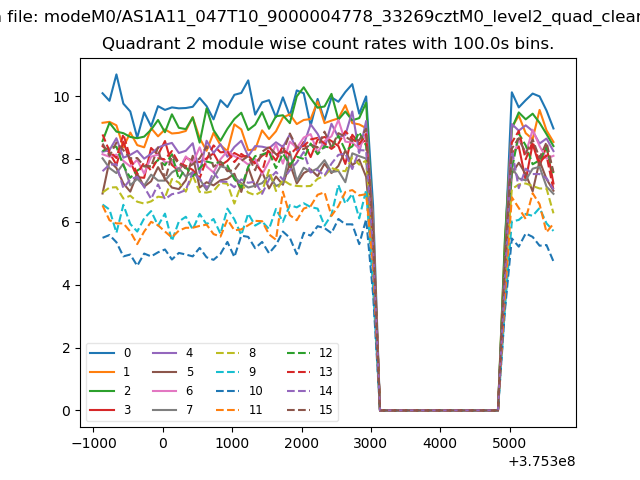 |
 |
| Module-wise count rates for Quadrant D Data is divided into 100 sec bins |
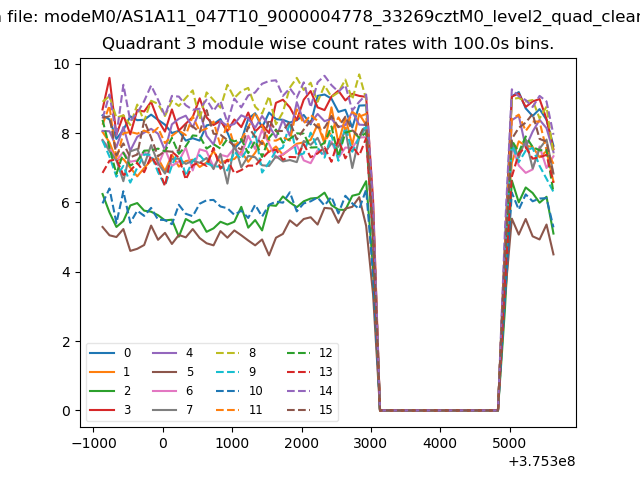 |
 |
| Parameter | Plot |
|---|---|
| CZT HV Monitor | 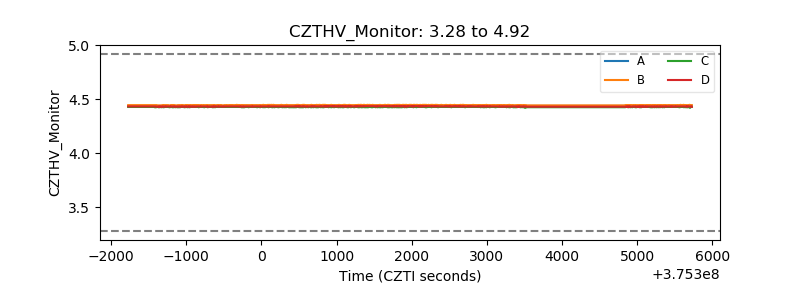 |
| D_VDD | 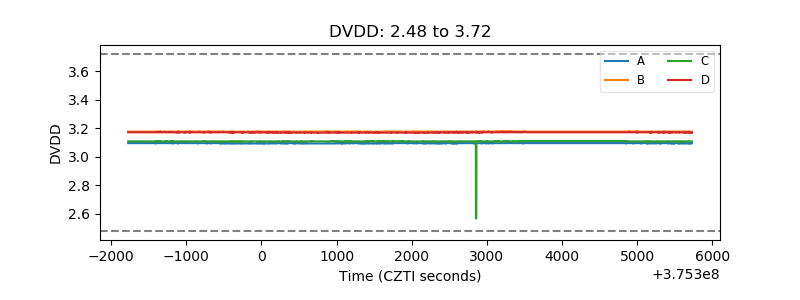 |
| Temperature 1 | 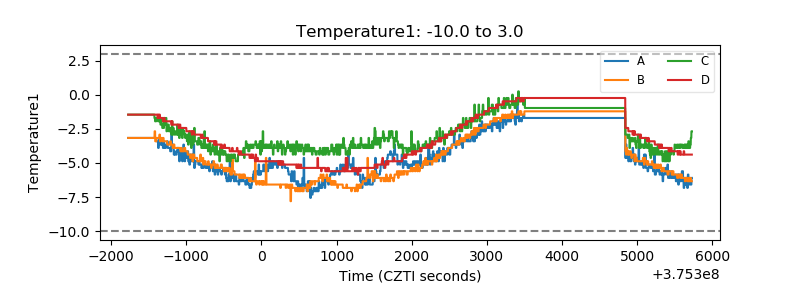 |
| Veto HV Monitor | 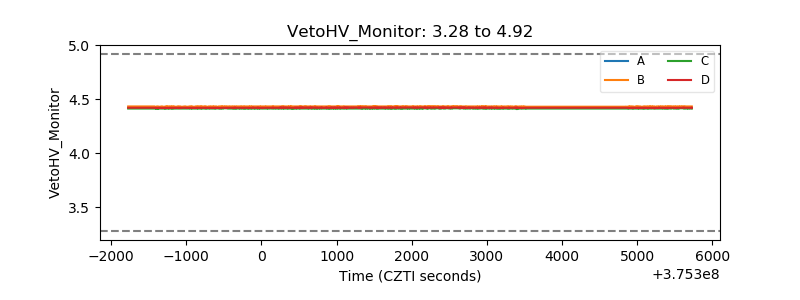 |
| Veto LLD | 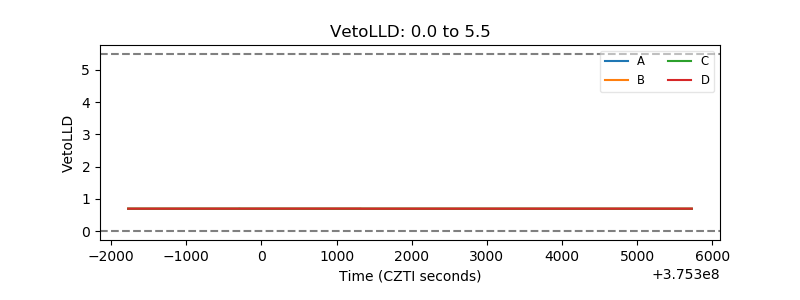 |
| Alpha Counter |  |
| _CPM_Rate | 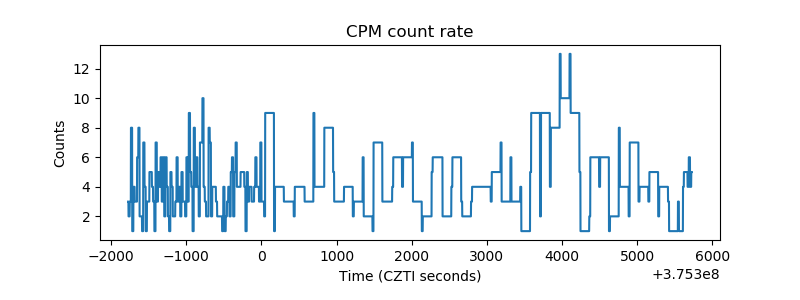 |
| CZT Counter | 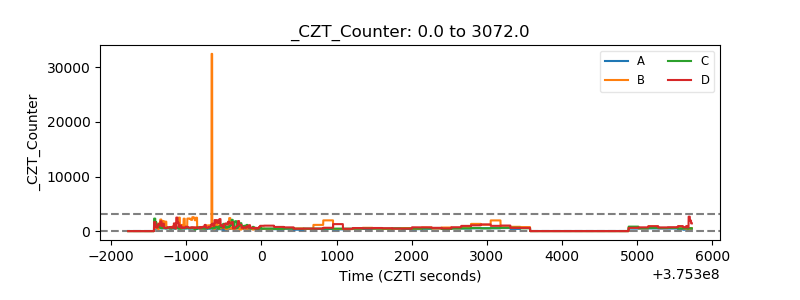 |
| +2.5 Volts monitor |  |
| +5 Volts monitor |  |
| _ROLL_ROT | 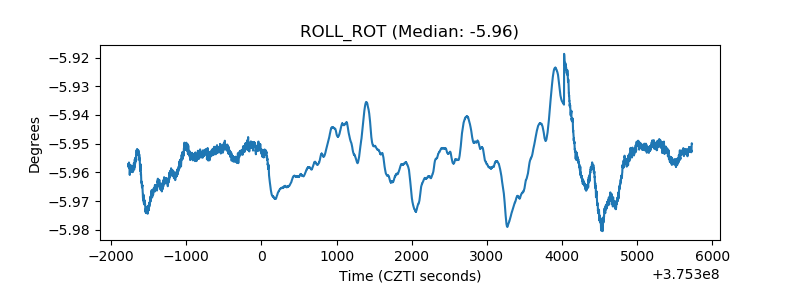 |
| _Roll_DEC | 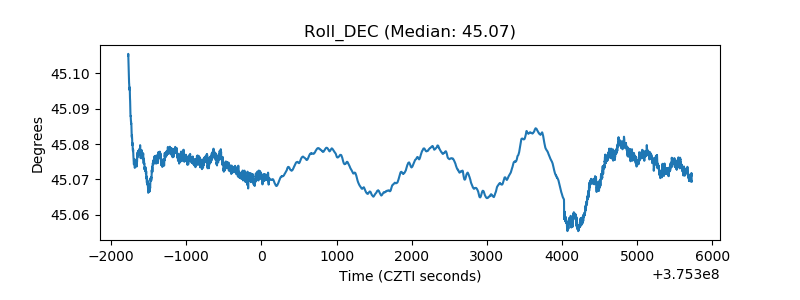 |
| _Roll_RA | 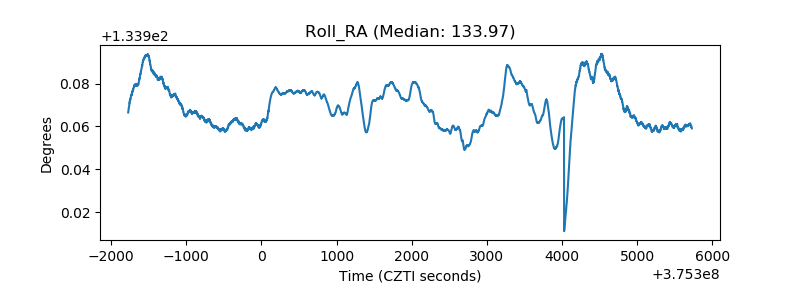 |
| Veto Counter | 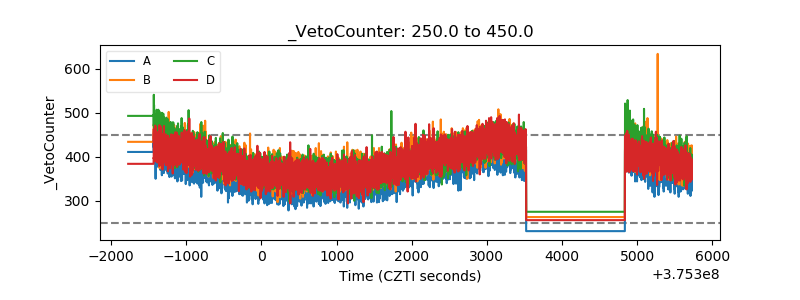 |