| Param | Original file | Final file |
|---|---|---|
| Filename | modeM0/AS1A11_047T10_9000004778_33270cztM0_level2.evt | modeM0/AS1A11_047T10_9000004778_33270cztM0_level2_quad_clean.evt |
| Size (bytes) | 507,329,280 | 94,250,880 |
| Size | 483.8 MB | 89.9 MB |
| Events in quadrant A | 2,818,893 | 620,003 |
| Events in quadrant B | 4,051,582 | 606,096 |
| Events in quadrant C | 3,245,823 | 609,701 |
| Events in quadrant D | 4,829,511 | 587,457 |
| Mode M0 | |||
|---|---|---|---|
| Quadrant | BADHDUFLAG | Total packets | Discarded packets |
| A | 0 | 12537 | 3 |
| B | 0 | 16321 | 2 |
| C | 0 | 13370 | 2 |
| D | 0 | 18741 | 2 |
| Mode SS | |||
|---|---|---|---|
| Quadrant | BADHDUFLAG | Total packets | Discarded packets |
| A | 0 | 126 | 0 |
| B | 0 | 126 | 0 |
| C | 0 | 126 | 0 |
| D | 0 | 126 | 0 |
| Mode M9 | |||
|---|---|---|---|
| Quadrant | BADHDUFLAG | Total packets | Discarded packets |
| A | 0 | 27 | 0 |
| B | 0 | 27 | 0 |
| C | 0 | 27 | 0 |
| D | 0 | 27 | 0 |
| Quadrant | Total seconds | Saturated seconds | Saturation percentage |
|---|---|---|---|
| A | 6179 | 14 | 0.226574% |
| B | 6179 | 315 | 5.097912% |
| C | 6179 | 38 | 0.614986% |
| D | 6179 | 167 | 2.702703% |
Noise dominated data is calculated using 1-second bins in cleaned event files. If a bin has >2000 counts, and if more than 50% of those come from <1% of pixels, then it is considered to be noise-dominated and hence unusable.
| Quadrant | # 1 sec bins | Bins with >0 counts | Bins with >2000 counts | High rate bins dominated by noise | Noise dominated (total time) | Noise dominated (detector-on time) | Marked lightcurve |
|---|---|---|---|---|---|---|---|
| A | 8806 | 6181 | 3 | 3 | 0.03% | 0.05% | 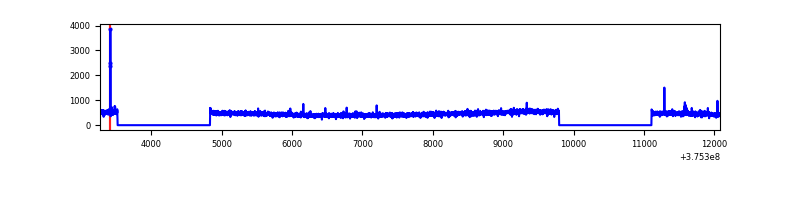 |
| B | 8806 | 6181 | 180 | 180 | 2.04% | 2.91% | 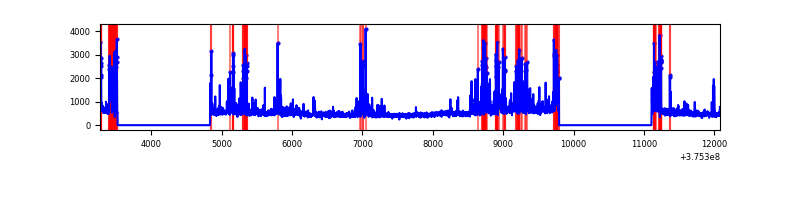 |
| C | 8806 | 6181 | 31 | 31 | 0.35% | 0.50% | 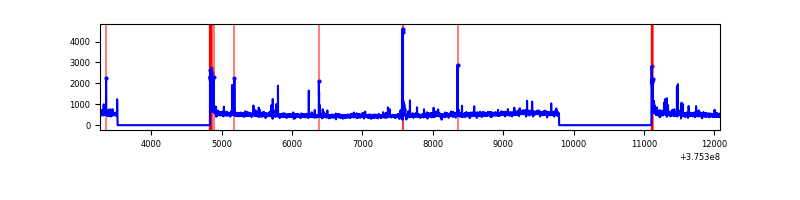 |
| D | 8806 | 6181 | 137 | 137 | 1.56% | 2.22% | 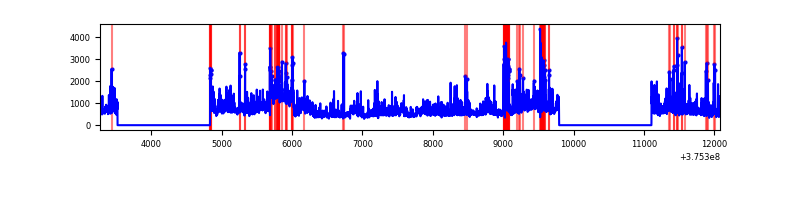 |
Top three noisy pixels from each quadrant. If the there are fewer than three noisy pixels in the level2.evt file, extra rows are filled as -1
| Pixel properties | Quadrant properties | ||||||
|---|---|---|---|---|---|---|---|
| Quadrant | DetID | PixID | Counts | Sigma | Mean | Median | Sigma |
| A | 13 | 6 | 14935 | 99.24 | 718 | 705 | 143.4 |
| A | 15 | 169 | 12941 | 85.33 | 718 | 705 | 143.4 |
| A | 13 | 254 | 10863 | 70.84 | 718 | 705 | 143.4 |
| B | 5 | 172 | 682506 | 5091.02 | 698 | 681 | 133.9 |
| B | 4 | 170 | 243331 | 1811.81 | 698 | 681 | 133.9 |
| B | 5 | 200 | 133694 | 993.18 | 698 | 681 | 133.9 |
| C | 15 | 214 | 279850 | 1736.91 | 693 | 697 | 160.7 |
| C | 0 | 10 | 101406 | 626.62 | 693 | 697 | 160.7 |
| C | 14 | 254 | 71402 | 439.93 | 693 | 697 | 160.7 |
| D | 8 | 195 | 1254527 | 6770.55 | 687 | 671 | 185.2 |
| D | 2 | 249 | 231235 | 1244.99 | 687 | 671 | 185.2 |
| D | 12 | 218 | 114189 | 612.97 | 687 | 671 | 185.2 |
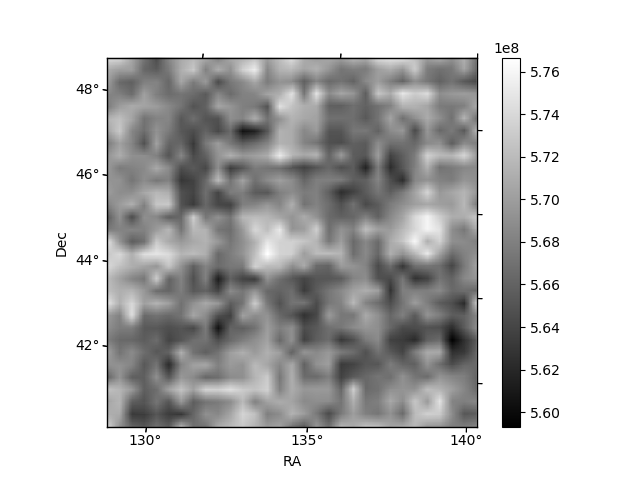
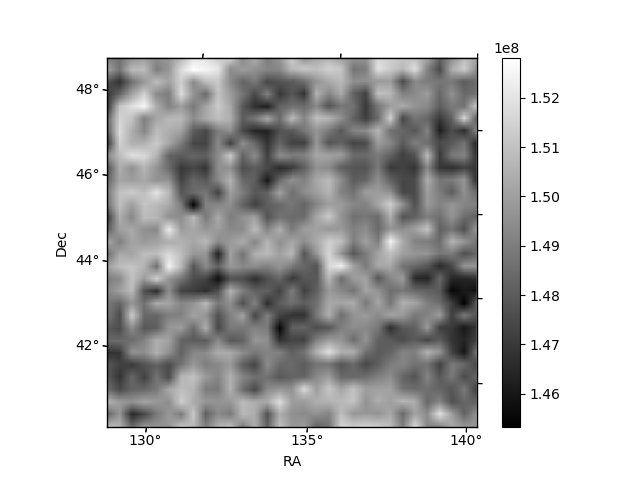
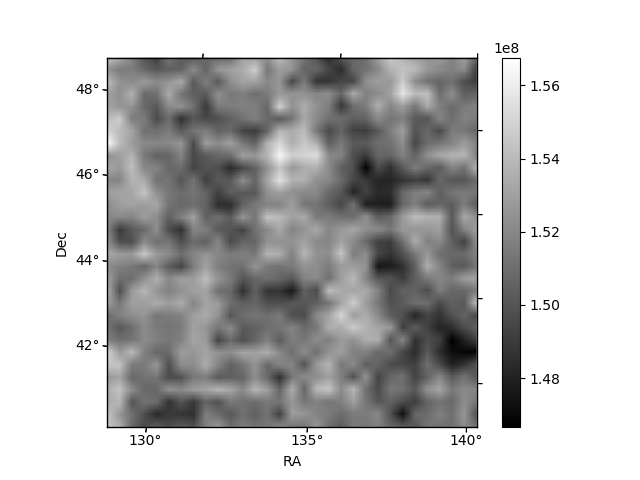
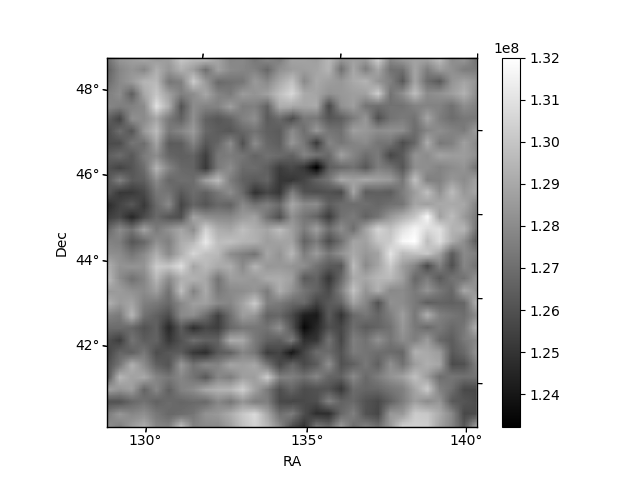
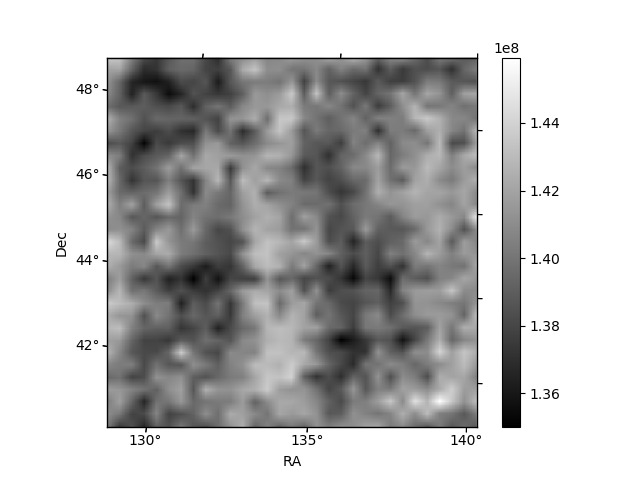
Histogram calculated using DETX and DETY for each event in the final _common_clean file
| Quadrant A | 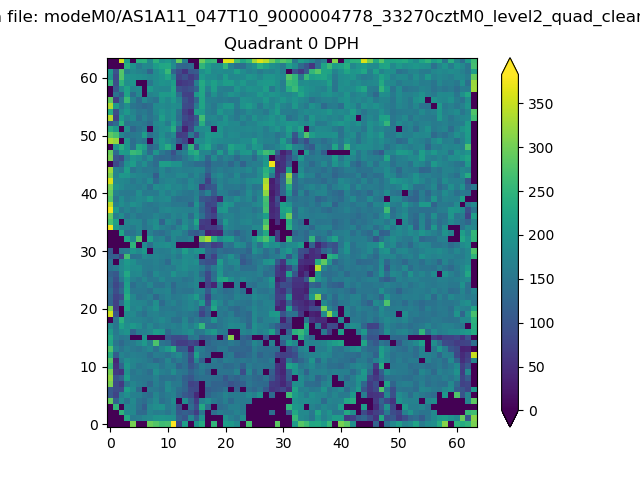 |
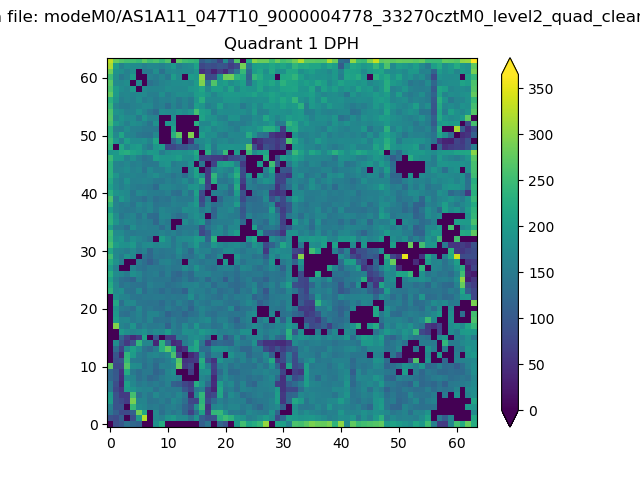 |
Quadrant B |
|---|---|---|---|
| Quadrant D |  |
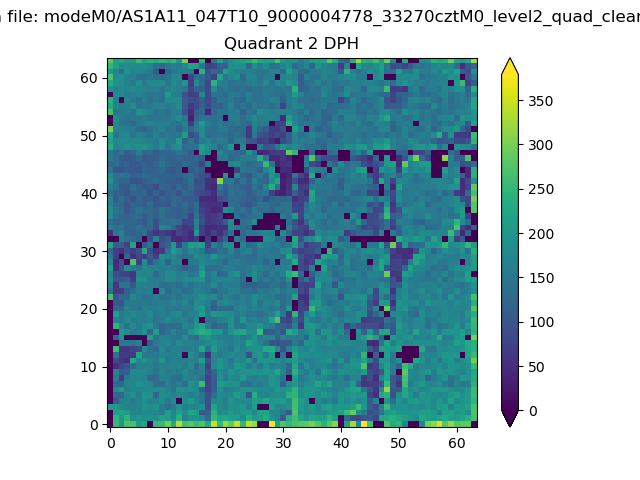 |
Quadrant C |
| Plot type | Count rate plots | Images |
|---|---|---|
| Comparison with Poisson distribution Blue bars denote a histogram of data divided into 1 sec bins. Red curve is a Poisson curve with rate = median count rate of data. |
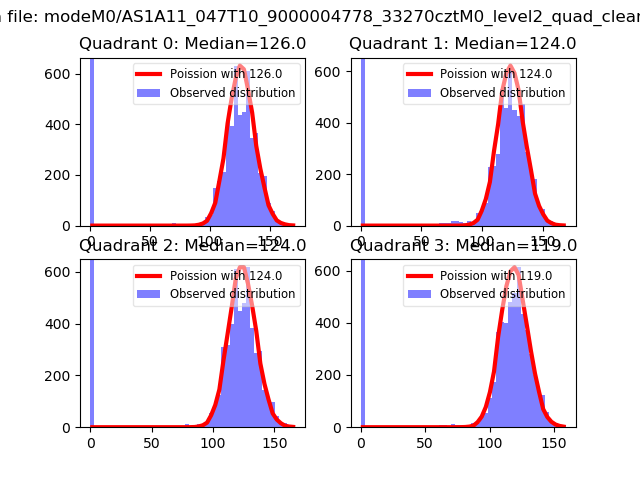 |
 |
| Quadrant-wise count rates Data is divided into 100 sec bins |
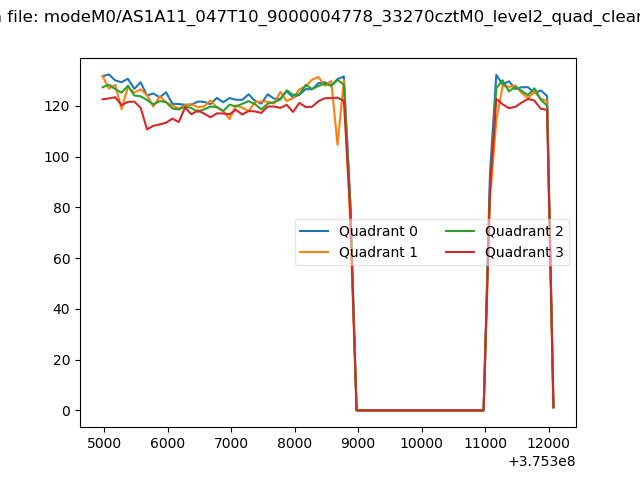 |
|
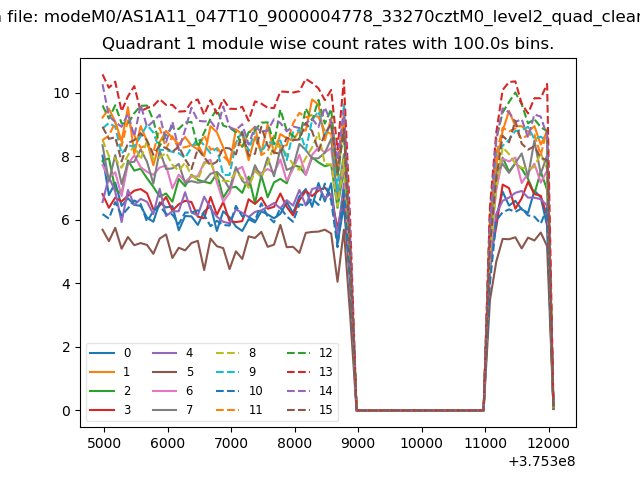
| Module-wise count rates for Quadrant A Data is divided into 100 sec bins |
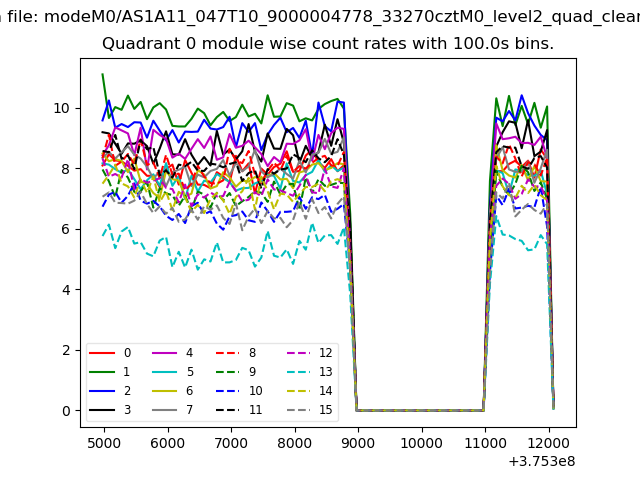 |
 |
| Module-wise count rates for Quadrant B Data is divided into 100 sec bins |
 |
 |
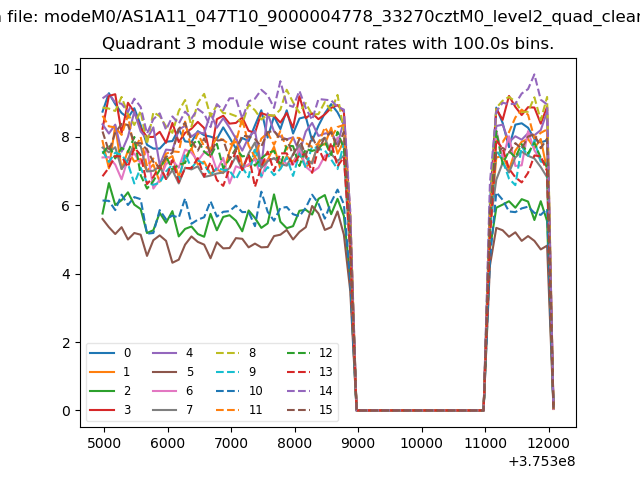
| Module-wise count rates for Quadrant C Data is divided into 100 sec bins |
 |
 |
| Module-wise count rates for Quadrant D Data is divided into 100 sec bins |
 |
 |
| Parameter | Plot |
|---|---|
| CZT HV Monitor | 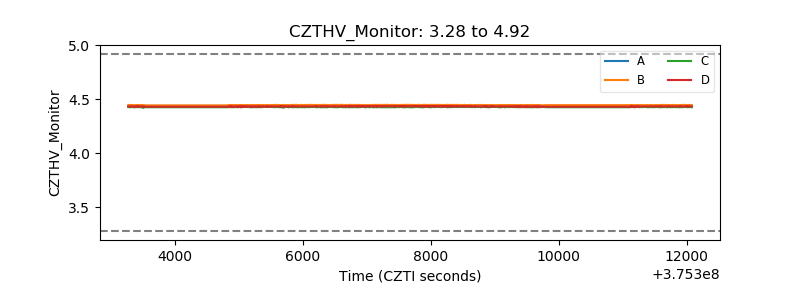 |
| D_VDD | 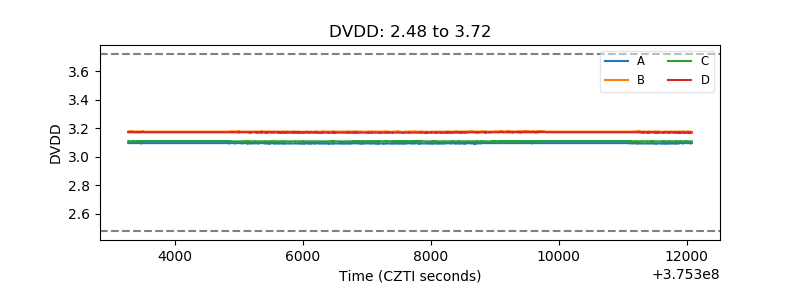 |
| Temperature 1 | 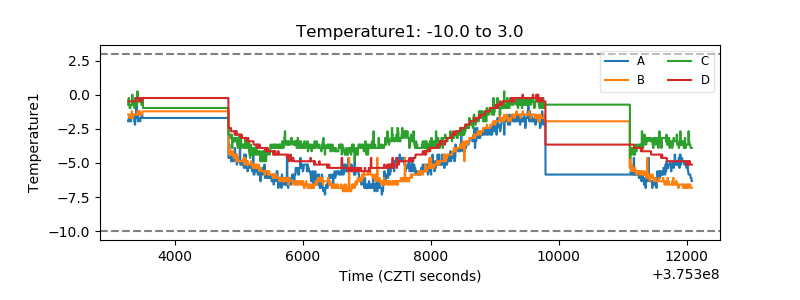 |
| Veto HV Monitor | 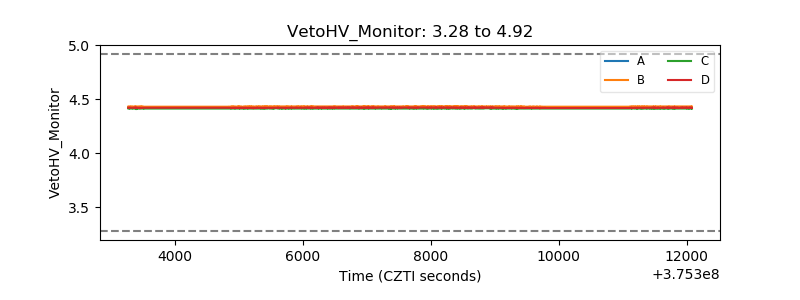 |
| Veto LLD | 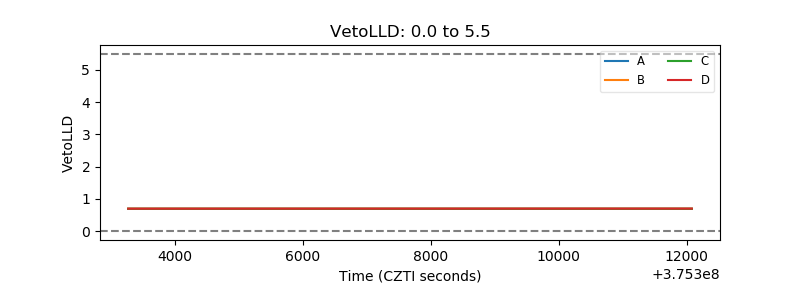 |
| Alpha Counter | 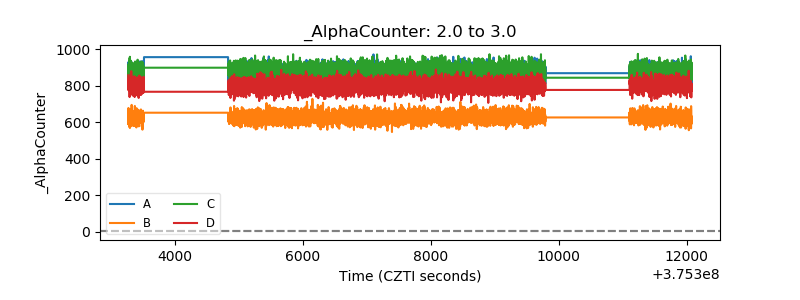 |
| _CPM_Rate | 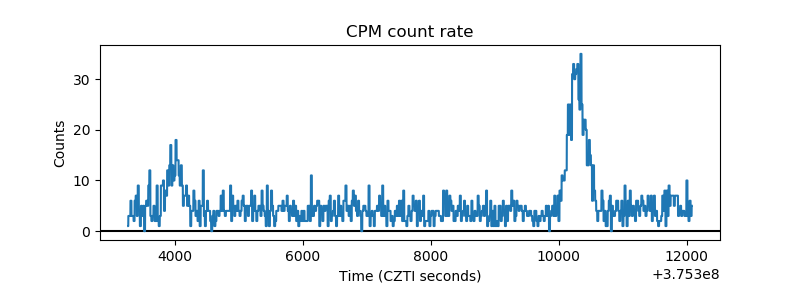 |
| CZT Counter | 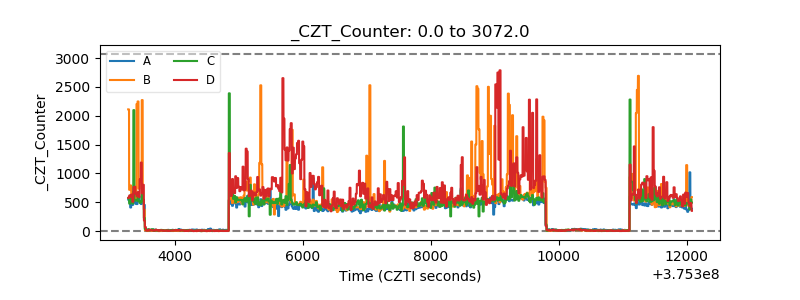 |
| +2.5 Volts monitor |  |
| +5 Volts monitor | 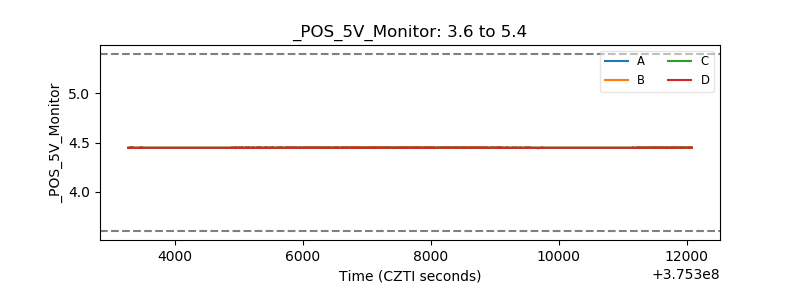 |
| _ROLL_ROT | 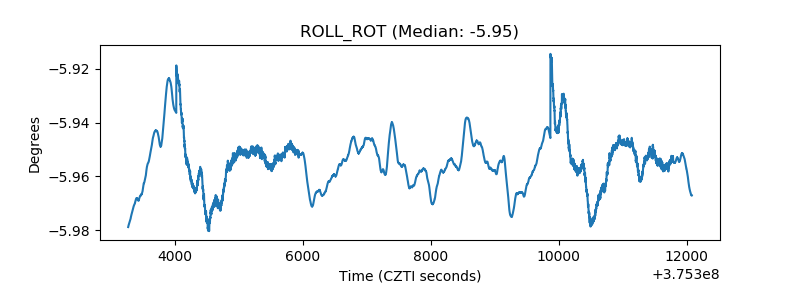 |
| _Roll_DEC | 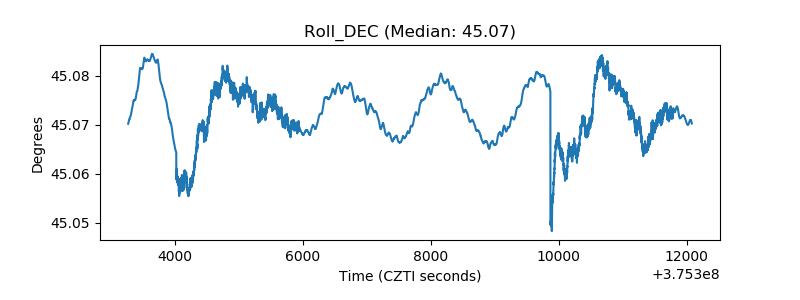 |
| _Roll_RA | 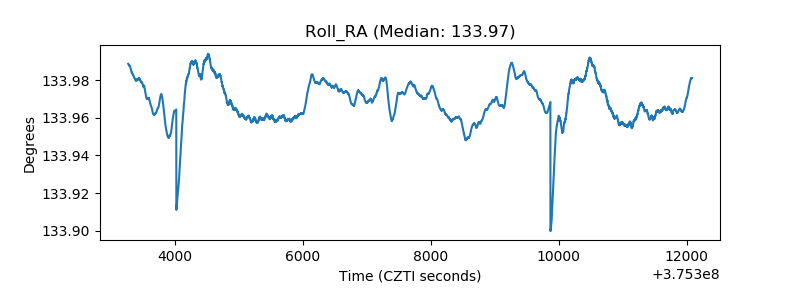 |
| Veto Counter | 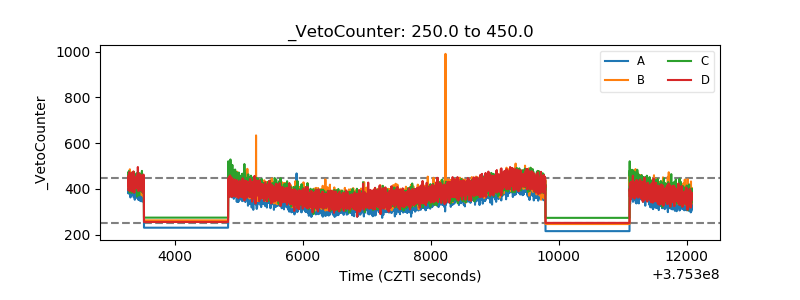 |