| Param | Original file | Final file |
|---|---|---|
| Filename | modeM0/AS1A11_047T10_9000004778_33272cztM0_level2.evt | modeM0/AS1A11_047T10_9000004778_33272cztM0_level2_quad_clean.evt |
| Size (bytes) | 986,503,680 | 152,084,160 |
| Size | 940.8 MB | 145.0 MB |
| Events in quadrant A | 5,181,274 | 980,311 |
| Events in quadrant B | 7,694,489 | 958,499 |
| Events in quadrant C | 5,927,910 | 965,192 |
| Events in quadrant D | 10,301,644 | 911,535 |
| Mode M0 | |||
|---|---|---|---|
| Quadrant | BADHDUFLAG | Total packets | Discarded packets |
| A | 0 | 23180 | 4 |
| B | 0 | 30974 | 3 |
| C | 0 | 24699 | 3 |
| D | 0 | 38669 | 3 |
| Mode SS | |||
|---|---|---|---|
| Quadrant | BADHDUFLAG | Total packets | Discarded packets |
| A | 0 | 234 | 0 |
| B | 0 | 234 | 0 |
| C | 0 | 234 | 0 |
| D | 0 | 234 | 0 |
| Mode M9 | |||
|---|---|---|---|
| Quadrant | BADHDUFLAG | Total packets | Discarded packets |
| A | 0 | 42 | 0 |
| B | 0 | 42 | 0 |
| C | 0 | 42 | 0 |
| D | 0 | 42 | 0 |
| Quadrant | Total seconds | Saturated seconds | Saturation percentage |
|---|---|---|---|
| A | 11425 | 18 | 0.157549% |
| B | 11425 | 718 | 6.284464% |
| C | 11425 | 42 | 0.367615% |
| D | 11425 | 732 | 6.407002% |
Noise dominated data is calculated using 1-second bins in cleaned event files. If a bin has >2000 counts, and if more than 50% of those come from <1% of pixels, then it is considered to be noise-dominated and hence unusable.
| Quadrant | # 1 sec bins | Bins with >0 counts | Bins with >2000 counts | High rate bins dominated by noise | Noise dominated (total time) | Noise dominated (detector-on time) | Marked lightcurve |
|---|---|---|---|---|---|---|---|
| A | 15574 | 11428 | 0 | 0 | 0.00% | 0.00% | 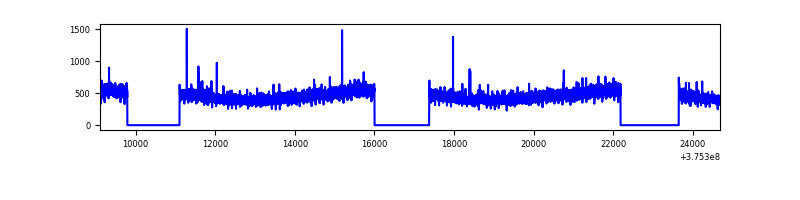 |
| B | 15574 | 11428 | 403 | 403 | 2.59% | 3.53% | 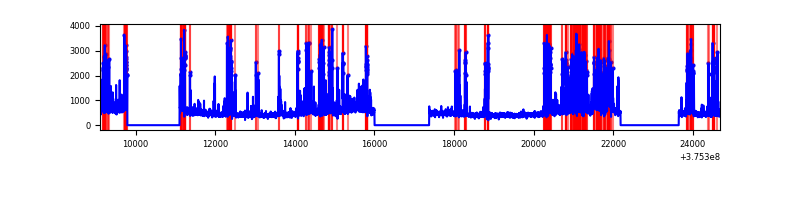 |
| C | 15574 | 11428 | 28 | 28 | 0.18% | 0.25% | 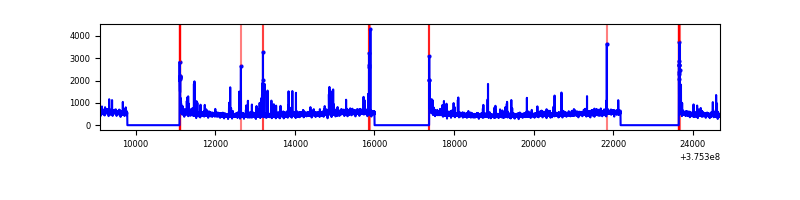 |
| D | 15574 | 11428 | 568 | 568 | 3.65% | 4.97% | 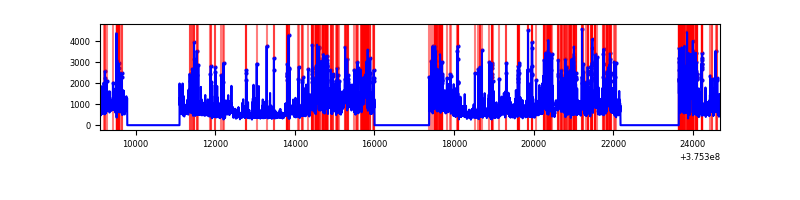 |
Top three noisy pixels from each quadrant. If the there are fewer than three noisy pixels in the level2.evt file, extra rows are filled as -1
| Pixel properties | Quadrant properties | ||||||
|---|---|---|---|---|---|---|---|
| Quadrant | DetID | PixID | Counts | Sigma | Mean | Median | Sigma |
| A | 13 | 6 | 28911 | 104.31 | 1327 | 1296 | 264.7 |
| A | 13 | 254 | 19534 | 68.89 | 1327 | 1296 | 264.7 |
| A | 15 | 169 | 13948 | 47.79 | 1327 | 1296 | 264.7 |
| B | 5 | 172 | 1937545 | 7859.81 | 1289 | 1256 | 246.4 |
| B | 5 | 200 | 213466 | 861.41 | 1289 | 1256 | 246.4 |
| B | 0 | 219 | 120249 | 483.02 | 1289 | 1256 | 246.4 |
| C | 15 | 214 | 504589 | 1723.37 | 1275 | 1288 | 292.0 |
| C | 0 | 10 | 138434 | 469.61 | 1275 | 1288 | 292.0 |
| C | 15 | 208 | 127956 | 433.73 | 1275 | 1288 | 292.0 |
| D | 8 | 195 | 2408999 | 7080.28 | 1245 | 1222 | 340.1 |
| D | 2 | 249 | 1265854 | 3718.76 | 1245 | 1222 | 340.1 |
| D | 12 | 6 | 400324 | 1173.59 | 1245 | 1222 | 340.1 |
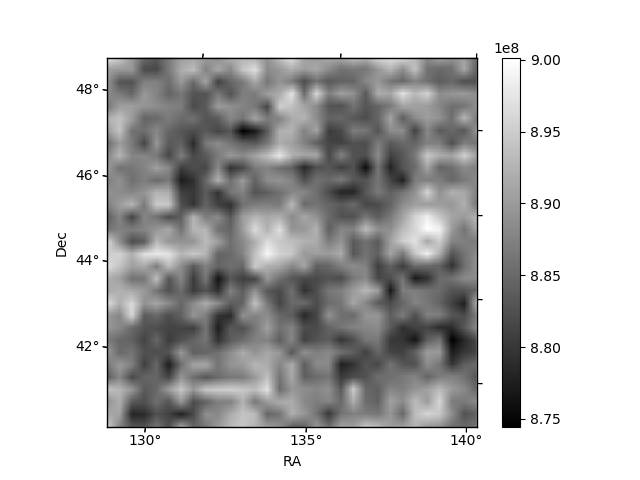
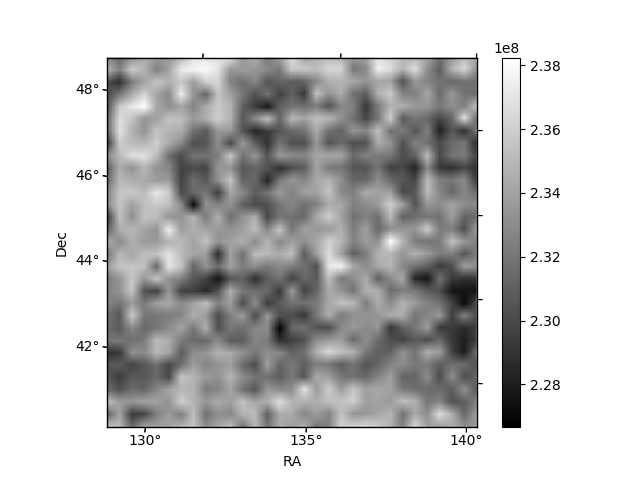
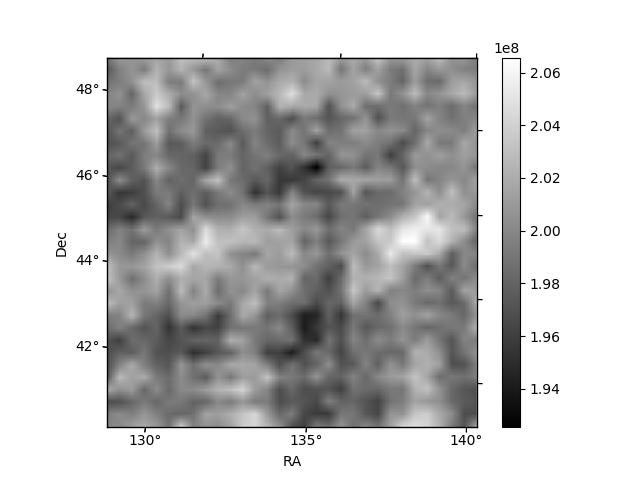
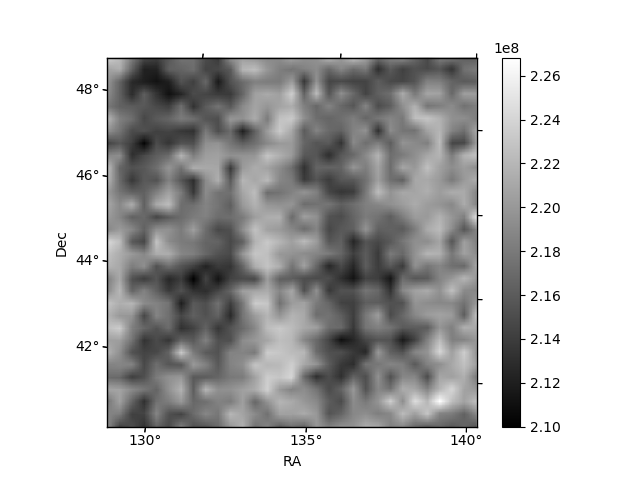
Histogram calculated using DETX and DETY for each event in the final _common_clean file
| Quadrant A | 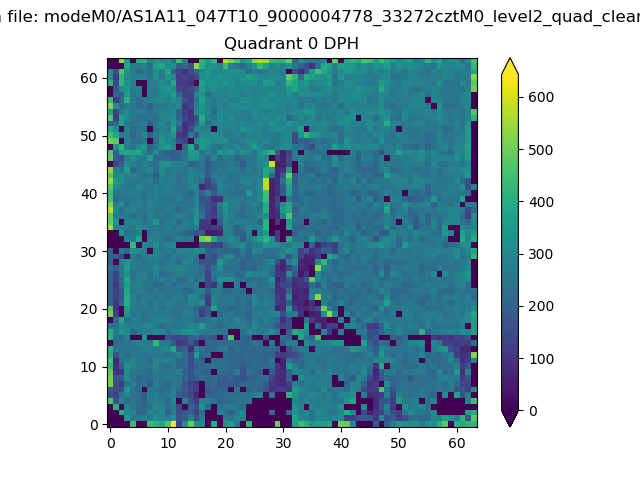 |
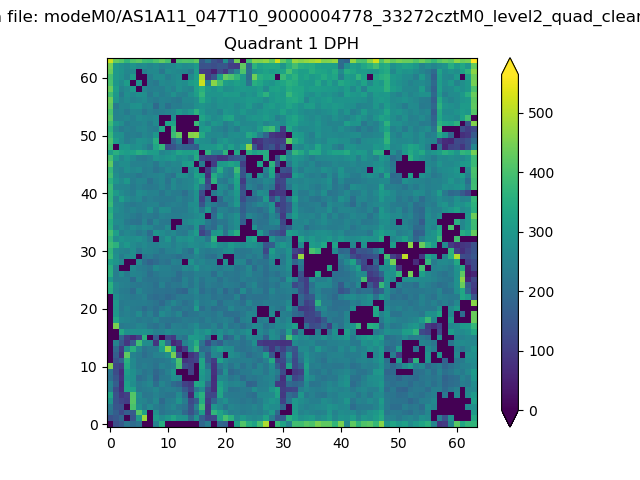 |
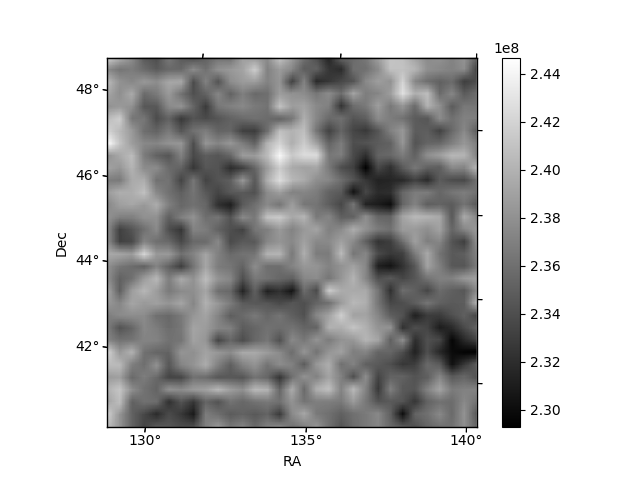
Quadrant B |
|---|---|---|---|
| Quadrant D | 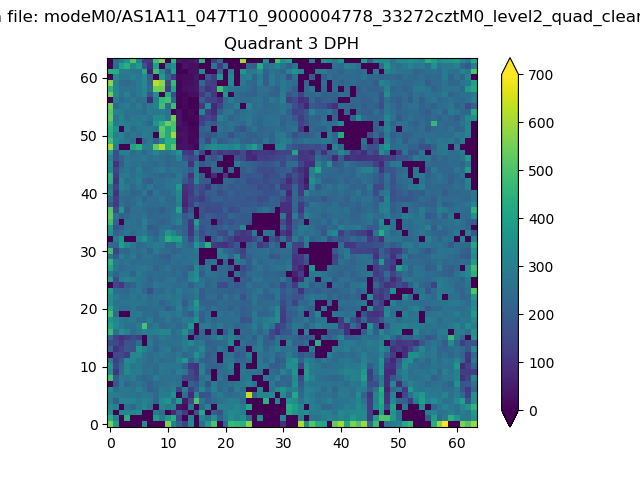 |
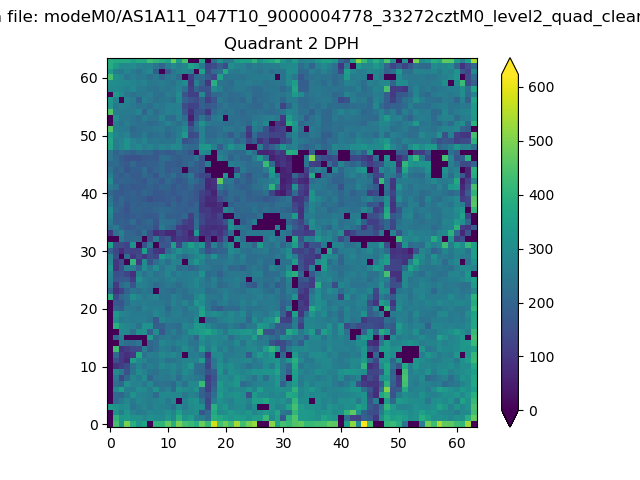 |
Quadrant C |
| Plot type | Count rate plots | Images |
|---|---|---|
| Comparison with Poisson distribution Blue bars denote a histogram of data divided into 1 sec bins. Red curve is a Poisson curve with rate = median count rate of data. |
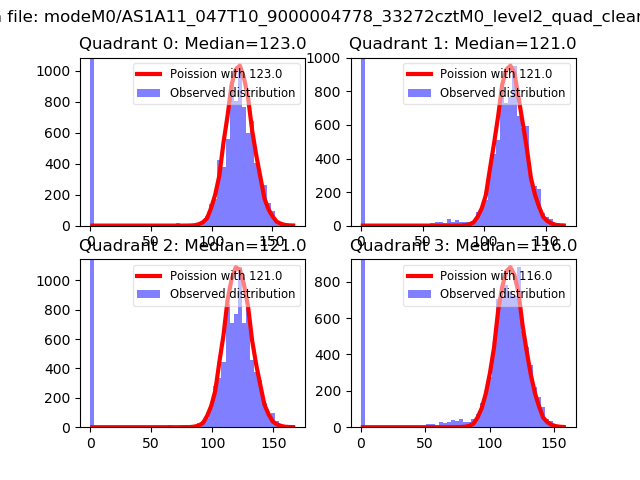 |
 |
| Quadrant-wise count rates Data is divided into 100 sec bins |
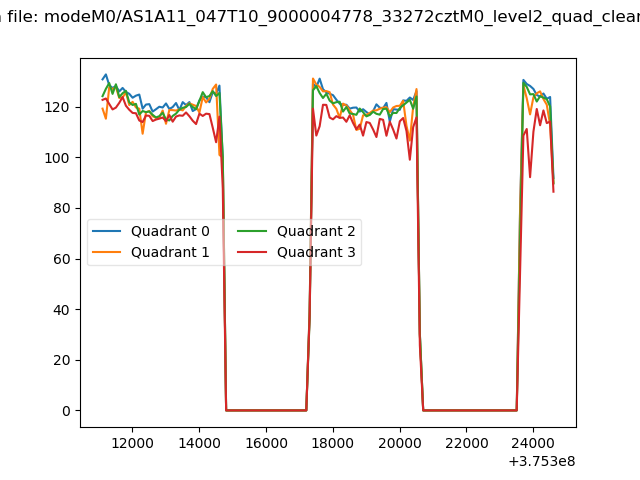 |
|
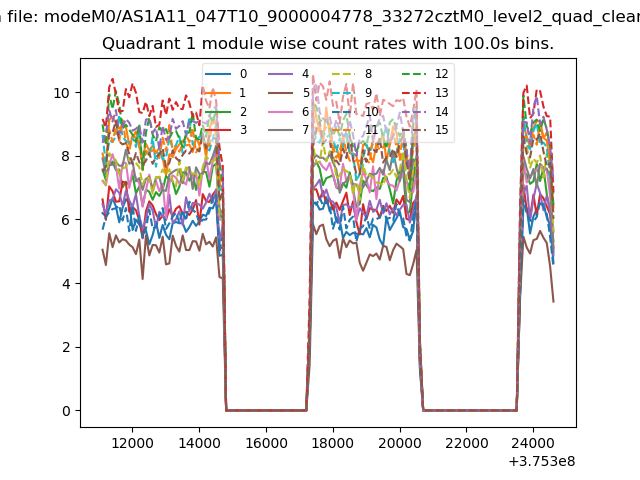
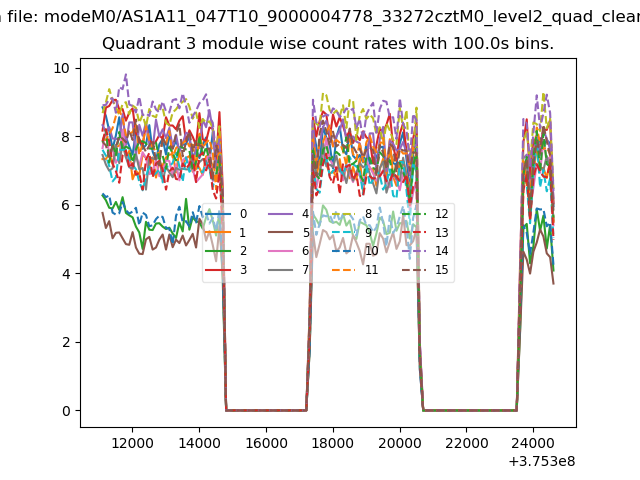
| Module-wise count rates for Quadrant A Data is divided into 100 sec bins |
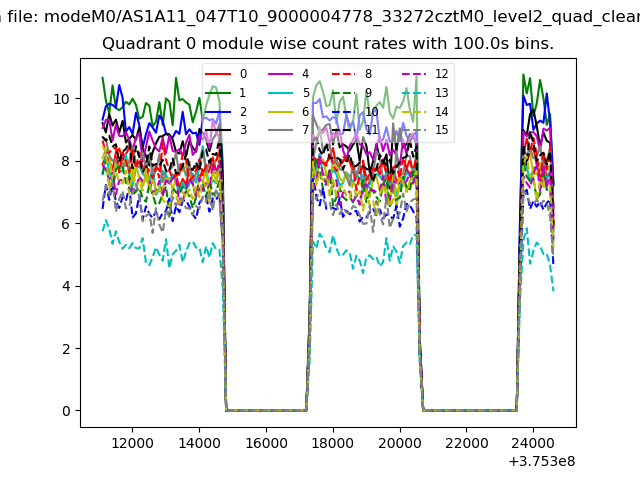 |
 |
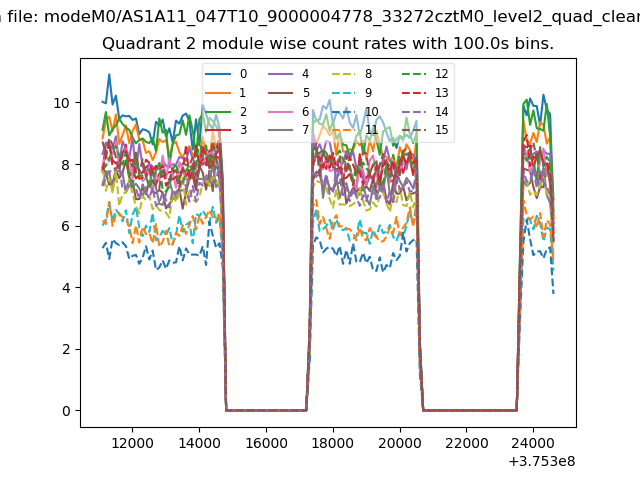
| Module-wise count rates for Quadrant B Data is divided into 100 sec bins |
 |
 |
| Module-wise count rates for Quadrant C Data is divided into 100 sec bins |
 |
 |
| Module-wise count rates for Quadrant D Data is divided into 100 sec bins |
 |
 |
| Parameter | Plot |
|---|---|
| CZT HV Monitor | 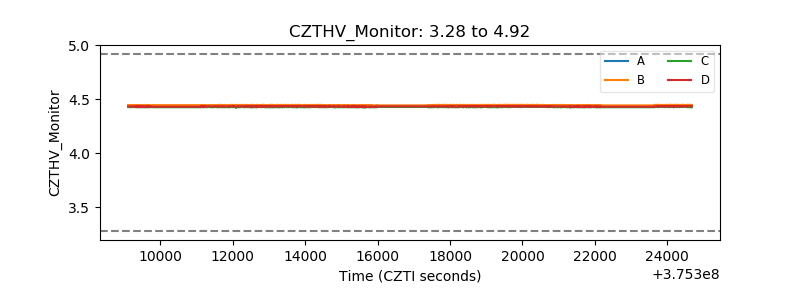 |
| D_VDD | 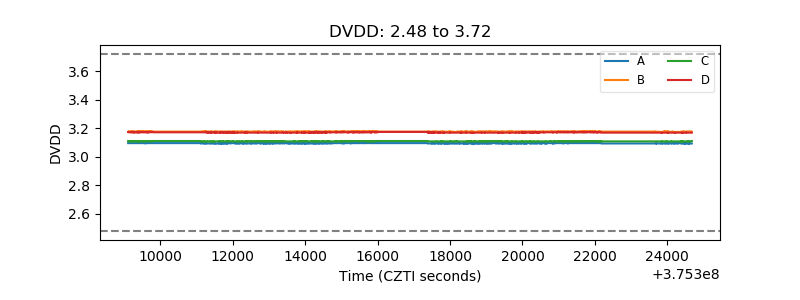 |
| Temperature 1 | 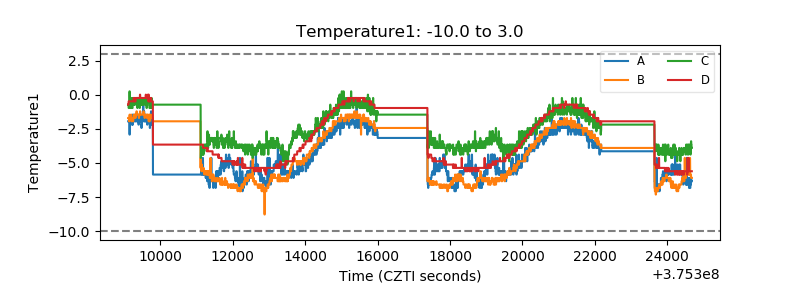 |
| Veto HV Monitor | 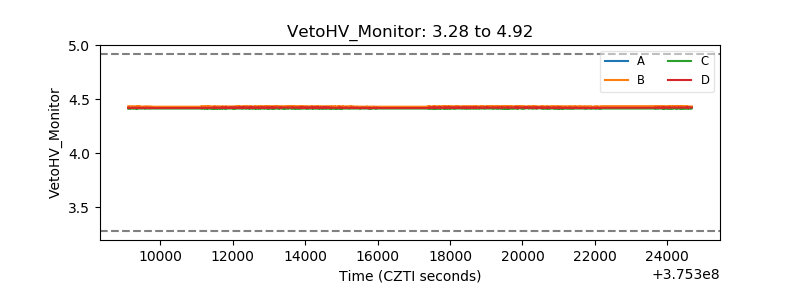 |
| Veto LLD | 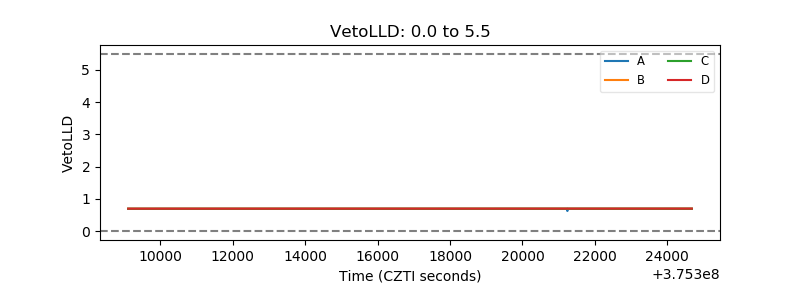 |
| Alpha Counter | 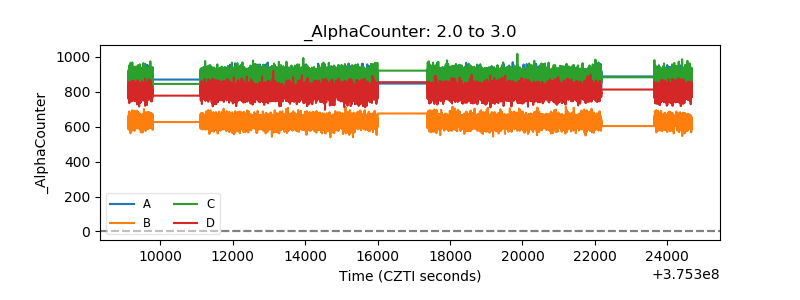 |
| _CPM_Rate | 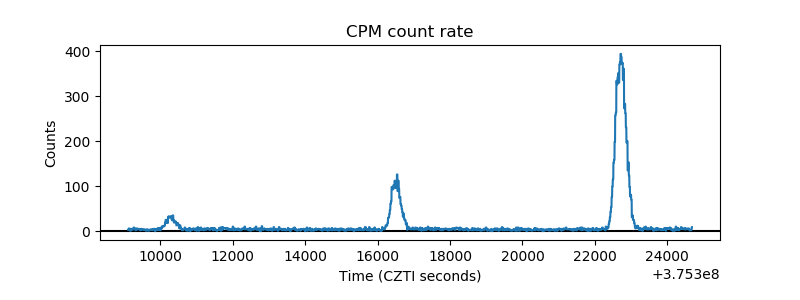 |
| CZT Counter | 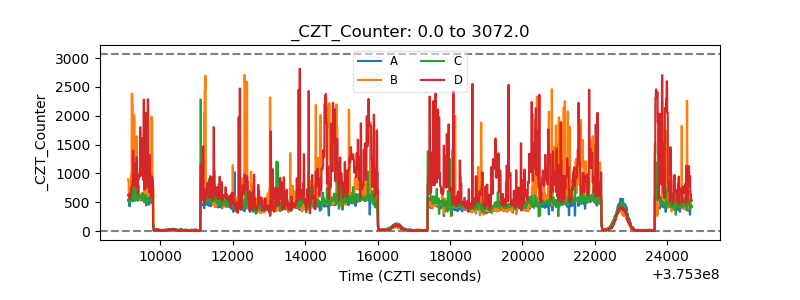 |
| +2.5 Volts monitor |  |
| +5 Volts monitor |  |
| _ROLL_ROT | 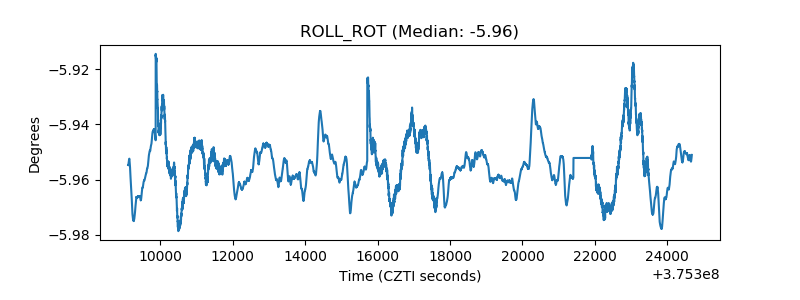 |
| _Roll_DEC | 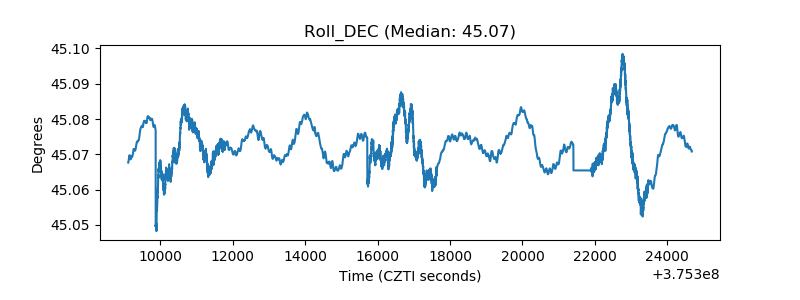 |
| _Roll_RA |  |
| Veto Counter | 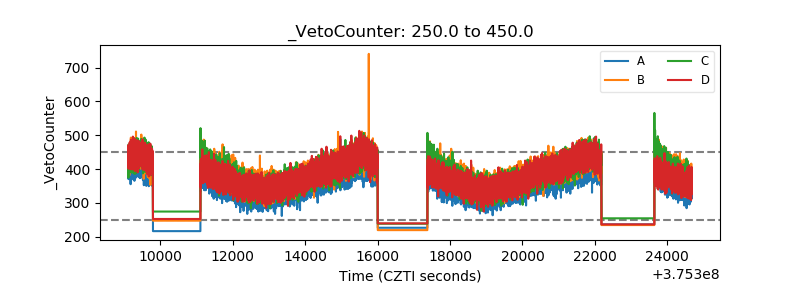 |