| Param | Original file | Final file |
|---|---|---|
| Filename | modeM0/AS1A11_047T10_9000004778_33273cztM0_level2.evt | modeM0/AS1A11_047T10_9000004778_33273cztM0_level2_quad_clean.evt |
| Size (bytes) | 144,999,360 | 23,768,640 |
| Size | 138.3 MB | 22.7 MB |
| Events in quadrant A | 704,931 | 157,094 |
| Events in quadrant B | 1,064,422 | 153,291 |
| Events in quadrant C | 826,320 | 153,389 |
| Events in quadrant D | 1,685,927 | 138,815 |
| Mode M0 | |||
|---|---|---|---|
| Quadrant | BADHDUFLAG | Total packets | Discarded packets |
| A | 0 | 3204 | 1 |
| B | 0 | 4261 | 1 |
| C | 0 | 3449 | 1 |
| D | 0 | 6150 | 1 |
| Mode SS | |||
|---|---|---|---|
| Quadrant | BADHDUFLAG | Total packets | Discarded packets |
| A | 0 | 32 | 0 |
| B | 0 | 32 | 0 |
| C | 0 | 32 | 0 |
| D | 0 | 32 | 0 |
| Mode M9 | |||
|---|---|---|---|
| Quadrant | BADHDUFLAG | Total packets | Discarded packets |
| A | 0 | 15 | 0 |
| B | 0 | 15 | 0 |
| C | 0 | 15 | 0 |
| D | 0 | 15 | 0 |
| Quadrant | Total seconds | Saturated seconds | Saturation percentage |
|---|---|---|---|
| A | 1583 | 1 | 0.063171% |
| B | 1583 | 109 | 6.885660% |
| C | 1583 | 14 | 0.884397% |
| D | 1583 | 204 | 12.886924% |
Noise dominated data is calculated using 1-second bins in cleaned event files. If a bin has >2000 counts, and if more than 50% of those come from <1% of pixels, then it is considered to be noise-dominated and hence unusable.
| Quadrant | # 1 sec bins | Bins with >0 counts | Bins with >2000 counts | High rate bins dominated by noise | Noise dominated (total time) | Noise dominated (detector-on time) | Marked lightcurve |
|---|---|---|---|---|---|---|---|
| A | 3046 | 1584 | 0 | 0 | 0.00% | 0.00% | 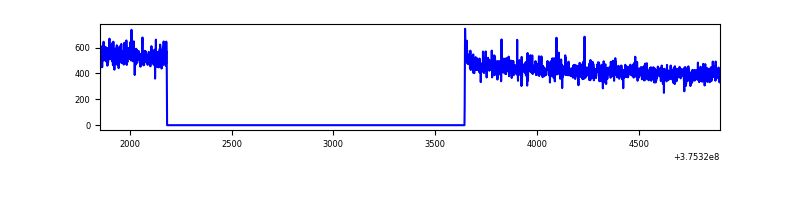 |
| B | 3046 | 1584 | 53 | 53 | 1.74% | 3.35% | 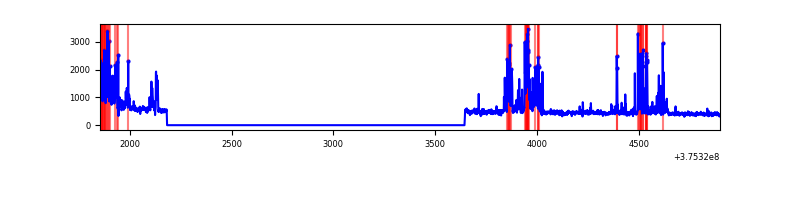 |
| C | 3046 | 1584 | 9 | 9 | 0.30% | 0.57% | 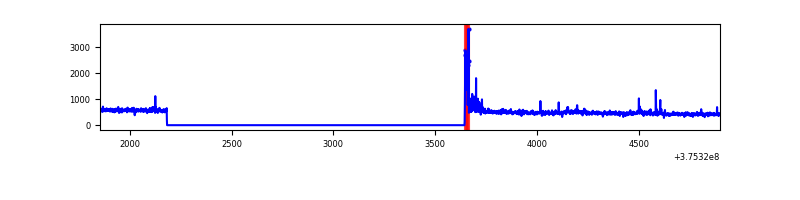 |
| D | 3046 | 1584 | 172 | 172 | 5.65% | 10.86% | 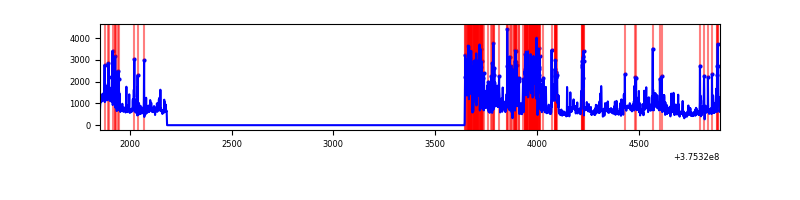 |
Top three noisy pixels from each quadrant. If the there are fewer than three noisy pixels in the level2.evt file, extra rows are filled as -1
| Pixel properties | Quadrant properties | ||||||
|---|---|---|---|---|---|---|---|
| Quadrant | DetID | PixID | Counts | Sigma | Mean | Median | Sigma |
| A | 13 | 254 | 2723 | 65.59 | 181 | 178 | 38.8 |
| A | 3 | 137 | 1773 | 41.11 | 181 | 178 | 38.8 |
| A | 13 | 6 | 1748 | 40.46 | 181 | 178 | 38.8 |
| B | 5 | 172 | 332700 | 9157.76 | 178 | 174 | 36.3 |
| B | 5 | 200 | 15326 | 417.29 | 178 | 174 | 36.3 |
| B | 4 | 170 | 8065 | 217.32 | 178 | 174 | 36.3 |
| C | 15 | 214 | 70043 | 1659.69 | 176 | 178 | 42.1 |
| C | 0 | 10 | 44532 | 1053.66 | 176 | 178 | 42.1 |
| C | 7 | 221 | 7022 | 162.58 | 176 | 178 | 42.1 |
| D | 8 | 195 | 311396 | 7272.36 | 166 | 161 | 42.8 |
| D | 12 | 6 | 303527 | 7088.49 | 166 | 161 | 42.8 |
| D | 2 | 249 | 250690 | 5853.89 | 166 | 161 | 42.8 |
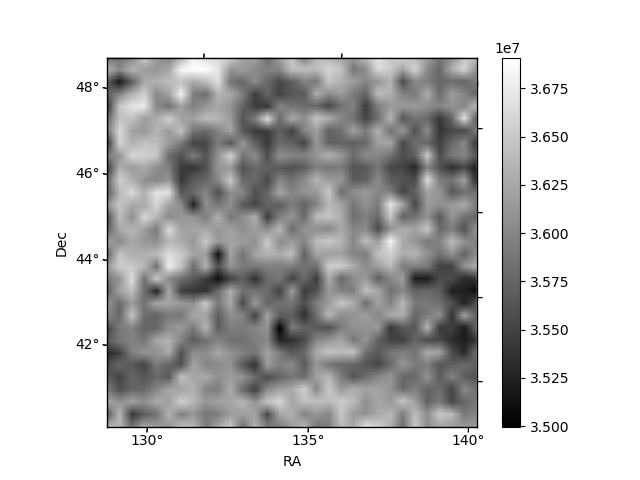
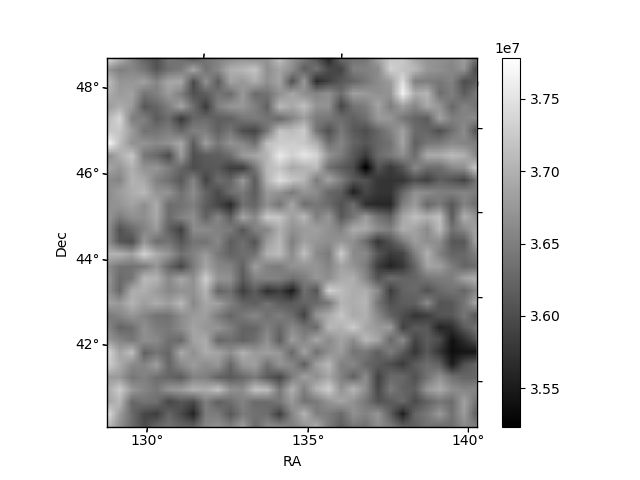
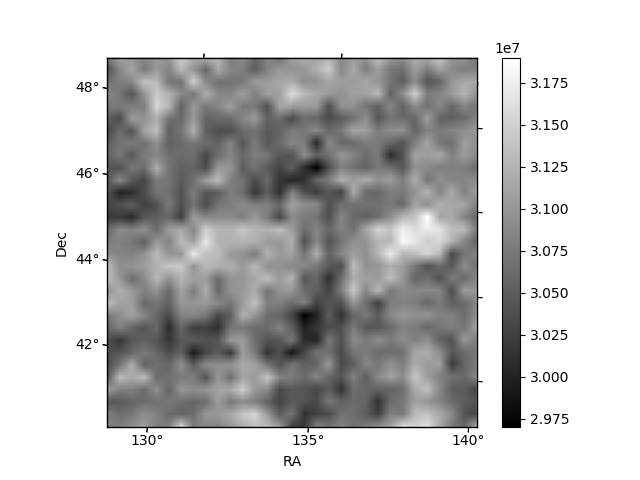
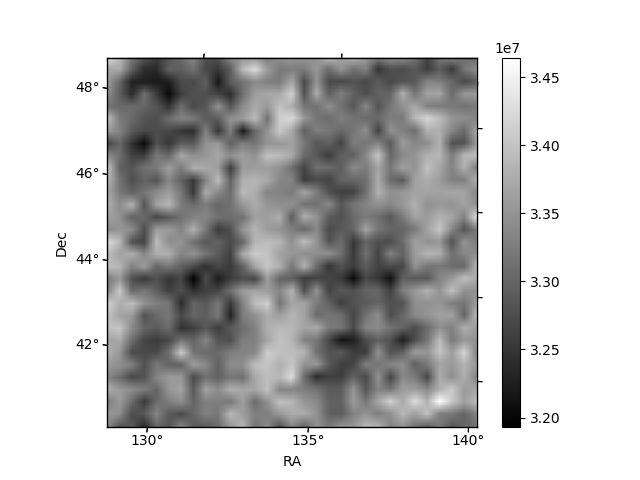
Histogram calculated using DETX and DETY for each event in the final _common_clean file
| Quadrant A | 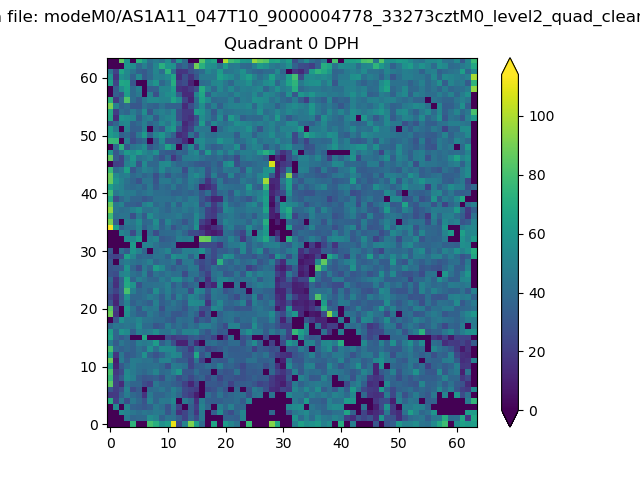 |
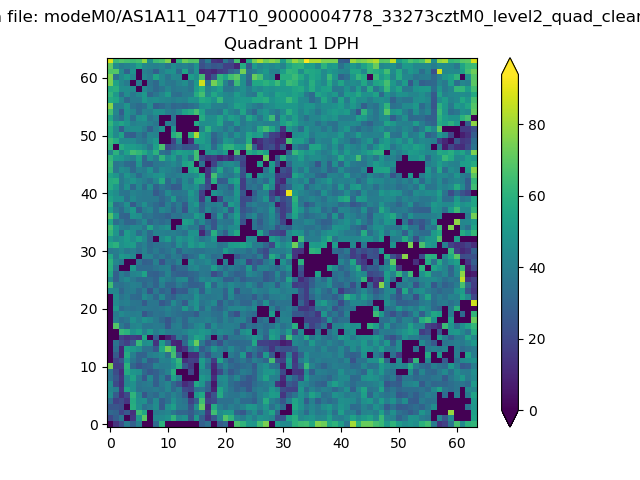 |
Quadrant B |
|---|---|---|---|
| Quadrant D | 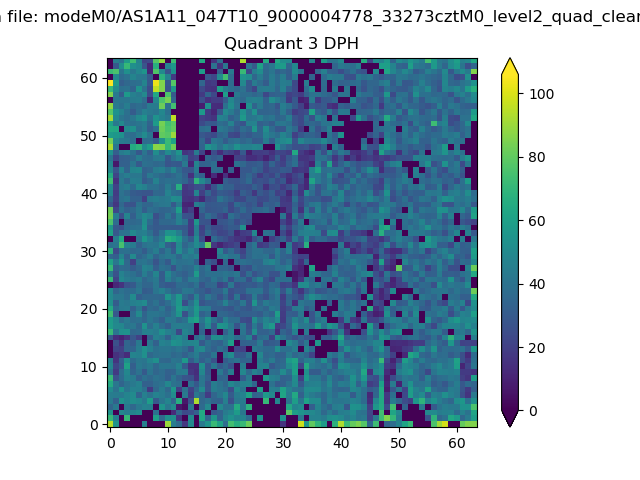 |
 |
Quadrant C |
| Plot type | Count rate plots | Images |
|---|---|---|
| Comparison with Poisson distribution Blue bars denote a histogram of data divided into 1 sec bins. Red curve is a Poisson curve with rate = median count rate of data. |
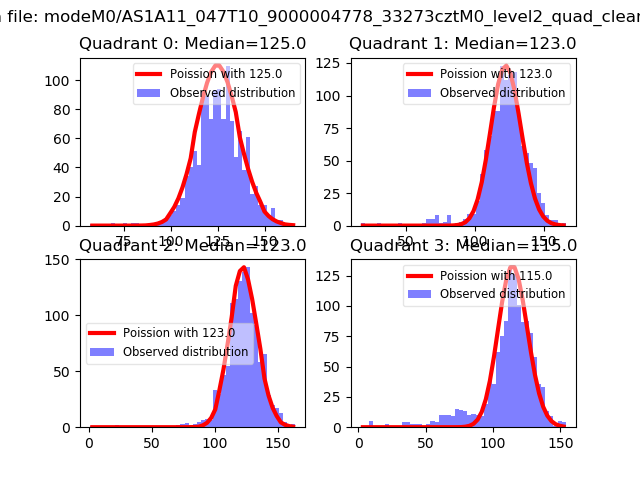 |
 |
| Quadrant-wise count rates Data is divided into 100 sec bins |
 |
|
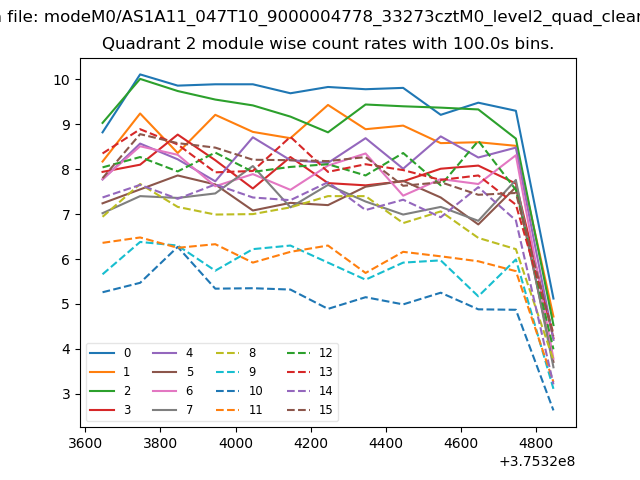
| Module-wise count rates for Quadrant A Data is divided into 100 sec bins |
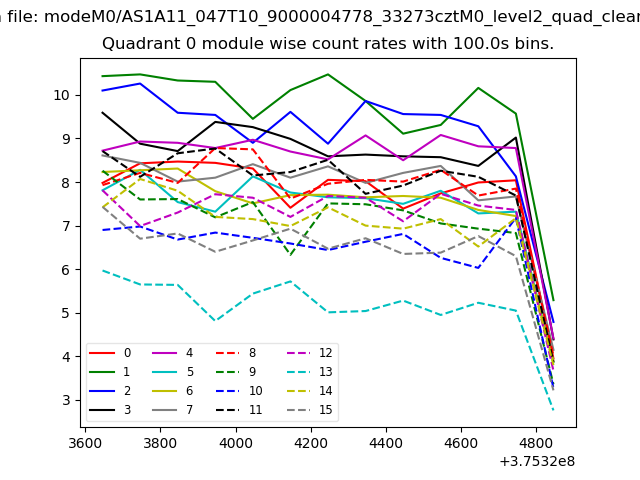 |
 |
| Module-wise count rates for Quadrant B Data is divided into 100 sec bins |
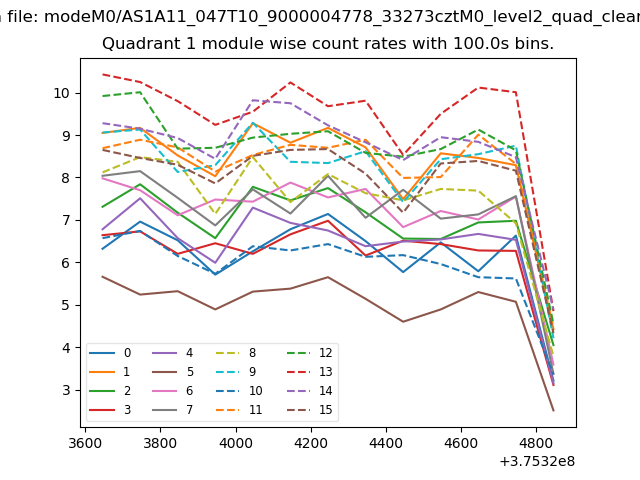 |
 |
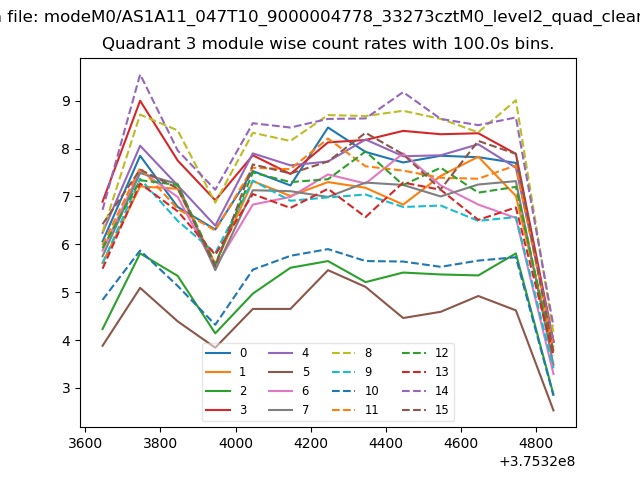
| Module-wise count rates for Quadrant C Data is divided into 100 sec bins |
 |
 |
| Module-wise count rates for Quadrant D Data is divided into 100 sec bins |
 |
 |
| Parameter | Plot |
|---|---|
| CZT HV Monitor | 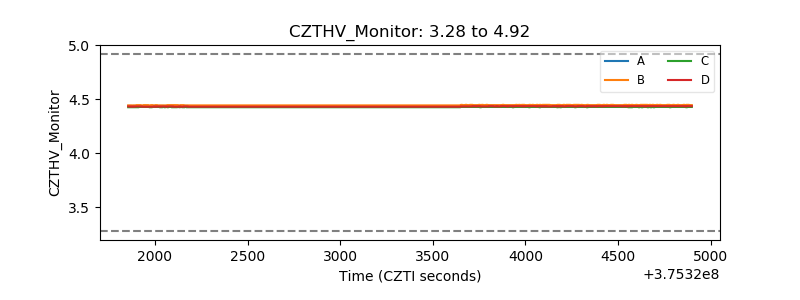 |
| D_VDD | 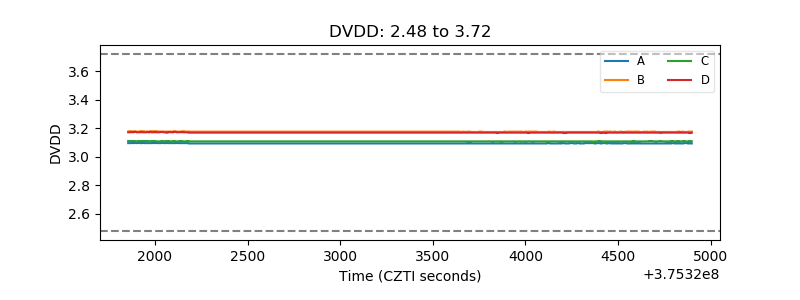 |
| Temperature 1 |  |
| Veto HV Monitor | 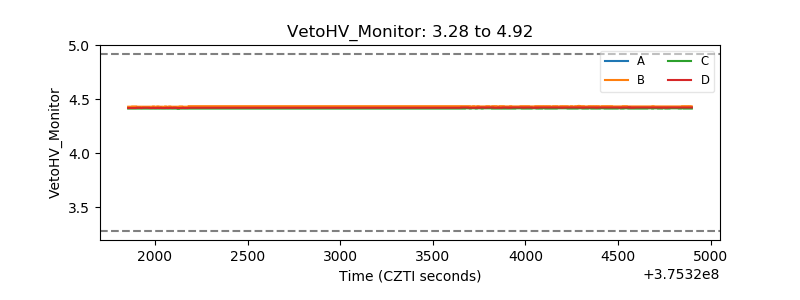 |
| Veto LLD | 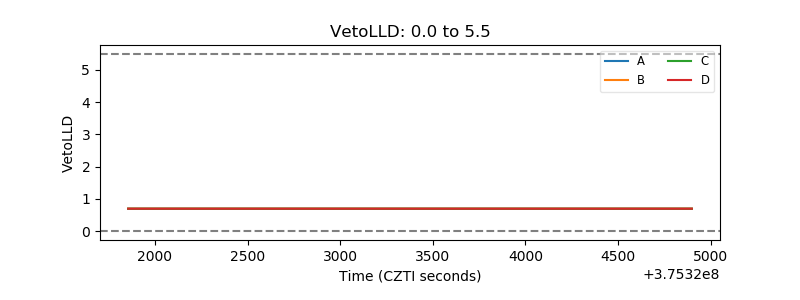 |
| Alpha Counter | 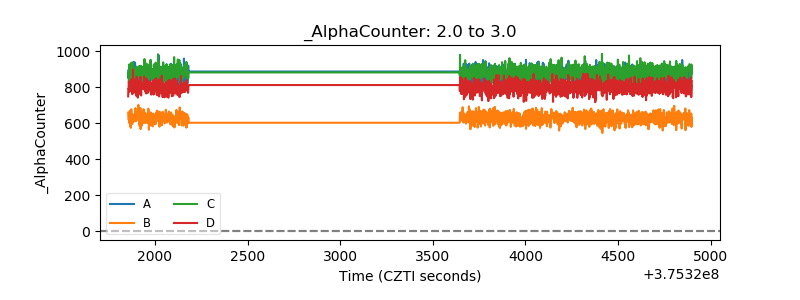 |
| _CPM_Rate | 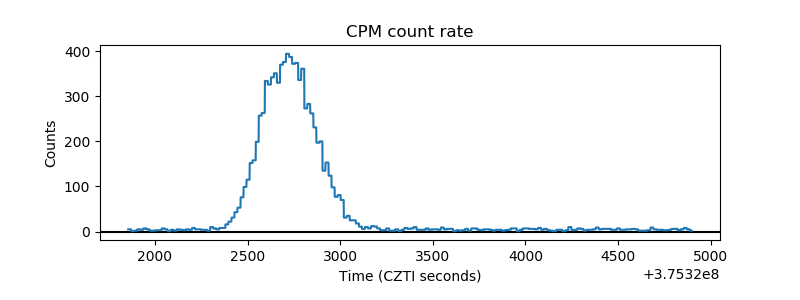 |
| CZT Counter | 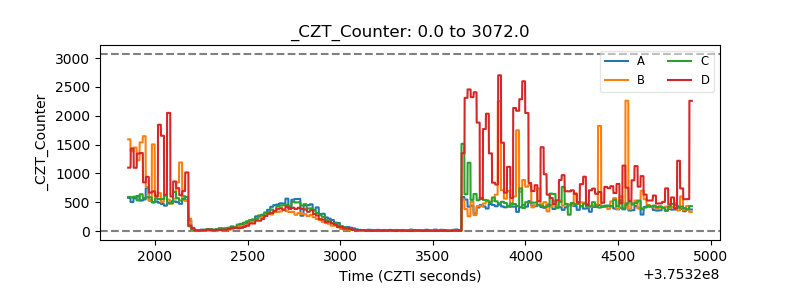 |
| +2.5 Volts monitor |  |
| +5 Volts monitor |  |
| _ROLL_ROT | 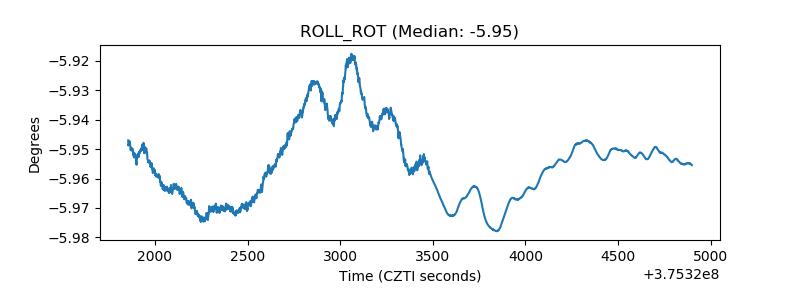 |
| _Roll_DEC | 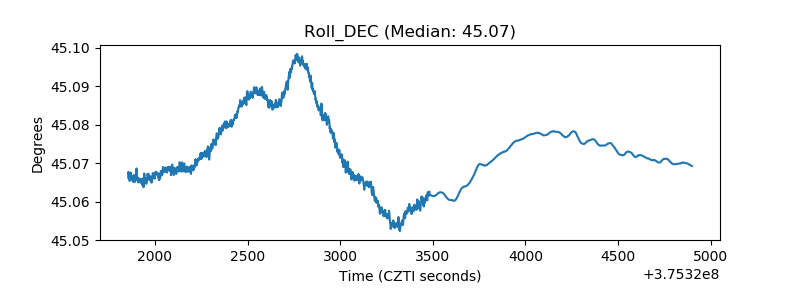 |
| _Roll_RA |  |
| Veto Counter | 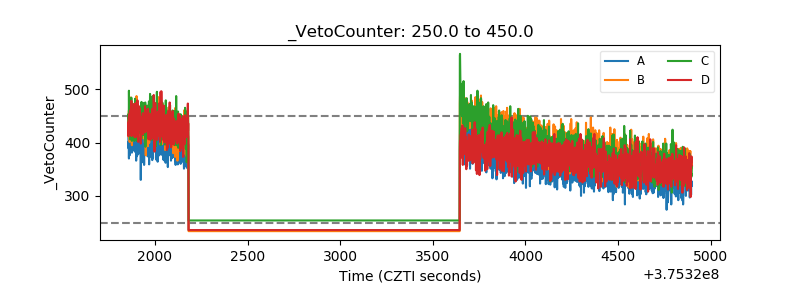 |