| Param | Original file | Final file |
|---|---|---|
| Filename | modeM0/AS1A11_047T10_9000004778_33440cztM0_level2.evt | modeM0/AS1A11_047T10_9000004778_33440cztM0_level2_quad_clean.evt |
| Size (bytes) | 98,107,200 | 15,151,680 |
| Size | 93.6 MB | 14.4 MB |
| Events in quadrant A | 497,221 | 97,472 |
| Events in quadrant B | 715,681 | 98,399 |
| Events in quadrant C | 584,946 | 97,272 |
| Events in quadrant D | 1,101,096 | 86,808 |
| Mode M0 | |||
|---|---|---|---|
| Quadrant | BADHDUFLAG | Total packets | Discarded packets |
| A | 0 | 3688 | 1546 |
| B | 0 | 4809 | 2025 |
| C | 0 | 3968 | 1630 |
| D | 0 | 11164 | 7252 |
| Mode SS | |||
|---|---|---|---|
| Quadrant | BADHDUFLAG | Total packets | Discarded packets |
| A | 0 | 38 | 24 |
| B | 0 | 38 | 20 |
| C | 0 | 38 | 22 |
| D | 0 | 41 | 25 |
| Mode M9 | |||
|---|---|---|---|
| Quadrant | BADHDUFLAG | Total packets | Discarded packets |
| A | 0 | 20 | 7 |
| B | 0 | 20 | 10 |
| C | 0 | 20 | 6 |
| D | 0 | 21 | 8 |
| Quadrant | Total seconds | Saturated seconds | Saturation percentage |
|---|---|---|---|
| A | 1068 | 1 | 0.093633% |
| B | 1055 | 53 | 5.023697% |
| C | 1069 | 14 | 1.309635% |
| D | 951 | 235 | 24.710831% |
Noise dominated data is calculated using 1-second bins in cleaned event files. If a bin has >2000 counts, and if more than 50% of those come from <1% of pixels, then it is considered to be noise-dominated and hence unusable.
| Quadrant | # 1 sec bins | Bins with >0 counts | Bins with >2000 counts | High rate bins dominated by noise | Noise dominated (total time) | Noise dominated (detector-on time) | Marked lightcurve |
|---|---|---|---|---|---|---|---|
| A | 3833 | 1149 | 0 | 0 | 0.00% | 0.00% | 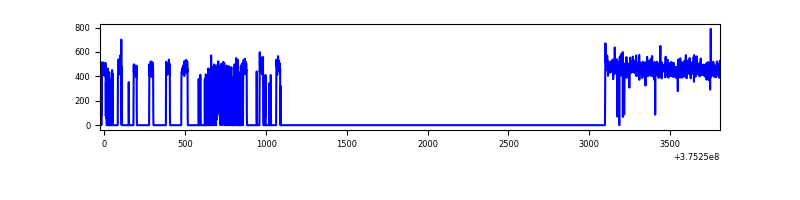 |
| B | 3830 | 1131 | 45 | 45 | 1.17% | 3.98% | 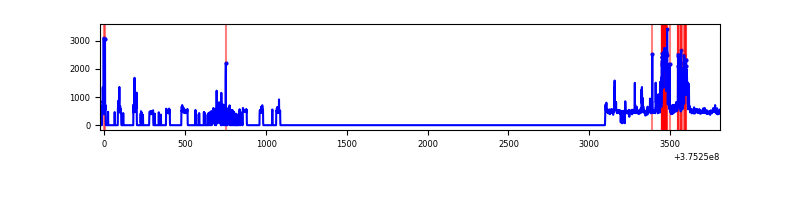 |
| C | 3837 | 1162 | 13 | 13 | 0.34% | 1.12% | 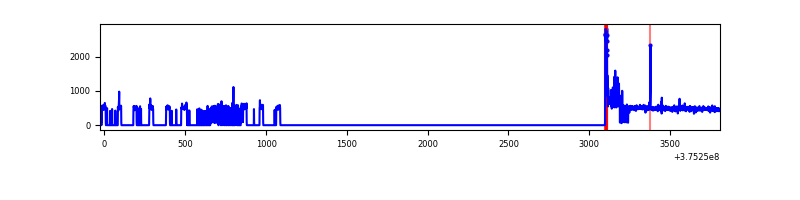 |
| D | 3825 | 962 | 239 | 239 | 6.25% | 24.84% | 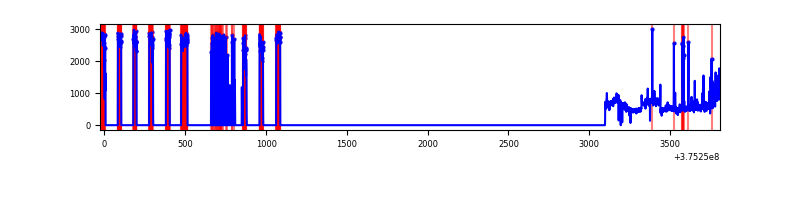 |
Top three noisy pixels from each quadrant. If the there are fewer than three noisy pixels in the level2.evt file, extra rows are filled as -1
| Pixel properties | Quadrant properties | ||||||
|---|---|---|---|---|---|---|---|
| Quadrant | DetID | PixID | Counts | Sigma | Mean | Median | Sigma |
| A | 13 | 6 | 3136 | 109.46 | 127 | 124 | 27.5 |
| A | 10 | 83 | 1967 | 66.98 | 127 | 124 | 27.5 |
| A | 13 | 254 | 1805 | 61.09 | 127 | 124 | 27.5 |
| B | 5 | 255 | 180887 | 6948.06 | 122 | 119 | 26.0 |
| B | 5 | 172 | 31051 | 1188.91 | 122 | 119 | 26.0 |
| B | 0 | 245 | 7425 | 280.82 | 122 | 119 | 26.0 |
| C | 15 | 214 | 50272 | 1708.85 | 120 | 121 | 29.3 |
| C | 0 | 10 | 49382 | 1678.53 | 120 | 121 | 29.3 |
| C | 14 | 254 | 8483 | 284.93 | 120 | 121 | 29.3 |
| D | 1 | 52 | 527350 | 21274.76 | 92 | 89 | 24.8 |
| D | 8 | 195 | 115355 | 4650.93 | 92 | 89 | 24.8 |
| D | 12 | 6 | 28576 | 1149.44 | 92 | 89 | 24.8 |
Histogram calculated using DETX and DETY for each event in the final _common_clean file
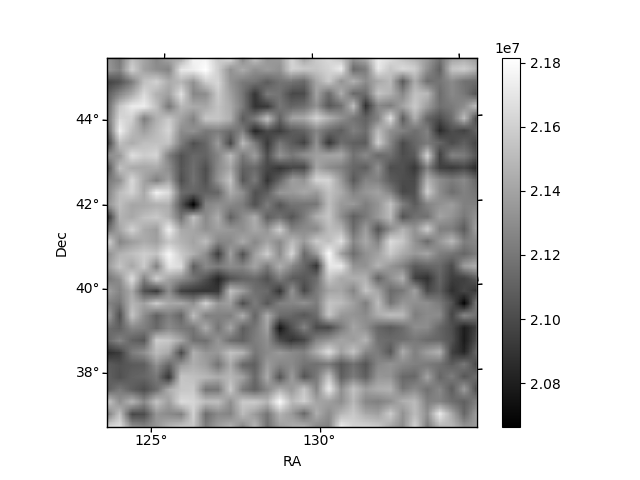
| Quadrant A | 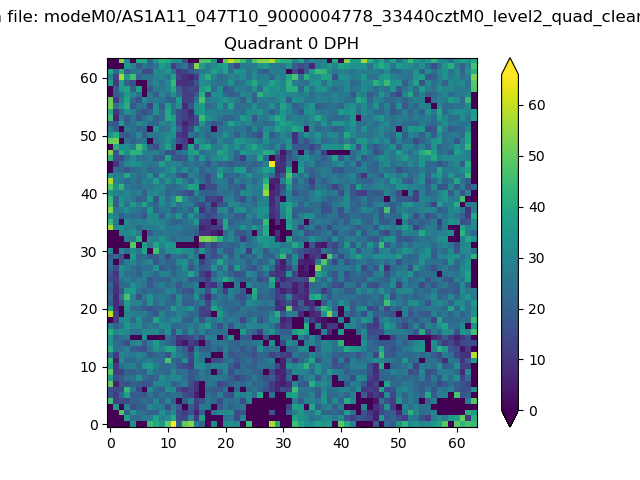 |
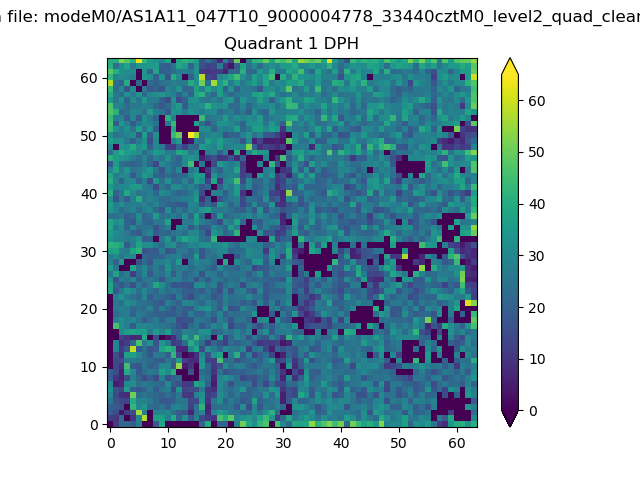 |
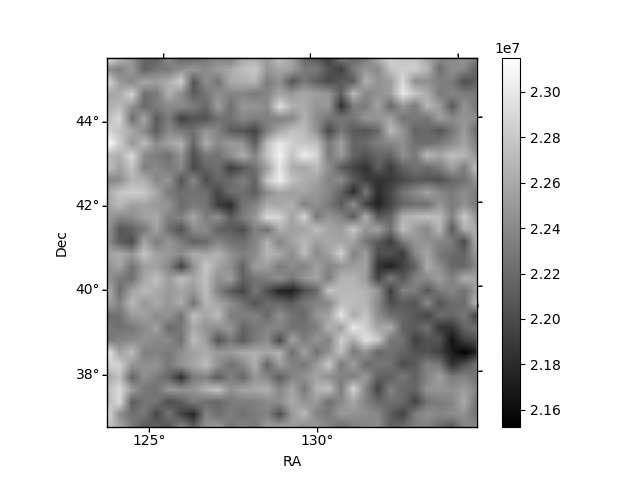
Quadrant B |
|---|---|---|---|
| Quadrant D |  |
 |
Quadrant C |
| Plot type | Count rate plots | Images |
|---|---|---|
| Comparison with Poisson distribution Blue bars denote a histogram of data divided into 1 sec bins. Red curve is a Poisson curve with rate = median count rate of data. |
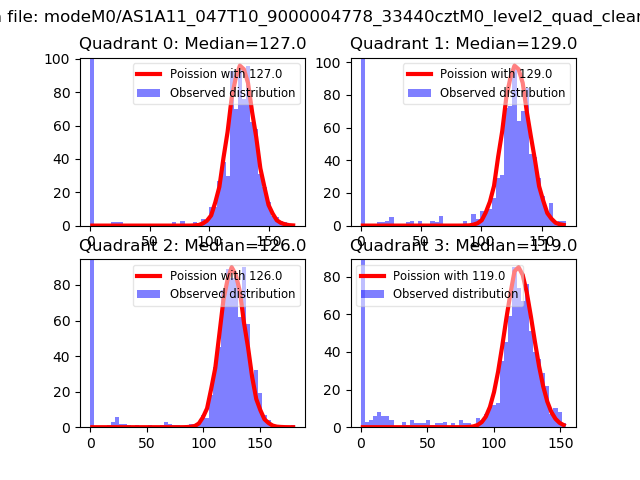 |
 |
| Quadrant-wise count rates Data is divided into 100 sec bins |
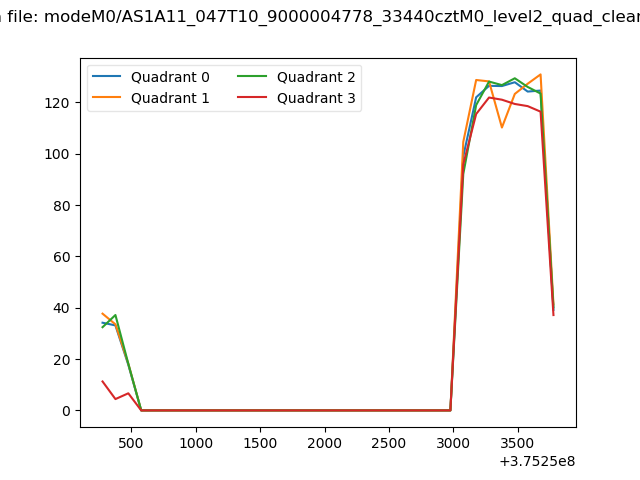 |
|
| Module-wise count rates for Quadrant A Data is divided into 100 sec bins |
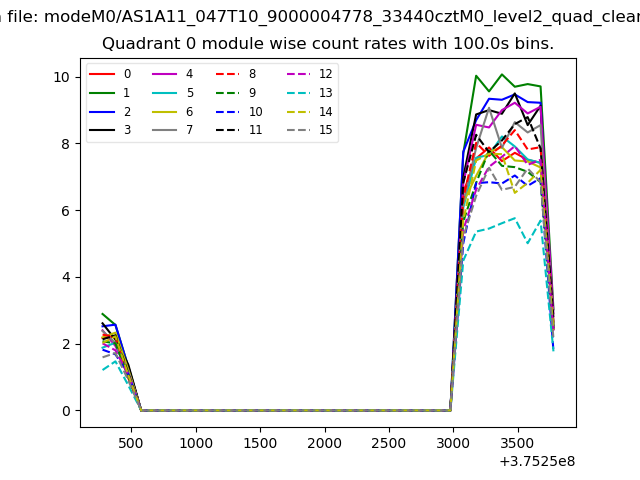 |
 |
| Module-wise count rates for Quadrant B Data is divided into 100 sec bins |
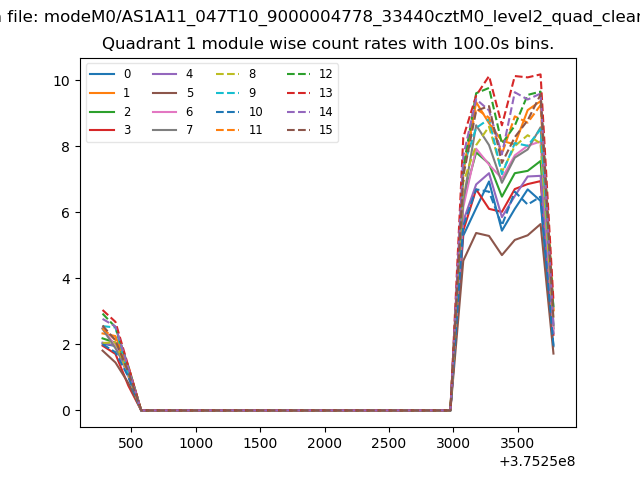 |
 |
| Module-wise count rates for Quadrant C Data is divided into 100 sec bins |
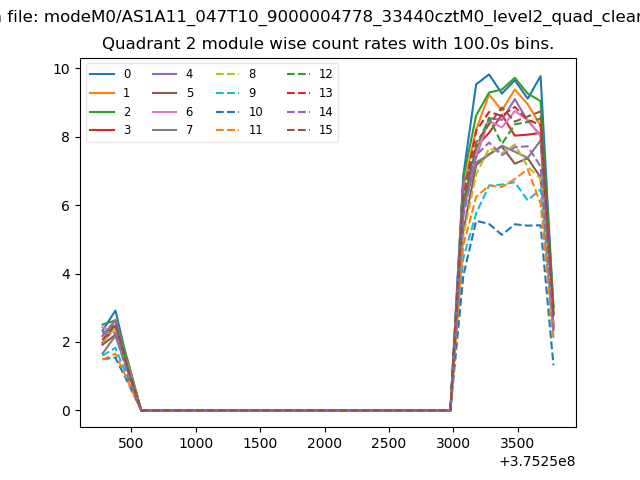 |
 |
| Module-wise count rates for Quadrant D Data is divided into 100 sec bins |
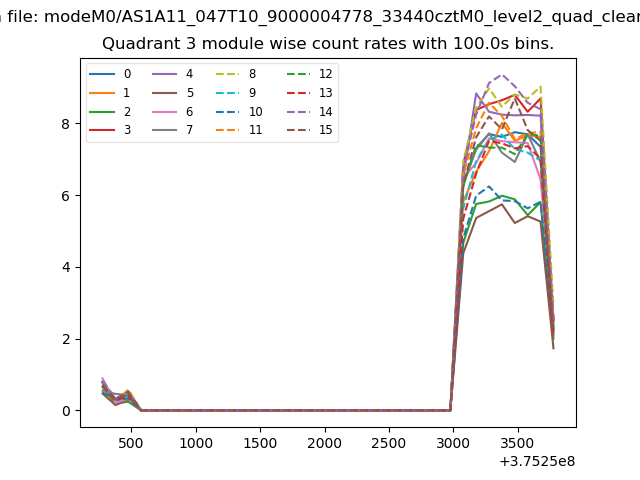 |
 |
| Parameter | Plot |
|---|---|
| CZT HV Monitor | 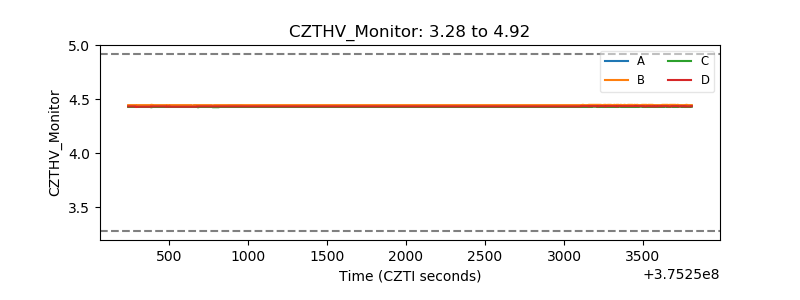 |
| D_VDD | 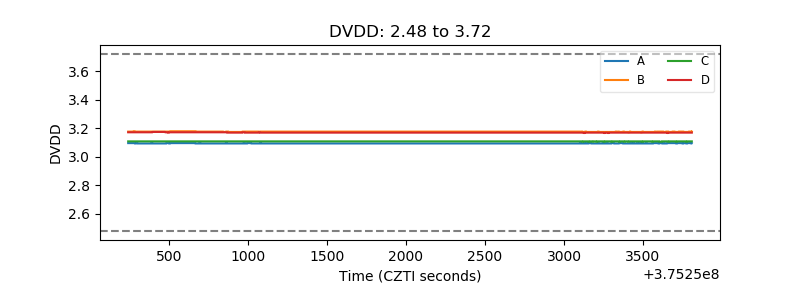 |
| Temperature 1 | 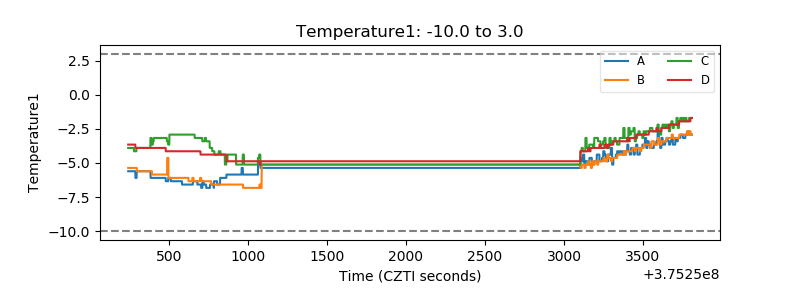 |
| Veto HV Monitor | 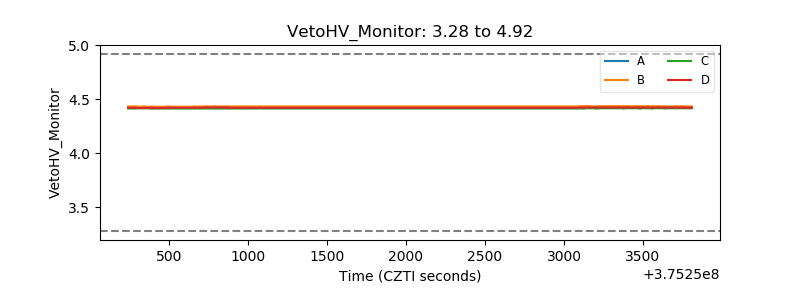 |
| Veto LLD | 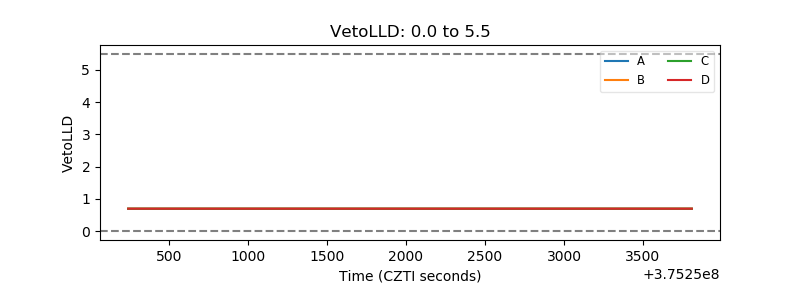 |
| Alpha Counter | 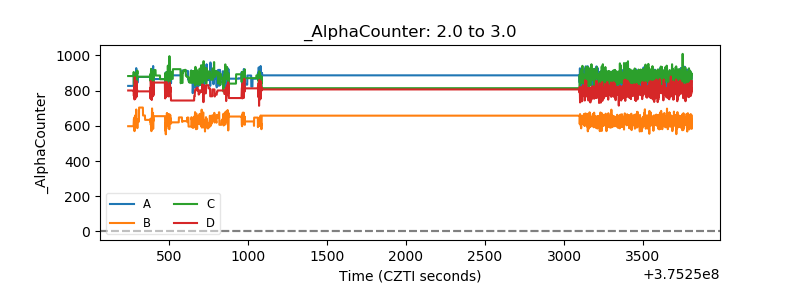 |
| _CPM_Rate | 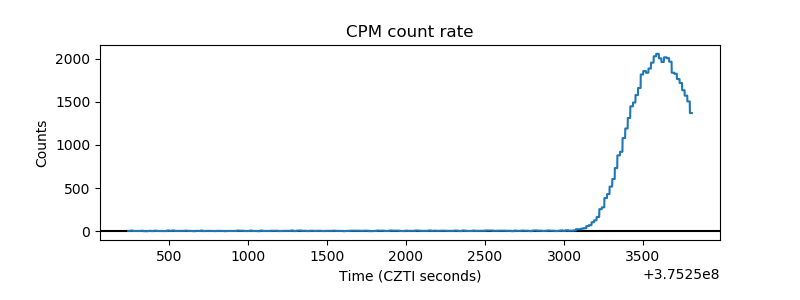 |
| CZT Counter |  |
| +2.5 Volts monitor |  |
| +5 Volts monitor | 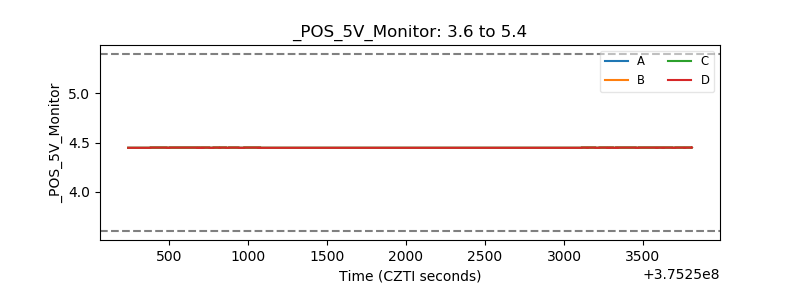 |
| _ROLL_ROT | 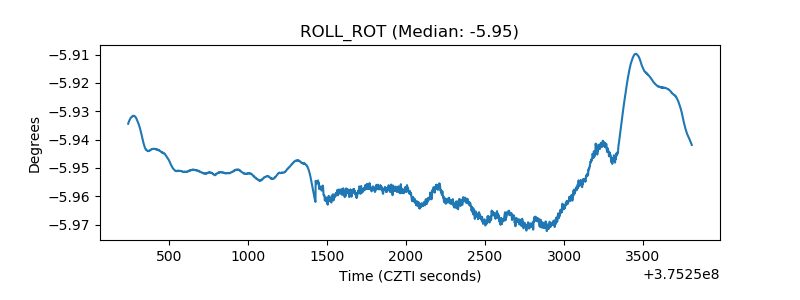 |
| _Roll_DEC | 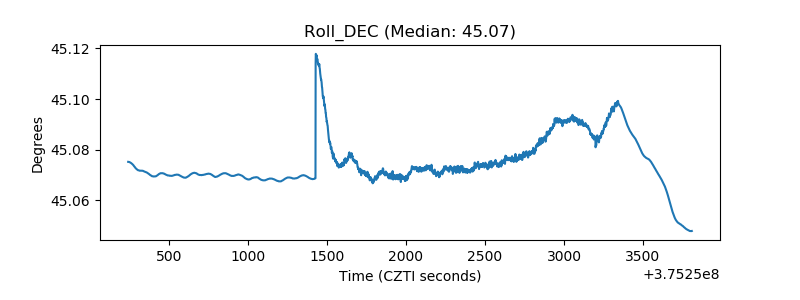 |
| _Roll_RA |  |
| Veto Counter | 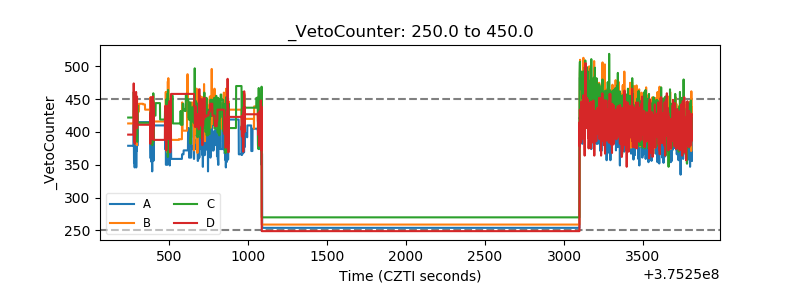 |