| Param | Original file | Final file |
|---|---|---|
| Filename | modeM0/AS1T04_072T01_9000004780cztM0_level2.fits | modeM0/AS1T04_072T01_9000004780cztM0_level2_quad_clean.evt |
| Size (bytes) | 349,951,680 | 324,204,480 |
| Size | 333.7 MB | 309.2 MB |
| Events in quadrant A | 2,178,470 | 1,960,149 |
| Events in quadrant B | 2,000,814 | 1,828,434 |
| Events in quadrant C | 2,076,798 | 1,836,861 |
| Events in quadrant D | 1,754,110 | 1,605,522 |
| Mode SS | |||
|---|---|---|---|
| Quadrant | BADHDUFLAG | Total packets | Discarded packets |
| A | 0 | 768 | 0 |
| B | 0 | 768 | 0 |
| C | 0 | 768 | 0 |
| D | 0 | 768 | 0 |
| Mode M0 | |||
|---|---|---|---|
| Quadrant | BADHDUFLAG | Total packets | Discarded packets |
| A | 0 | 77085 | 0 |
| B | 0 | 100027 | 0 |
| C | 0 | 86057 | 0 |
| D | 0 | 130188 | 0 |
| Mode M9 | |||
|---|---|---|---|
| Quadrant | BADHDUFLAG | Total packets | Discarded packets |
| A | 0 | 122 | 0 |
| B | 0 | 122 | 0 |
| C | 0 | 122 | 0 |
| D | 0 | 123 | 0 |
| Quadrant | Total seconds | Saturated seconds | Saturation percentage |
|---|---|---|---|
| A | 37669 | 64 | 0.169901% |
| B | 37669 | 2183 | 5.795216% |
| C | 37669 | 455 | 1.207890% |
| D | 37669 | 2094 | 5.558948% |
Noise dominated data is calculated using 1-second bins in cleaned event files. If a bin has >2000 counts, and if more than 50% of those come from <1% of pixels, then it is considered to be noise-dominated and hence unusable.
| Quadrant | # 1 sec bins | Bins with >0 counts | Bins with >2000 counts | High rate bins dominated by noise | Noise dominated (total time) | Noise dominated (detector-on time) | Marked lightcurve |
|---|---|---|---|---|---|---|---|
| A | 47291 | 36746 | 0 | 0 | 0.00% | 0.00% |  |
| B | 47291 | 36726 | 0 | 0 | 0.00% | 0.00% |  |
| C | 47291 | 36742 | 0 | 0 | 0.00% | 0.00% |  |
| D | 47291 | 36693 | 0 | 0 | 0.00% | 0.00% |  |
Top three noisy pixels from each quadrant. If the there are fewer than three noisy pixels in the level2.evt file, extra rows are filled as -1
| Pixel properties | Quadrant properties | ||||||
|---|---|---|---|---|---|---|---|
| Quadrant | DetID | PixID | Counts | Sigma | Mean | Median | Sigma |
| A | 9 | 19 | 1793 | 8.8 | 568 | 531 | 143.4 |
| A | 0 | 29 | 1751 | 8.5 | 568 | 531 | 143.4 |
| A | 7 | 110 | 1749 | 8.49 | 568 | 531 | 143.4 |
| B | 2 | 9 | 1820 | 12.21 | 532 | 506 | 107.6 |
| B | 3 | 80 | 1540 | 9.61 | 532 | 506 | 107.6 |
| B | 2 | 8 | 1455 | 8.82 | 532 | 506 | 107.6 |
| C | 3 | 187 | 1469 | 6.83 | 551 | 517 | 139.4 |
| C | 3 | 158 | 1381 | 6.2 | 551 | 517 | 139.4 |
| C | 7 | 233 | 1368 | 6.1 | 551 | 517 | 139.4 |
| D | 3 | 14 | 1315 | 6.4 | 502 | 458 | 134.0 |
| D | 6 | 38 | 1259 | 5.98 | 502 | 458 | 134.0 |
| D | 6 | 231 | 1259 | 5.98 | 502 | 458 | 134.0 |
Histogram calculated using DETX and DETY for each event in the final _common_clean file
| Quadrant A | 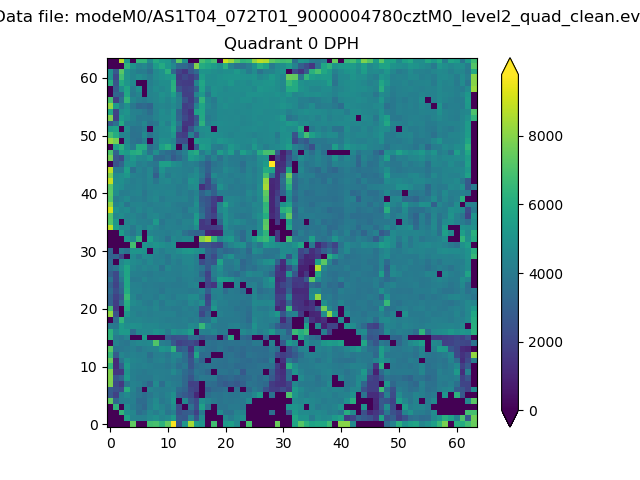 |
 |
Quadrant B |
|---|---|---|---|
| Quadrant D | 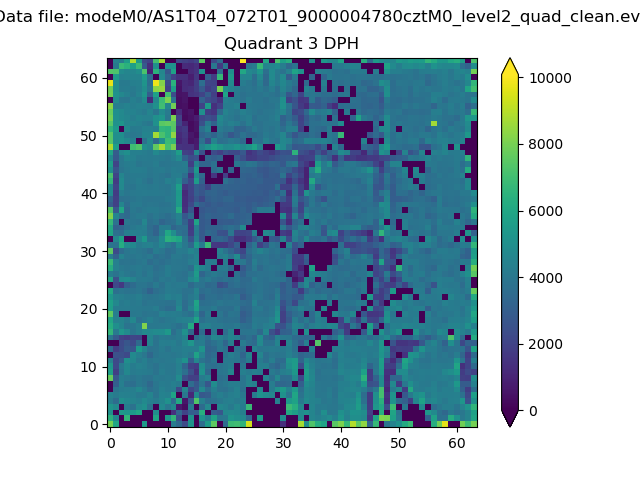 |
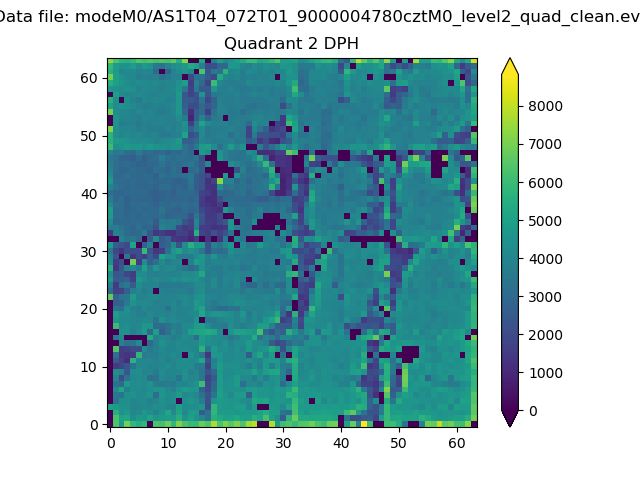 |
Quadrant C |
| Plot type | Count rate plots | Images |
|---|---|---|
| Comparison with Poisson distribution Blue bars denote a histogram of data divided into 1 sec bins. Red curve is a Poisson curve with rate = median count rate of data. |
 |
 |
| Quadrant-wise count rates Data is divided into 100 sec bins |
 |
|
| Module-wise count rates for Quadrant A Data is divided into 100 sec bins |
 |
 |
| Module-wise count rates for Quadrant B Data is divided into 100 sec bins |
 |
 |
| Module-wise count rates for Quadrant C Data is divided into 100 sec bins |
 |
 |
| Module-wise count rates for Quadrant D Data is divided into 100 sec bins |
 |
 |
| Parameter | Plot |
|---|---|
| CZT HV Monitor |  |
| D_VDD |  |
| Temperature 1 |  |
| Veto HV Monitor |  |
| Veto LLD |  |
| Alpha Counter |  |
| _CPM_Rate |  |
| CZT Counter |  |
| +2.5 Volts monitor |  |
| +5 Volts monitor |  |
| _ROLL_ROT |  |
| _Roll_DEC |  |
| _Roll_RA |  |
| Veto Counter |  |