| Param | Original file | Final file |
|---|---|---|
| Filename | modeM0/AS1T04_072T01_9000004780_33273cztM0_level2.evt | modeM0/AS1T04_072T01_9000004780_33273cztM0_level2_quad_clean.evt |
| Size (bytes) | 313,804,800 | 43,692,480 |
| Size | 299.3 MB | 41.7 MB |
| Events in quadrant A | 1,547,023 | 287,572 |
| Events in quadrant B | 2,450,895 | 272,354 |
| Events in quadrant C | 1,798,331 | 280,734 |
| Events in quadrant D | 3,487,503 | 252,687 |
| Mode SS | |||
|---|---|---|---|
| Quadrant | BADHDUFLAG | Total packets | Discarded packets |
| A | 0 | 68 | 0 |
| B | 0 | 68 | 0 |
| C | 0 | 68 | 0 |
| D | 0 | 68 | 0 |
| Mode M0 | |||
|---|---|---|---|
| Quadrant | BADHDUFLAG | Total packets | Discarded packets |
| A | 0 | 6523 | 2 |
| B | 0 | 9378 | 1 |
| C | 0 | 7150 | 1 |
| D | 0 | 12677 | 1 |
| Mode M9 | |||
|---|---|---|---|
| Quadrant | BADHDUFLAG | Total packets | Discarded packets |
| A | 0 | 15 | 0 |
| B | 0 | 15 | 0 |
| C | 0 | 15 | 0 |
| D | 0 | 15 | 0 |
| Quadrant | Total seconds | Saturated seconds | Saturation percentage |
|---|---|---|---|
| A | 3218 | 2 | 0.062150% |
| B | 3218 | 267 | 8.297079% |
| C | 3218 | 23 | 0.714730% |
| D | 3218 | 410 | 12.740833% |
Noise dominated data is calculated using 1-second bins in cleaned event files. If a bin has >2000 counts, and if more than 50% of those come from <1% of pixels, then it is considered to be noise-dominated and hence unusable.
| Quadrant | # 1 sec bins | Bins with >0 counts | Bins with >2000 counts | High rate bins dominated by noise | Noise dominated (total time) | Noise dominated (detector-on time) | Marked lightcurve |
|---|---|---|---|---|---|---|---|
| A | 4801 | 3219 | 0 | 0 | 0.00% | 0.00% | 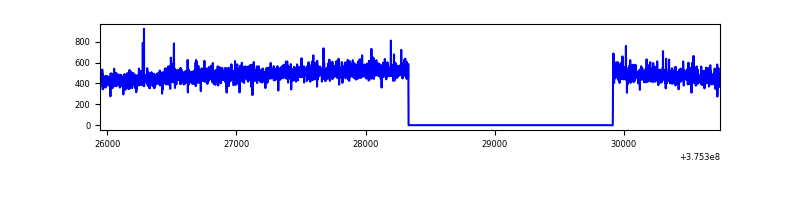 |
| B | 4801 | 3219 | 196 | 196 | 4.08% | 6.09% | 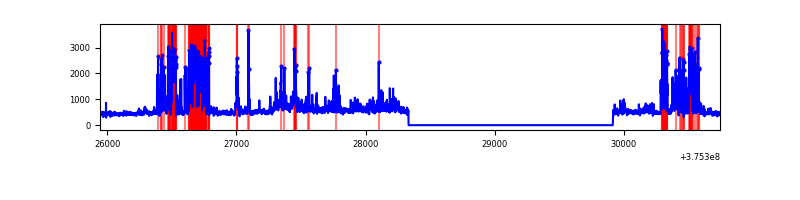 |
| C | 4801 | 3219 | 16 | 16 | 0.33% | 0.50% | 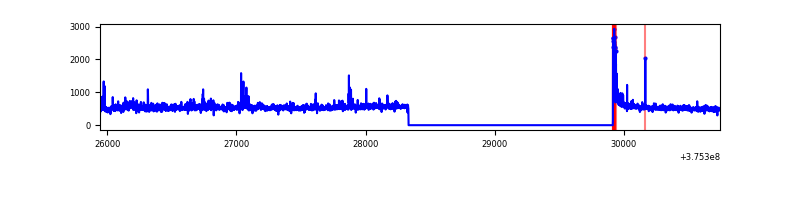 |
| D | 4801 | 3219 | 303 | 303 | 6.31% | 9.41% | 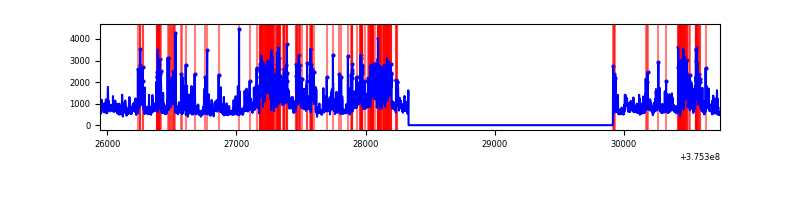 |
Top three noisy pixels from each quadrant. If the there are fewer than three noisy pixels in the level2.evt file, extra rows are filled as -1
| Pixel properties | Quadrant properties | ||||||
|---|---|---|---|---|---|---|---|
| Quadrant | DetID | PixID | Counts | Sigma | Mean | Median | Sigma |
| A | 13 | 6 | 7005 | 82.26 | 395 | 387 | 80.5 |
| A | 15 | 169 | 5535 | 63.99 | 395 | 387 | 80.5 |
| A | 13 | 254 | 5415 | 62.5 | 395 | 387 | 80.5 |
| B | 5 | 172 | 732655 | 9949.02 | 376 | 367 | 73.6 |
| B | 4 | 170 | 116824 | 1582.21 | 376 | 367 | 73.6 |
| B | 0 | 219 | 24595 | 329.17 | 376 | 367 | 73.6 |
| C | 15 | 214 | 137478 | 1541.89 | 378 | 381 | 88.9 |
| C | 10 | 49 | 72903 | 815.63 | 378 | 381 | 88.9 |
| C | 0 | 10 | 55268 | 617.3 | 378 | 381 | 88.9 |
| D | 8 | 195 | 738536 | 7414.31 | 363 | 355 | 99.6 |
| D | 7 | 223 | 338579 | 3397.13 | 363 | 355 | 99.6 |
| D | 2 | 249 | 284373 | 2852.69 | 363 | 355 | 99.6 |
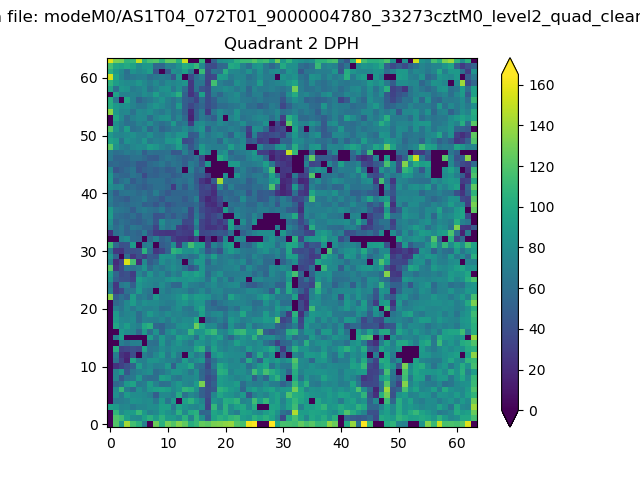
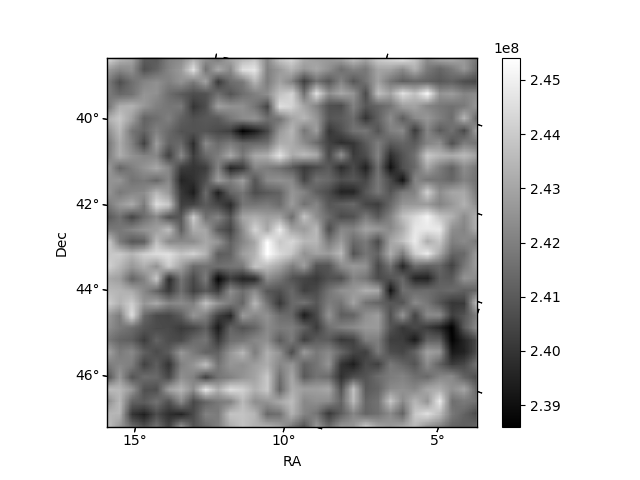
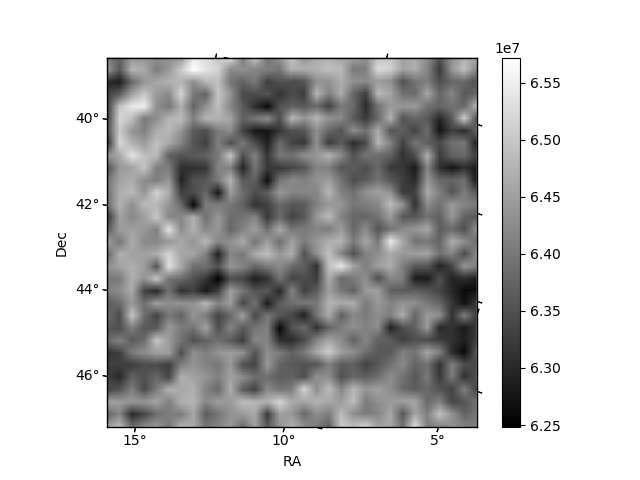
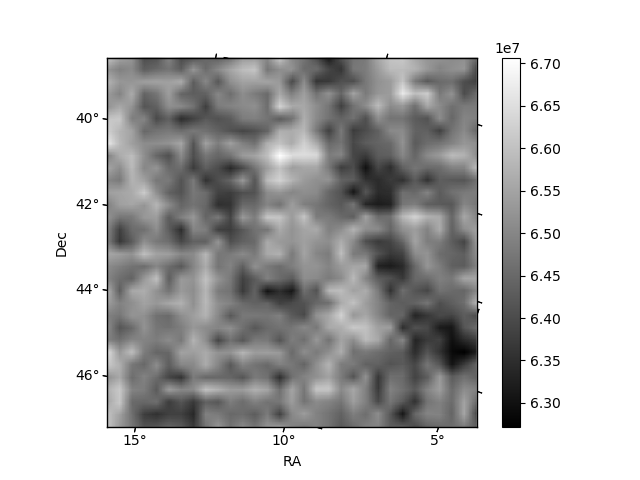
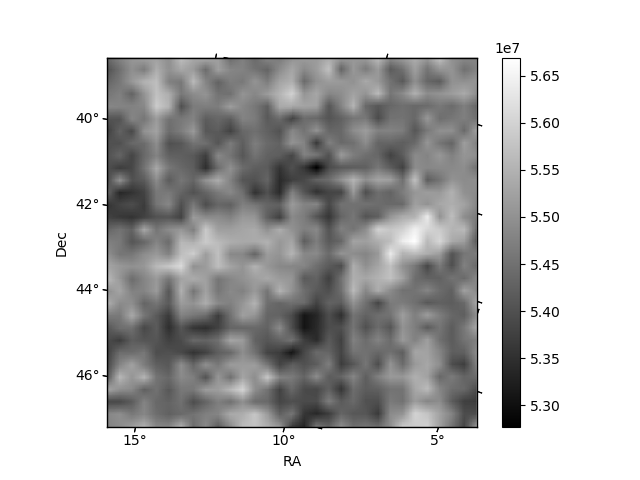
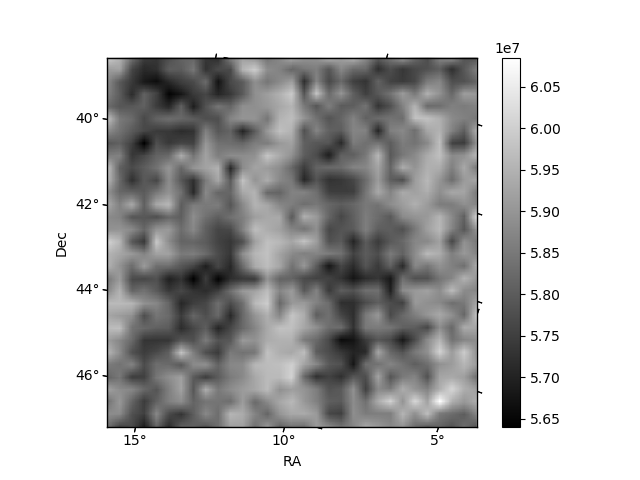
Histogram calculated using DETX and DETY for each event in the final _common_clean file
| Quadrant A | 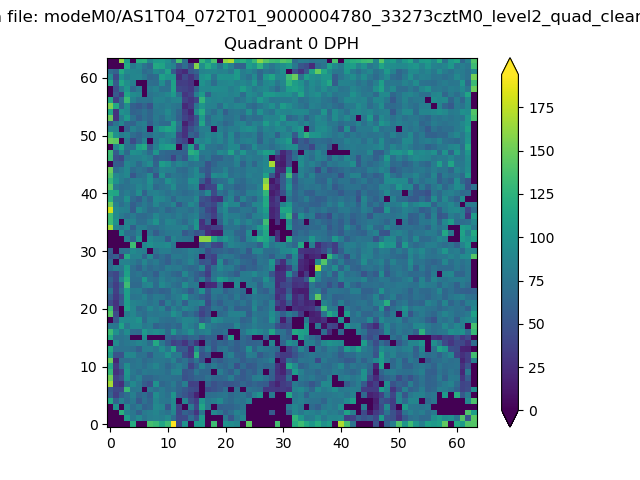 |
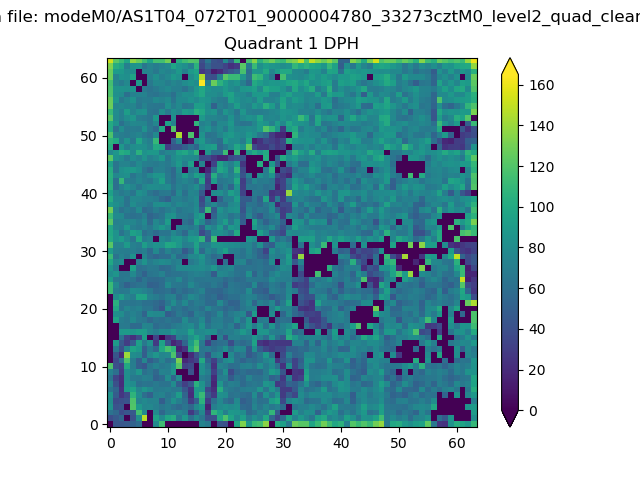 |
Quadrant B |
|---|---|---|---|
| Quadrant D | 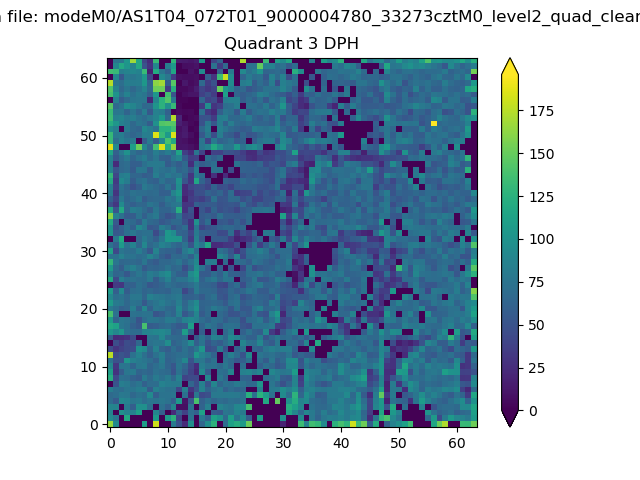 |
 |
Quadrant C |
| Plot type | Count rate plots | Images |
|---|---|---|
| Comparison with Poisson distribution Blue bars denote a histogram of data divided into 1 sec bins. Red curve is a Poisson curve with rate = median count rate of data. |
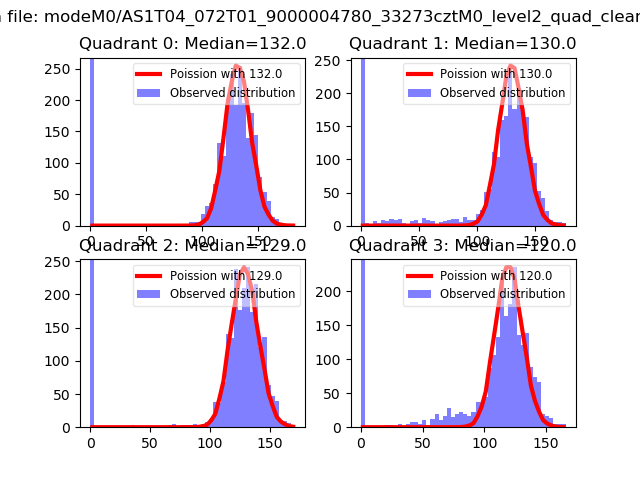 |
 |
| Quadrant-wise count rates Data is divided into 100 sec bins |
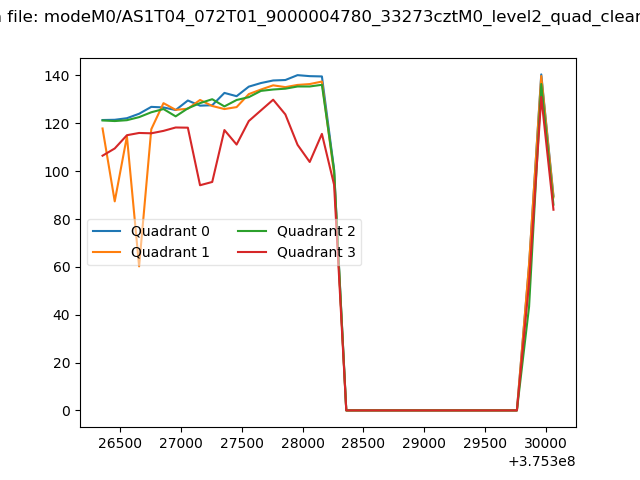 |
|
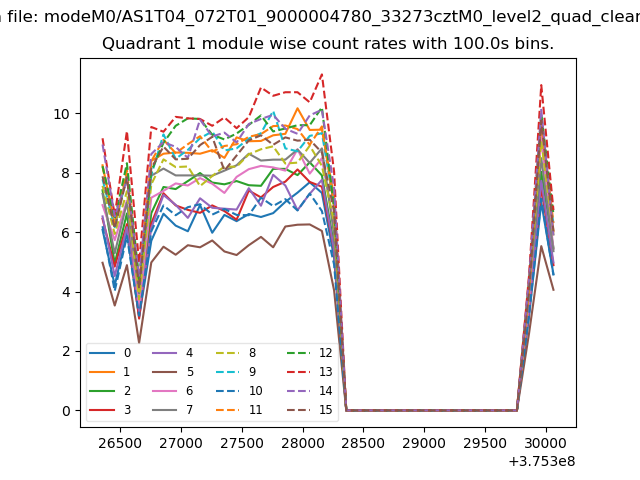
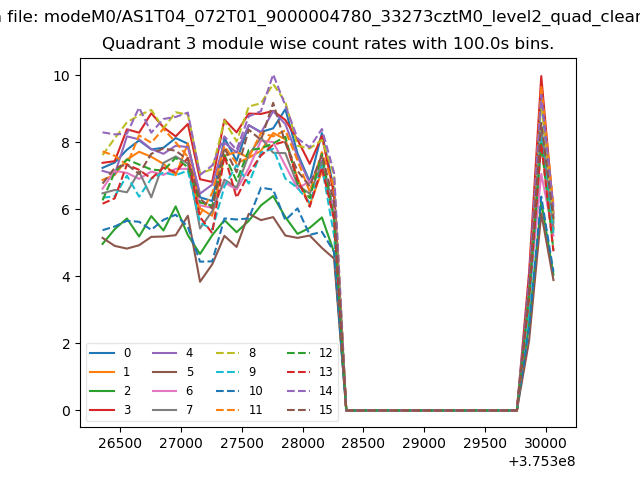
| Module-wise count rates for Quadrant A Data is divided into 100 sec bins |
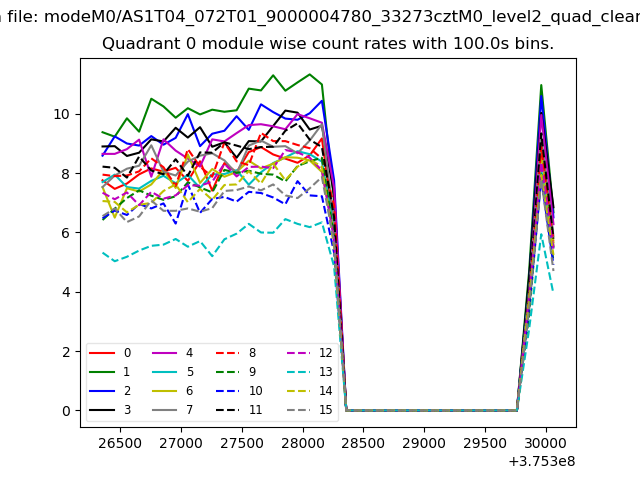 |
 |
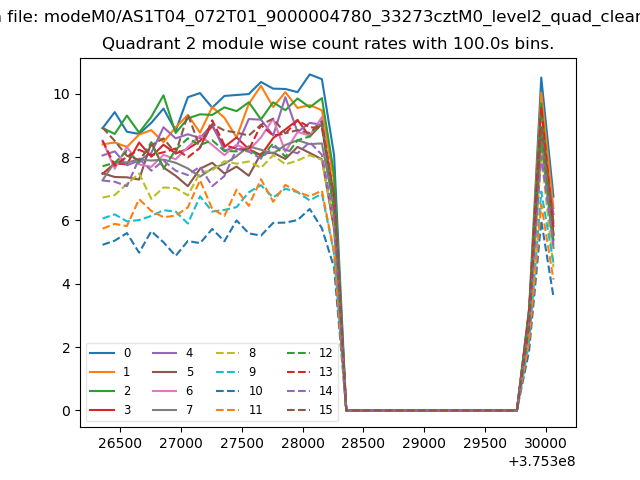
| Module-wise count rates for Quadrant B Data is divided into 100 sec bins |
 |
 |
| Module-wise count rates for Quadrant C Data is divided into 100 sec bins |
 |
 |
| Module-wise count rates for Quadrant D Data is divided into 100 sec bins |
 |
 |
| Parameter | Plot |
|---|---|
| CZT HV Monitor | 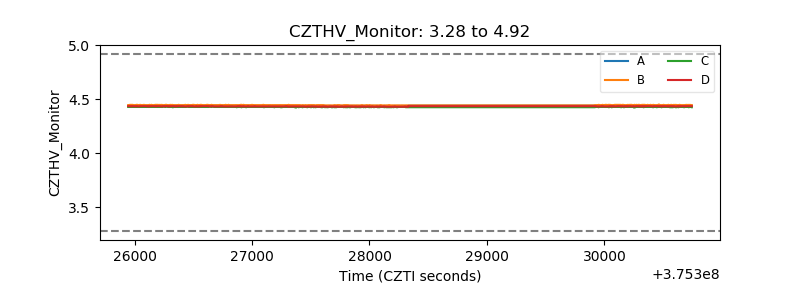 |
| D_VDD | 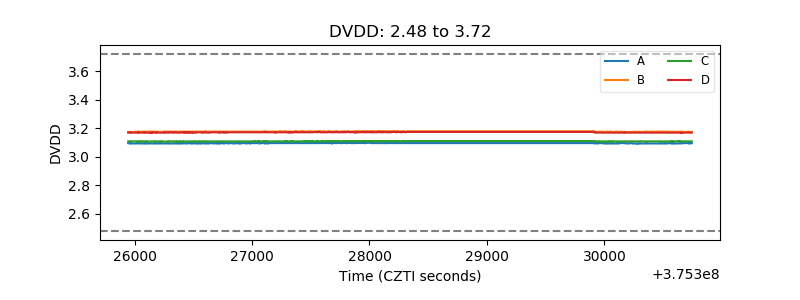 |
| Temperature 1 | 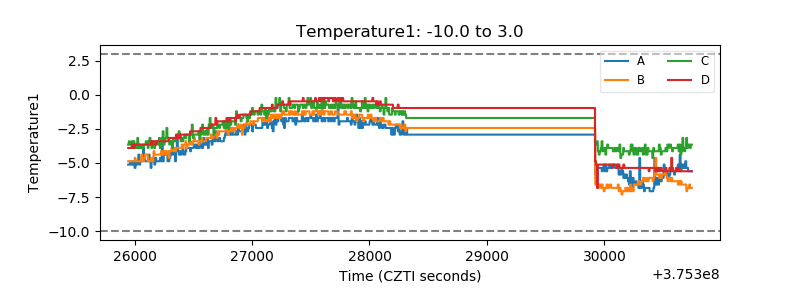 |
| Veto HV Monitor | 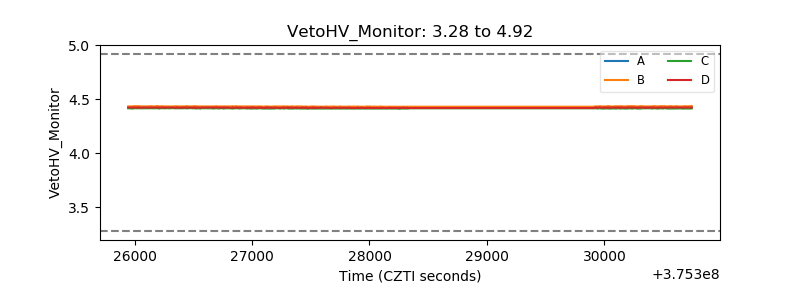 |
| Veto LLD | 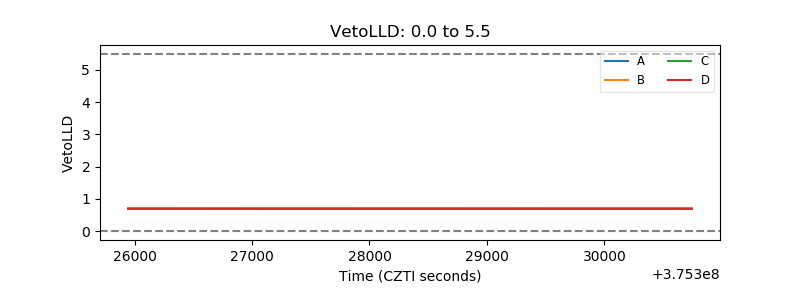 |
| Alpha Counter | 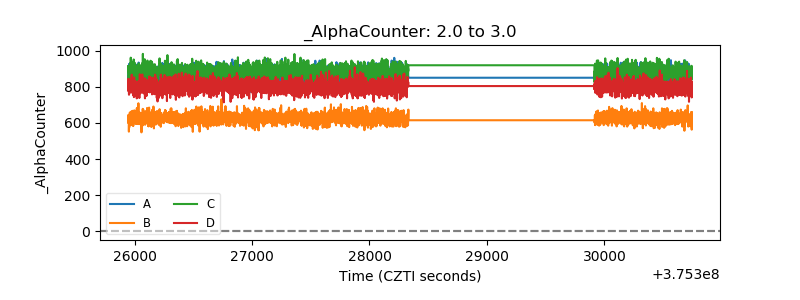 |
| _CPM_Rate | 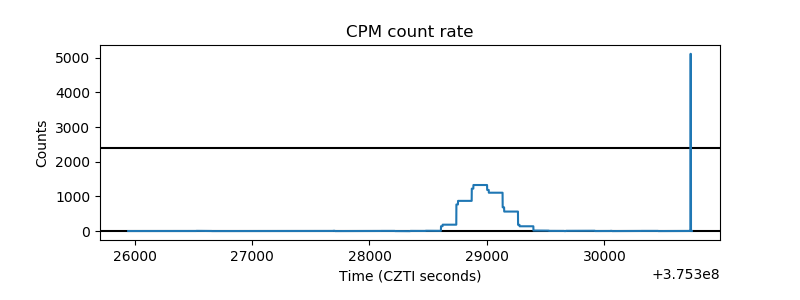 |
| CZT Counter | 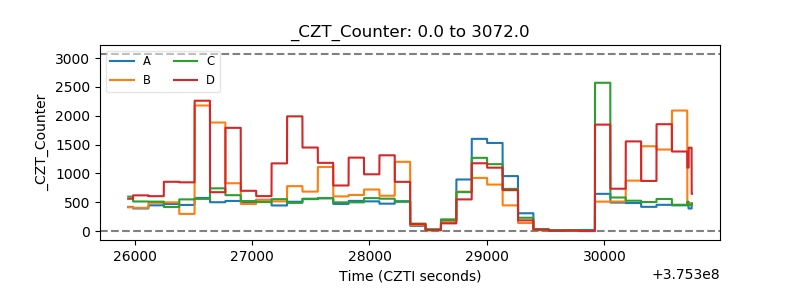 |
| +2.5 Volts monitor |  |
| +5 Volts monitor | 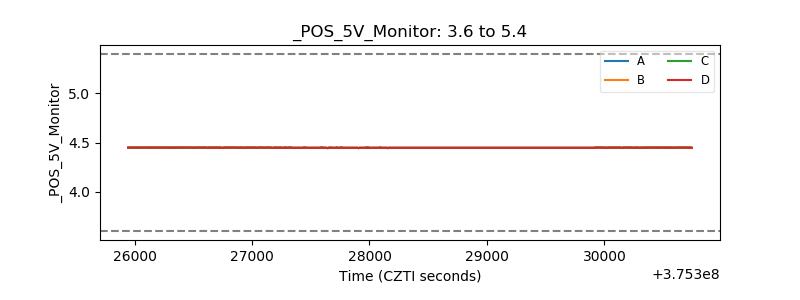 |
| _ROLL_ROT | 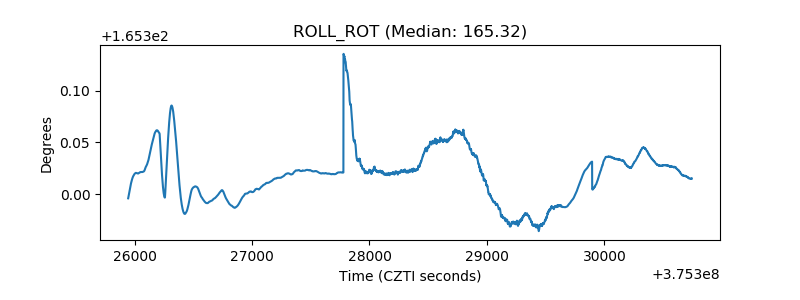 |
| _Roll_DEC | 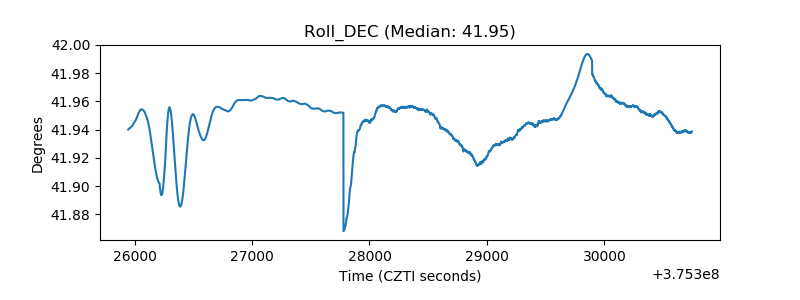 |
| _Roll_RA | 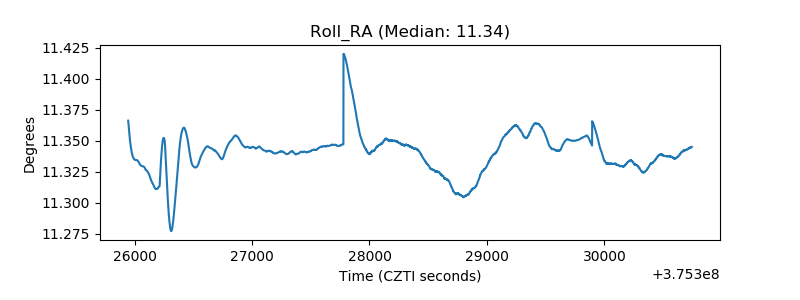 |
| Veto Counter | 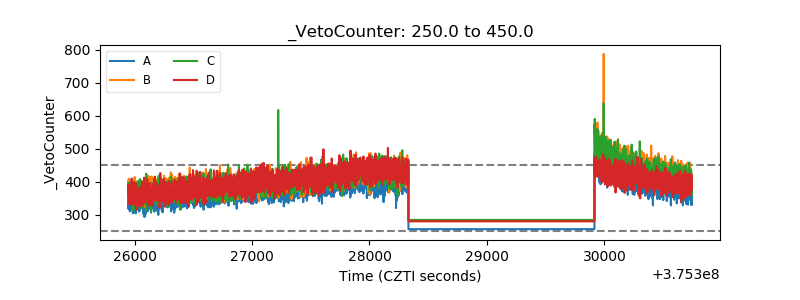 |