| Param | Original file | Final file |
|---|---|---|
| Filename | modeM0/AS1T04_072T01_9000004780_33274cztM0_level2.evt | modeM0/AS1T04_072T01_9000004780_33274cztM0_level2_quad_clean.evt |
| Size (bytes) | 536,967,360 | 54,509,760 |
| Size | 512.1 MB | 52.0 MB |
| Events in quadrant A | 2,934,103 | 327,450 |
| Events in quadrant B | 3,752,602 | 323,474 |
| Events in quadrant C | 3,469,881 | 316,902 |
| Events in quadrant D | 5,720,666 | 284,635 |
| Mode SS | |||
|---|---|---|---|
| Quadrant | BADHDUFLAG | Total packets | Discarded packets |
| A | 0 | 116 | 0 |
| B | 0 | 116 | 0 |
| C | 0 | 116 | 0 |
| D | 0 | 116 | 0 |
| Mode M0 | |||
|---|---|---|---|
| Quadrant | BADHDUFLAG | Total packets | Discarded packets |
| A | 0 | 12171 | 3 |
| B | 0 | 14717 | 2 |
| C | 0 | 13736 | 2 |
| D | 0 | 21100 | 2 |
| Mode M9 | |||
|---|---|---|---|
| Quadrant | BADHDUFLAG | Total packets | Discarded packets |
| A | 0 | 25 | 0 |
| B | 0 | 25 | 0 |
| C | 0 | 25 | 0 |
| D | 0 | 26 | 0 |
| Quadrant | Total seconds | Saturated seconds | Saturation percentage |
|---|---|---|---|
| A | 5682 | 17 | 0.299190% |
| B | 5682 | 258 | 4.540655% |
| C | 5682 | 82 | 1.443154% |
| D | 5682 | 556 | 9.785287% |
Noise dominated data is calculated using 1-second bins in cleaned event files. If a bin has >2000 counts, and if more than 50% of those come from <1% of pixels, then it is considered to be noise-dominated and hence unusable.
| Quadrant | # 1 sec bins | Bins with >0 counts | Bins with >2000 counts | High rate bins dominated by noise | Noise dominated (total time) | Noise dominated (detector-on time) | Marked lightcurve |
|---|---|---|---|---|---|---|---|
| A | 7385 | 5683 | 11 | 11 | 0.15% | 0.19% | 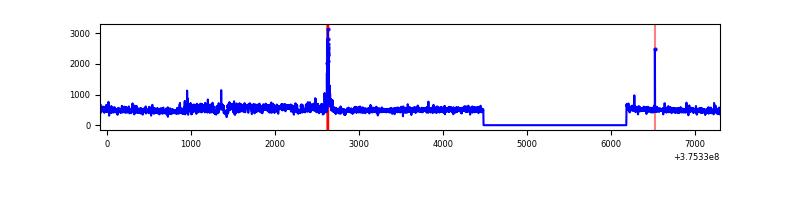 |
| B | 7385 | 5683 | 168 | 168 | 2.27% | 2.96% | 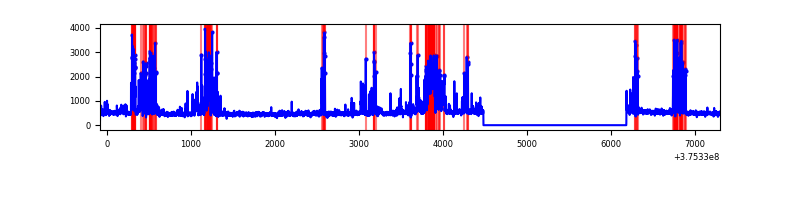 |
| C | 7385 | 5683 | 64 | 64 | 0.87% | 1.13% | 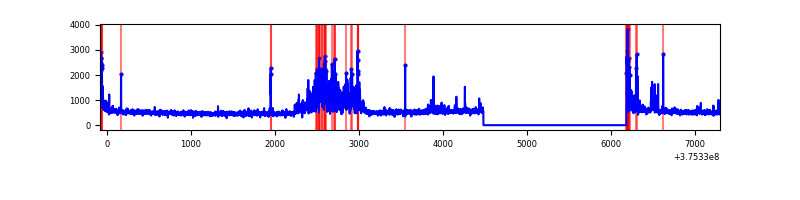 |
| D | 7385 | 5683 | 460 | 460 | 6.23% | 8.09% | 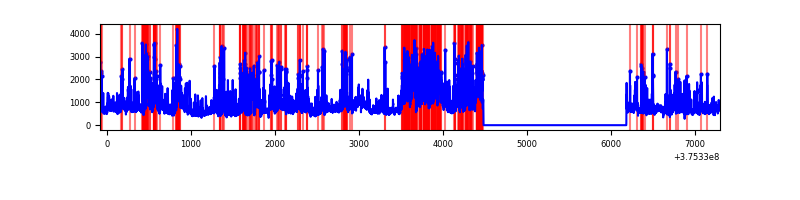 |
Top three noisy pixels from each quadrant. If the there are fewer than three noisy pixels in the level2.evt file, extra rows are filled as -1
| Pixel properties | Quadrant properties | ||||||
|---|---|---|---|---|---|---|---|
| Quadrant | DetID | PixID | Counts | Sigma | Mean | Median | Sigma |
| A | 15 | 169 | 246312 | 1791.62 | 682 | 667 | 137.1 |
| A | 15 | 17 | 43608 | 313.19 | 682 | 667 | 137.1 |
| A | 13 | 254 | 10191 | 69.46 | 682 | 667 | 137.1 |
| B | 5 | 172 | 839569 | 6573.08 | 670 | 656 | 127.6 |
| B | 5 | 200 | 139896 | 1090.98 | 670 | 656 | 127.6 |
| B | 0 | 219 | 43967 | 339.35 | 670 | 656 | 127.6 |
| C | 10 | 49 | 436396 | 2880.1 | 656 | 661 | 151.3 |
| C | 15 | 214 | 243097 | 1602.44 | 656 | 661 | 151.3 |
| C | 0 | 10 | 126924 | 834.57 | 656 | 661 | 151.3 |
| D | 8 | 195 | 967409 | 6222.82 | 635 | 616 | 155.4 |
| D | 12 | 218 | 438800 | 2820.4 | 635 | 616 | 155.4 |
| D | 2 | 249 | 433811 | 2788.29 | 635 | 616 | 155.4 |
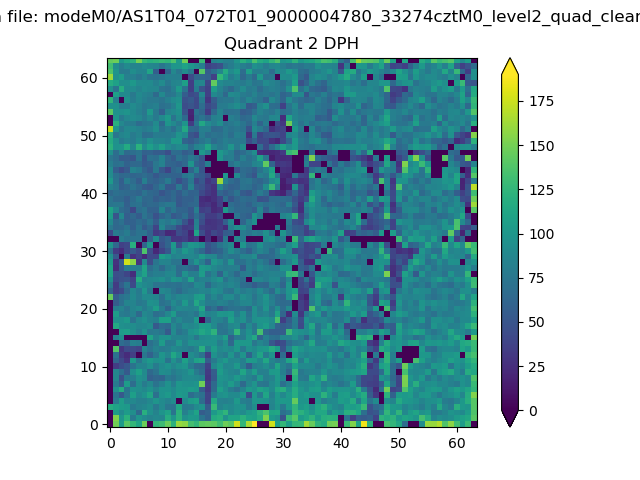
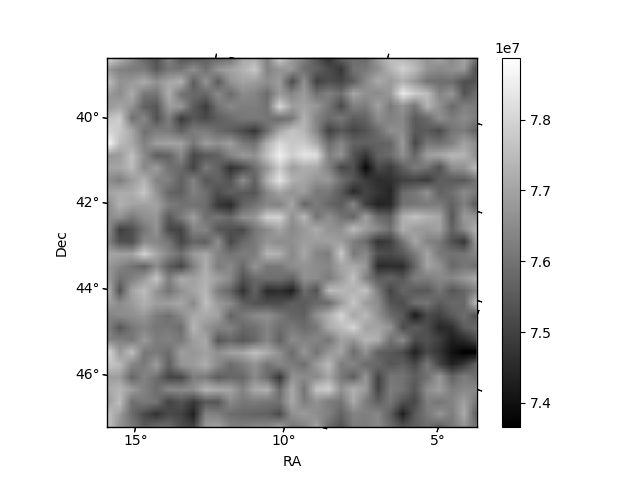
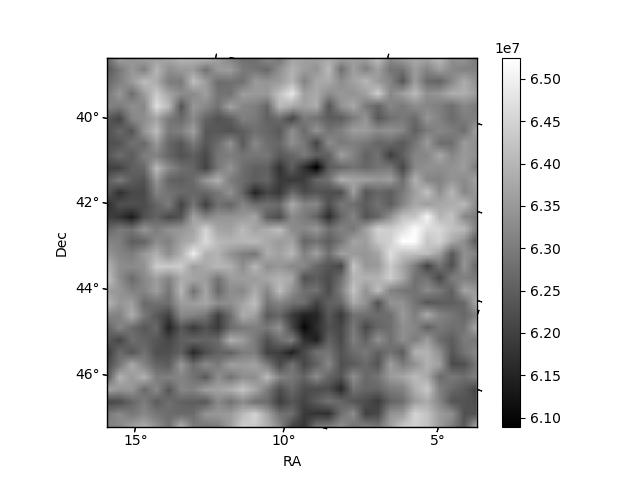
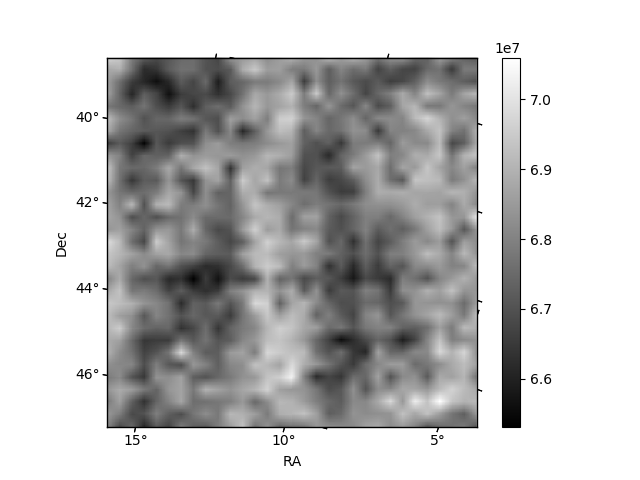
Histogram calculated using DETX and DETY for each event in the final _common_clean file
| Quadrant A | 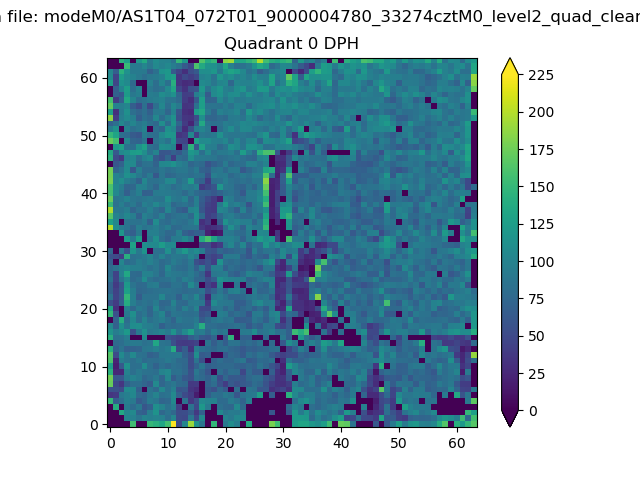 |
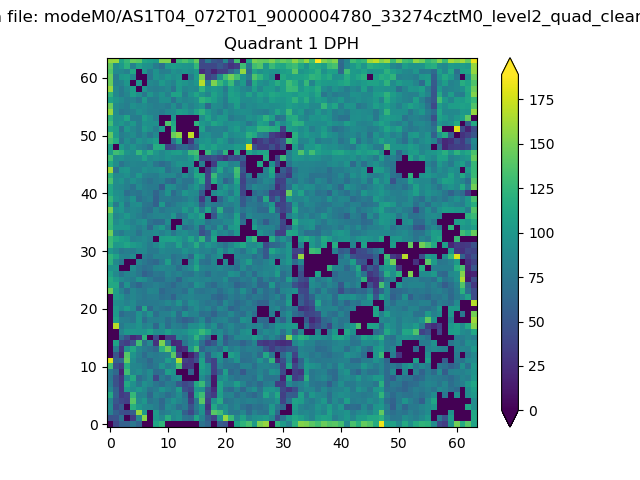 |
Quadrant B |
|---|---|---|---|
| Quadrant D | 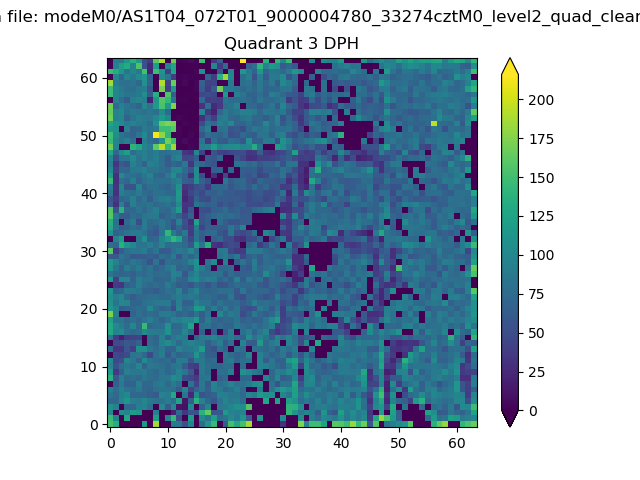 |
 |
Quadrant C |
| Plot type | Count rate plots | Images |
|---|---|---|
| Comparison with Poisson distribution Blue bars denote a histogram of data divided into 1 sec bins. Red curve is a Poisson curve with rate = median count rate of data. |
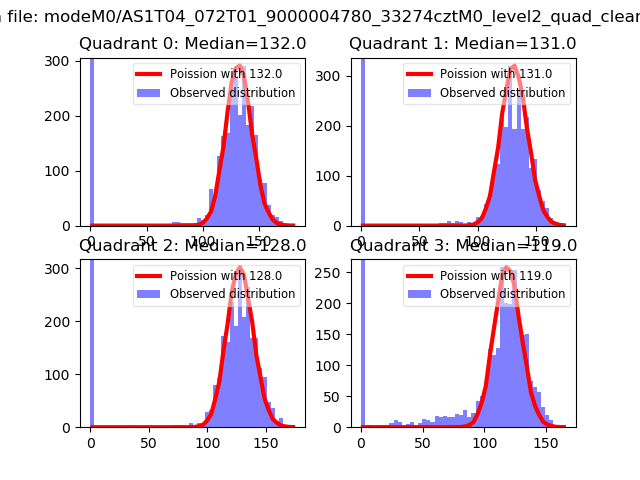 |
 |
| Quadrant-wise count rates Data is divided into 100 sec bins |
 |
|
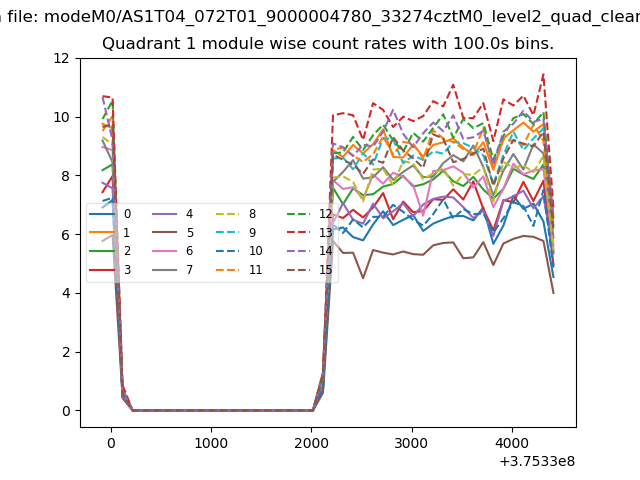
| Module-wise count rates for Quadrant A Data is divided into 100 sec bins |
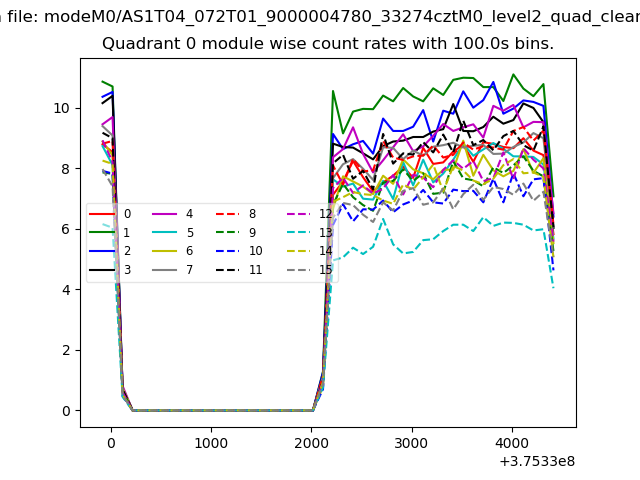 |
 |
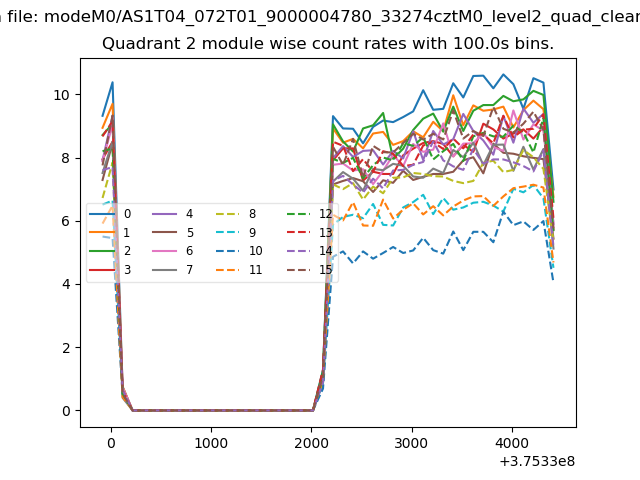
| Module-wise count rates for Quadrant B Data is divided into 100 sec bins |
 |
 |
| Module-wise count rates for Quadrant C Data is divided into 100 sec bins |
 |
 |
| Module-wise count rates for Quadrant D Data is divided into 100 sec bins |
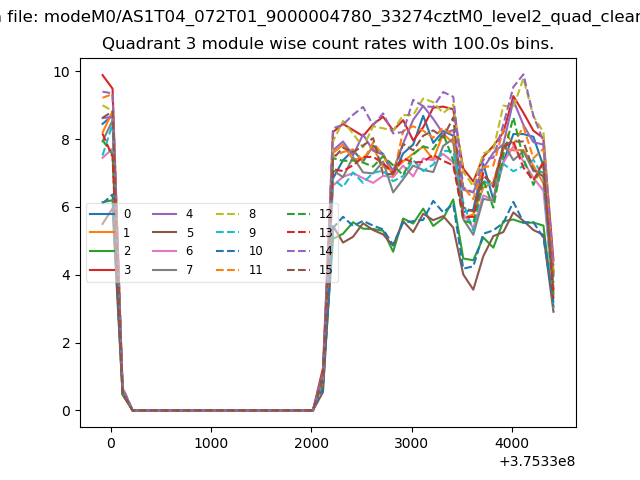 |
 |
| Parameter | Plot |
|---|---|
| CZT HV Monitor | 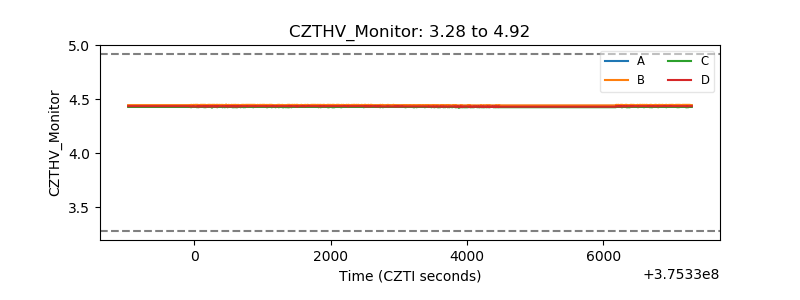 |
| D_VDD | 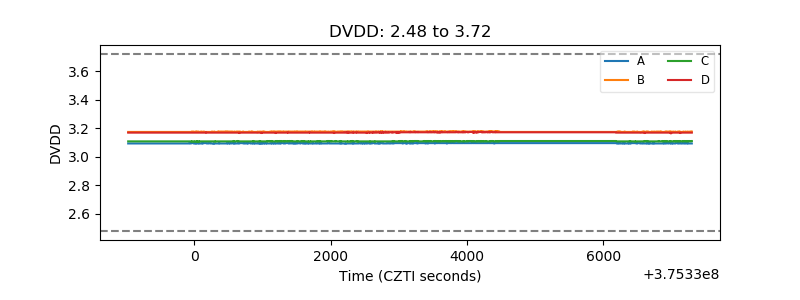 |
| Temperature 1 | 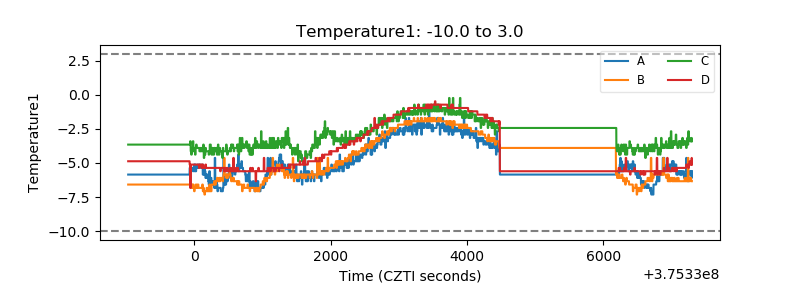 |
| Veto HV Monitor |  |
| Veto LLD |  |
| Alpha Counter | 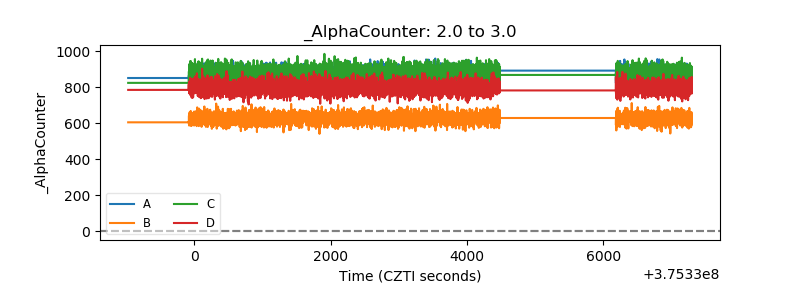 |
| _CPM_Rate |  |
| CZT Counter | 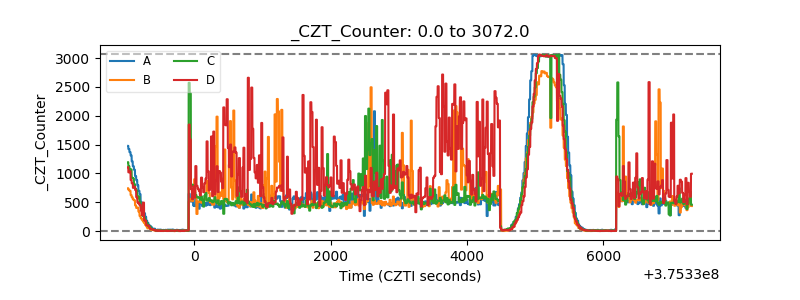 |
| +2.5 Volts monitor |  |
| +5 Volts monitor |  |
| _ROLL_ROT | 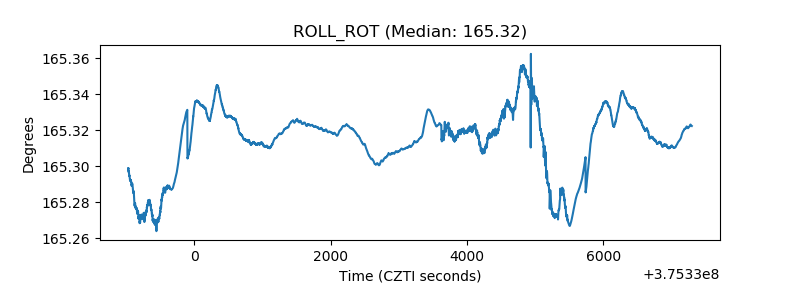 |
| _Roll_DEC | 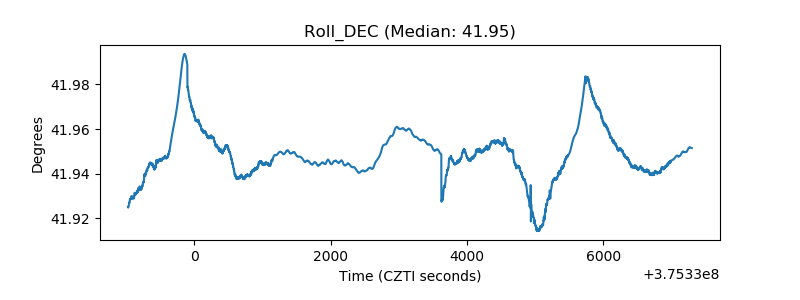 |
| _Roll_RA | 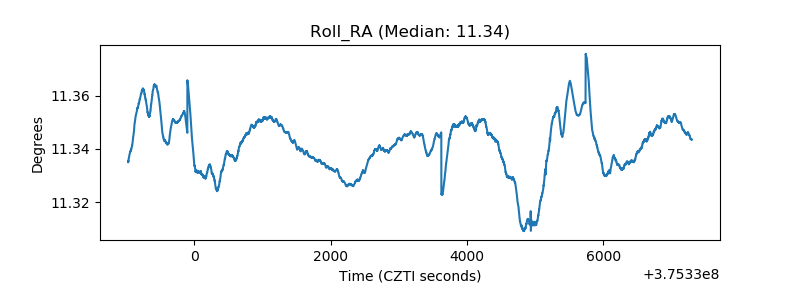 |
| Veto Counter | 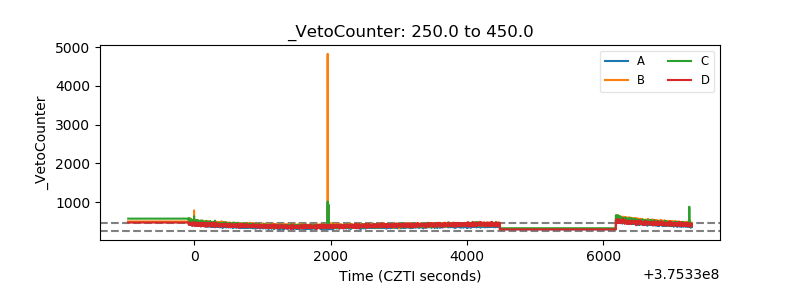 |