| Param | Original file | Final file |
|---|---|---|
| Filename | modeM0/AS1T04_072T01_9000004780_33277cztM0_level2.evt | modeM0/AS1T04_072T01_9000004780_33277cztM0_level2_quad_clean.evt |
| Size (bytes) | 515,946,240 | 64,261,440 |
| Size | 492.0 MB | 61.3 MB |
| Events in quadrant A | 2,763,265 | 414,803 |
| Events in quadrant B | 3,772,550 | 397,105 |
| Events in quadrant C | 3,623,236 | 396,825 |
| Events in quadrant D | 5,114,340 | 372,378 |
| Mode SS | |||
|---|---|---|---|
| Quadrant | BADHDUFLAG | Total packets | Discarded packets |
| A | 0 | 106 | 0 |
| B | 0 | 106 | 0 |
| C | 0 | 106 | 0 |
| D | 0 | 106 | 0 |
| Mode M0 | |||
|---|---|---|---|
| Quadrant | BADHDUFLAG | Total packets | Discarded packets |
| A | 0 | 11099 | 2 |
| B | 0 | 14559 | 1 |
| C | 0 | 14190 | 1 |
| D | 0 | 18899 | 1 |
| Mode M9 | |||
|---|---|---|---|
| Quadrant | BADHDUFLAG | Total packets | Discarded packets |
| A | 0 | 33 | 0 |
| B | 0 | 33 | 0 |
| C | 0 | 33 | 0 |
| D | 0 | 34 | 0 |
| Quadrant | Total seconds | Saturated seconds | Saturation percentage |
|---|---|---|---|
| A | 5202 | 10 | 0.192234% |
| B | 5202 | 265 | 5.094195% |
| C | 5202 | 78 | 1.499423% |
| D | 5202 | 369 | 7.093426% |
Noise dominated data is calculated using 1-second bins in cleaned event files. If a bin has >2000 counts, and if more than 50% of those come from <1% of pixels, then it is considered to be noise-dominated and hence unusable.
| Quadrant | # 1 sec bins | Bins with >0 counts | Bins with >2000 counts | High rate bins dominated by noise | Noise dominated (total time) | Noise dominated (detector-on time) | Marked lightcurve |
|---|---|---|---|---|---|---|---|
| A | 7175 | 5203 | 3 | 3 | 0.04% | 0.06% | 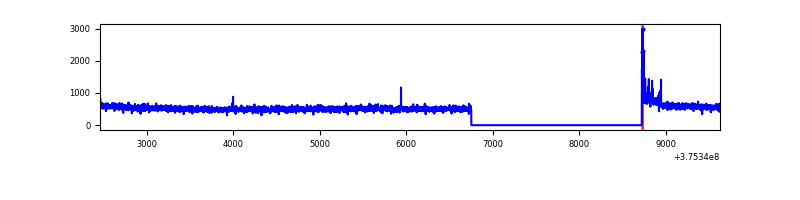 |
| B | 7175 | 5203 | 205 | 205 | 2.86% | 3.94% | 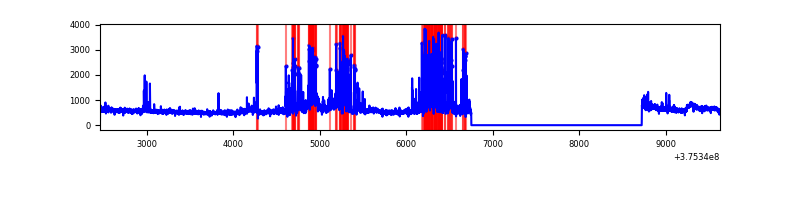 |
| C | 7175 | 5203 | 58 | 58 | 0.81% | 1.11% | 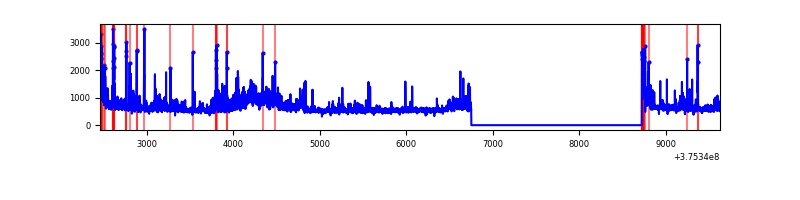 |
| D | 7175 | 5203 | 329 | 329 | 4.59% | 6.32% | 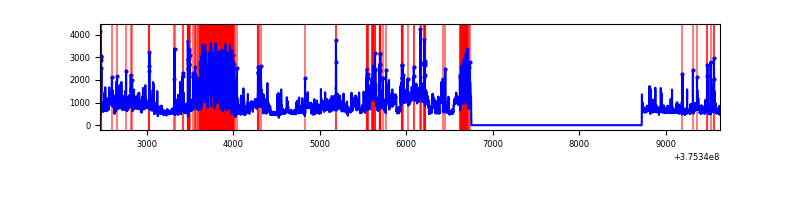 |
Top three noisy pixels from each quadrant. If the there are fewer than three noisy pixels in the level2.evt file, extra rows are filled as -1
| Pixel properties | Quadrant properties | ||||||
|---|---|---|---|---|---|---|---|
| Quadrant | DetID | PixID | Counts | Sigma | Mean | Median | Sigma |
| A | 15 | 169 | 65854 | 472.65 | 695 | 682 | 137.9 |
| A | 13 | 254 | 11064 | 75.29 | 695 | 682 | 137.9 |
| A | 13 | 6 | 8717 | 58.27 | 695 | 682 | 137.9 |
| B | 5 | 172 | 891053 | 7066.9 | 676 | 660 | 126.0 |
| B | 0 | 219 | 174906 | 1382.96 | 676 | 660 | 126.0 |
| B | 0 | 190 | 16211 | 123.43 | 676 | 660 | 126.0 |
| C | 10 | 49 | 350843 | 2346.39 | 653 | 659 | 149.2 |
| C | 15 | 214 | 224964 | 1502.95 | 653 | 659 | 149.2 |
| C | 1 | 23 | 158296 | 1056.24 | 653 | 659 | 149.2 |
| D | 8 | 195 | 1160212 | 6686.65 | 641 | 631 | 173.4 |
| D | 2 | 250 | 814542 | 4693.37 | 641 | 631 | 173.4 |
| D | 2 | 249 | 291745 | 1678.69 | 641 | 631 | 173.4 |
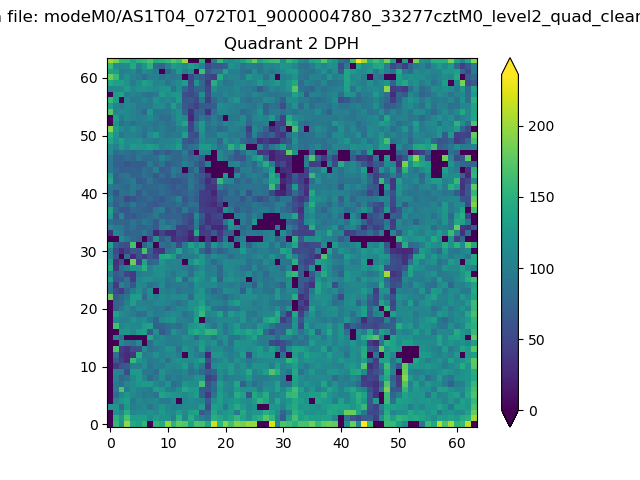
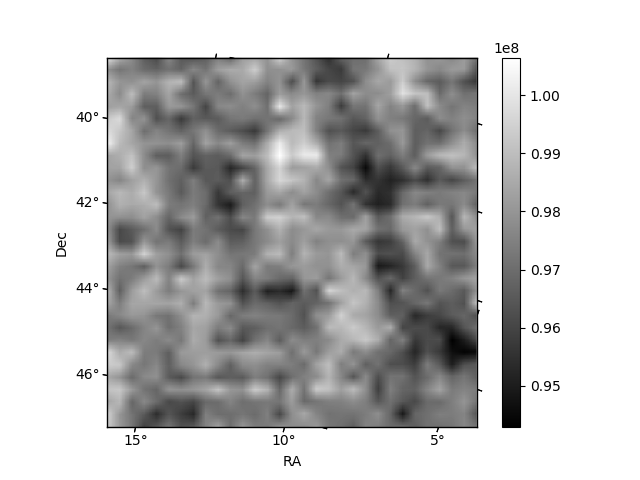
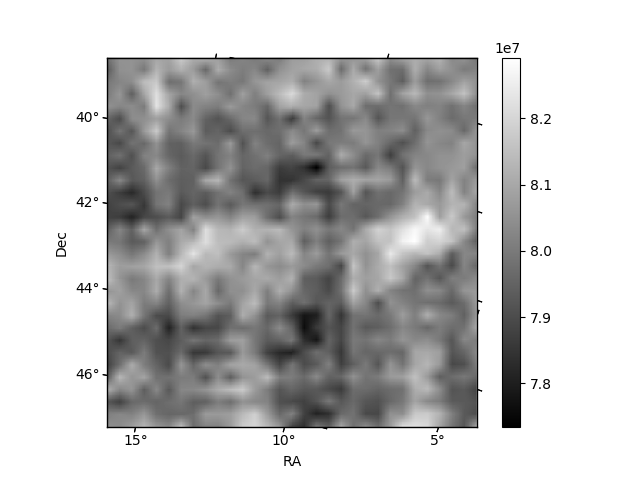
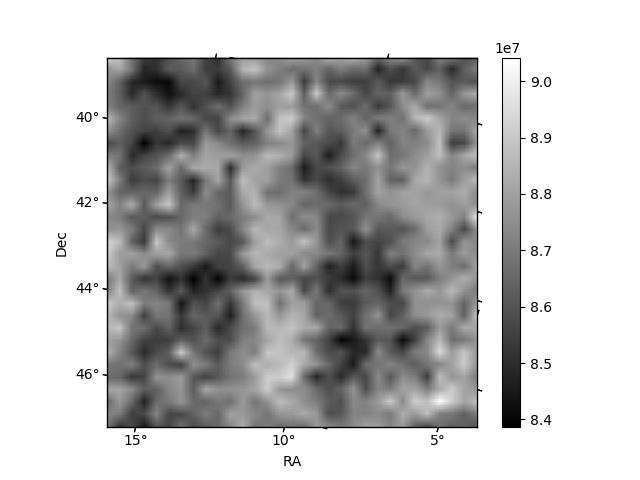
Histogram calculated using DETX and DETY for each event in the final _common_clean file
| Quadrant A | 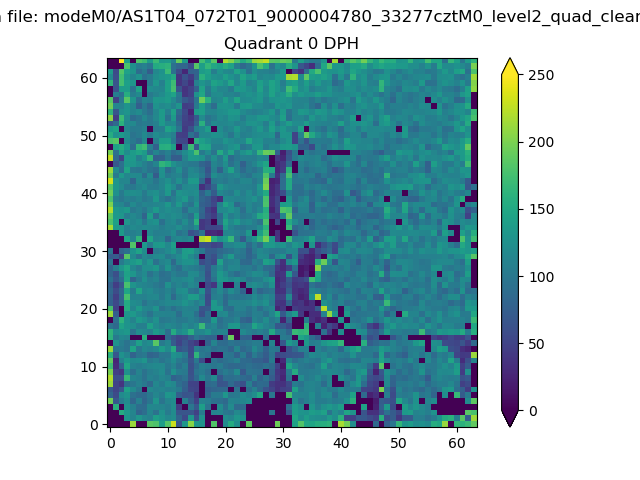 |
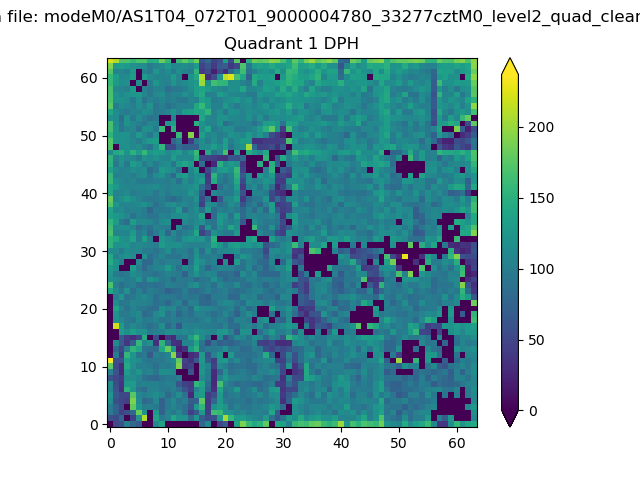 |
Quadrant B |
|---|---|---|---|
| Quadrant D | 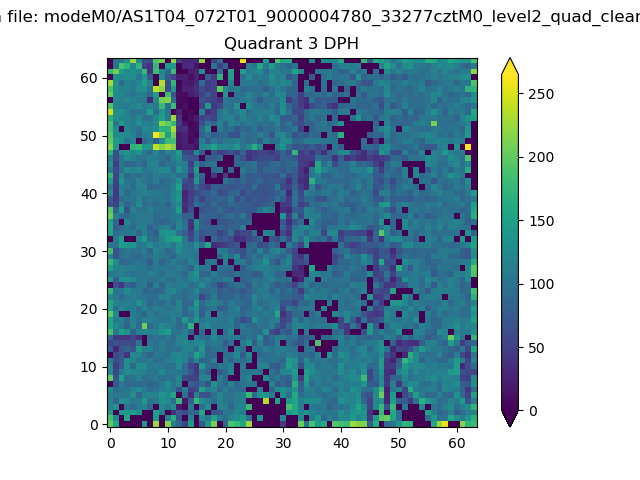 |
 |
Quadrant C |
| Plot type | Count rate plots | Images |
|---|---|---|
| Comparison with Poisson distribution Blue bars denote a histogram of data divided into 1 sec bins. Red curve is a Poisson curve with rate = median count rate of data. |
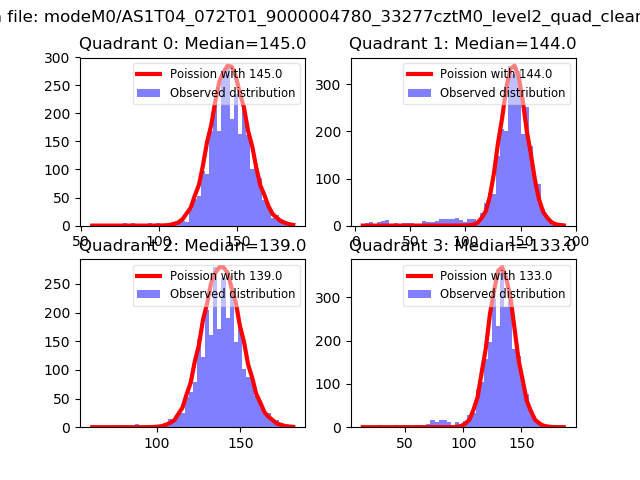 |
 |
| Quadrant-wise count rates Data is divided into 100 sec bins |
 |
|
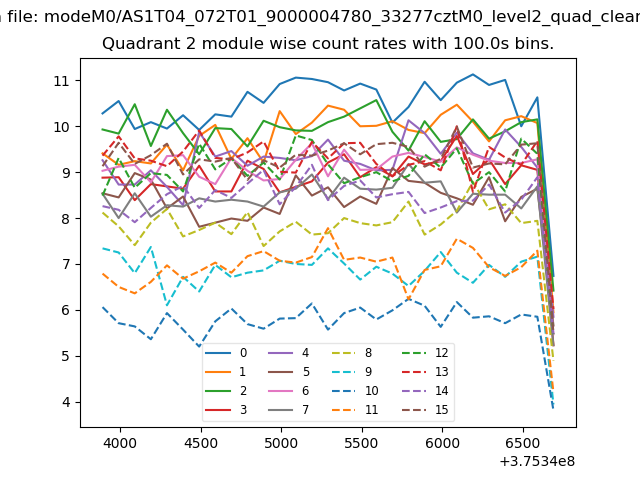
| Module-wise count rates for Quadrant A Data is divided into 100 sec bins |
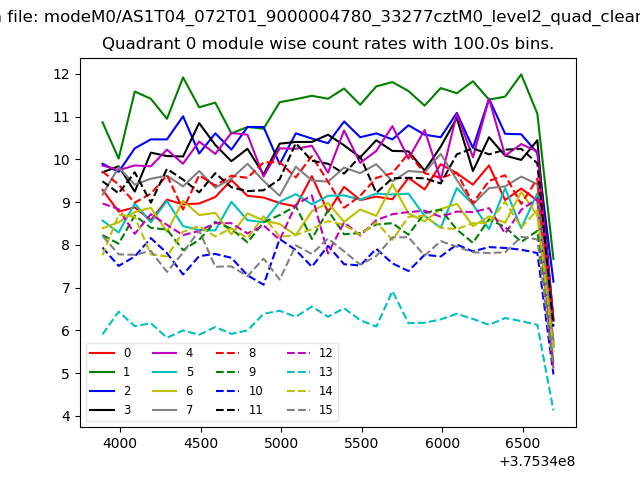 |
 |
| Module-wise count rates for Quadrant B Data is divided into 100 sec bins |
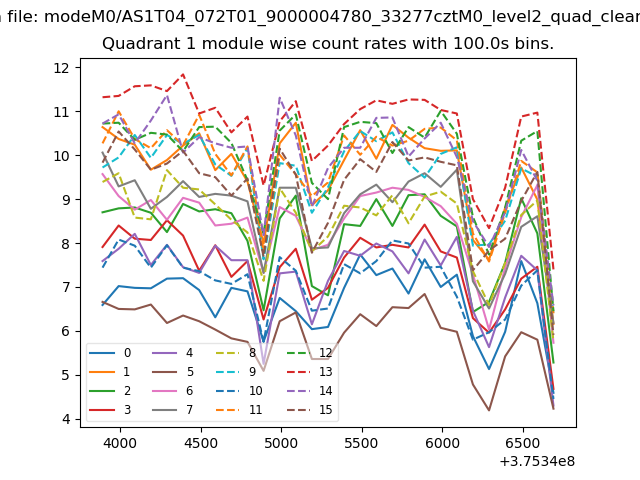 |
 |
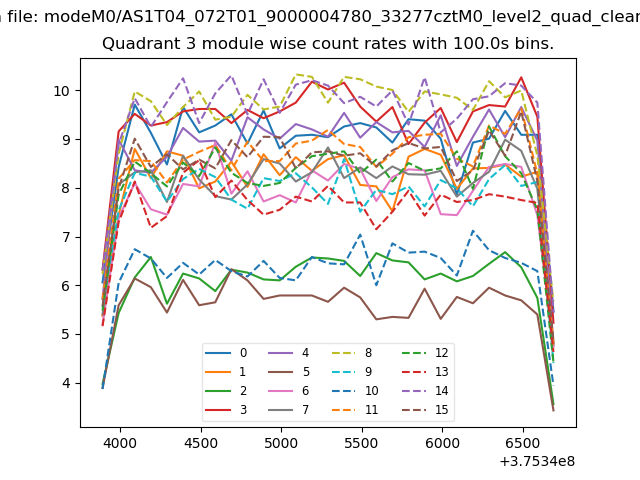
| Module-wise count rates for Quadrant C Data is divided into 100 sec bins |
 |
 |
| Module-wise count rates for Quadrant D Data is divided into 100 sec bins |
 |
 |
| Parameter | Plot |
|---|---|
| CZT HV Monitor | 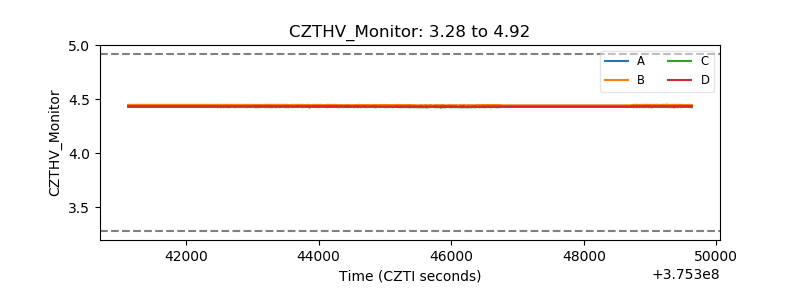 |
| D_VDD | 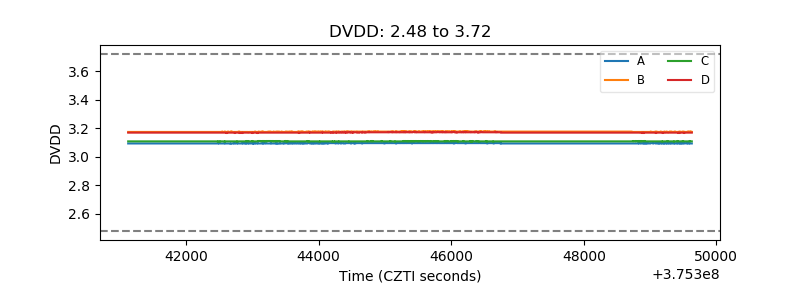 |
| Temperature 1 | 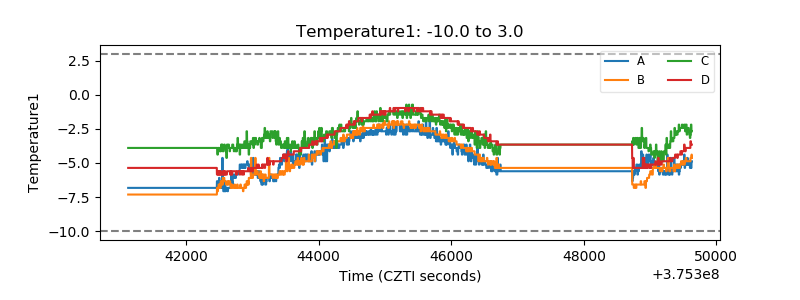 |
| Veto HV Monitor |  |
| Veto LLD |  |
| Alpha Counter |  |
| _CPM_Rate | 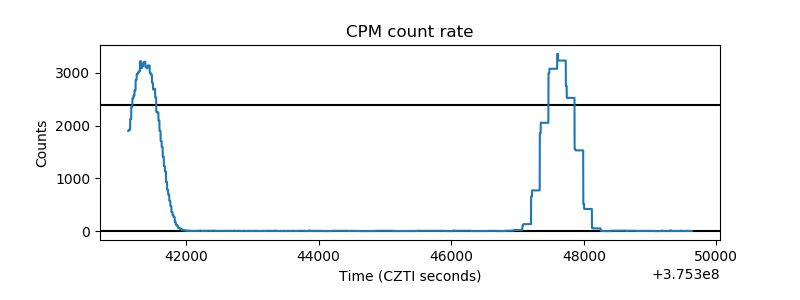 |
| CZT Counter |  |
| +2.5 Volts monitor |  |
| +5 Volts monitor |  |
| _ROLL_ROT | 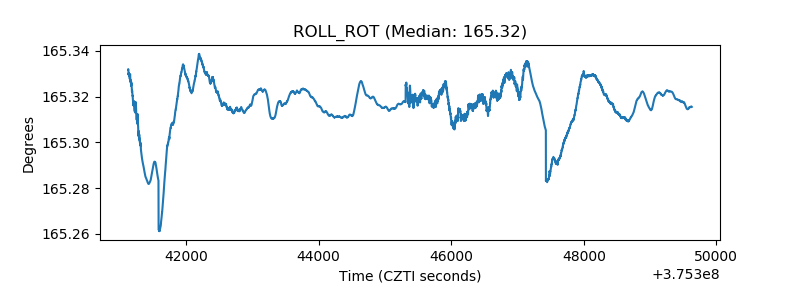 |
| _Roll_DEC | 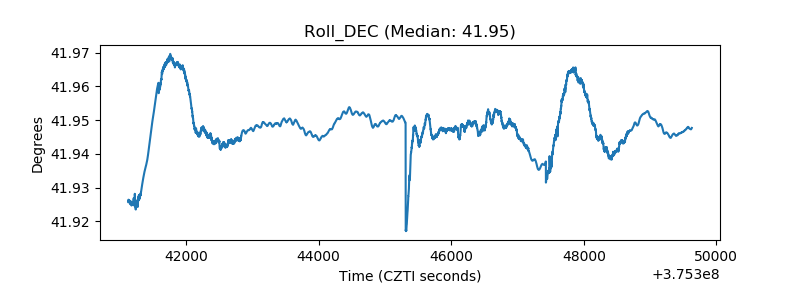 |
| _Roll_RA |  |
| Veto Counter | 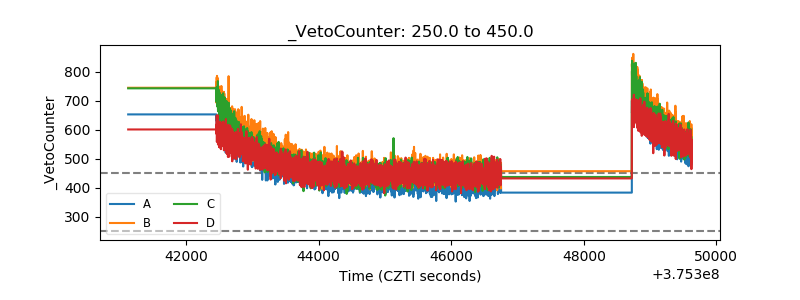 |