| Param | Original file | Final file |
|---|---|---|
| Filename | modeM0/AS1T04_072T01_9000004780_33278cztM0_level2.evt | modeM0/AS1T04_072T01_9000004780_33278cztM0_level2_quad_clean.evt |
| Size (bytes) | 490,826,880 | 78,635,520 |
| Size | 468.1 MB | 75.0 MB |
| Events in quadrant A | 2,897,831 | 532,569 |
| Events in quadrant B | 3,812,536 | 509,174 |
| Events in quadrant C | 3,342,727 | 506,565 |
| Events in quadrant D | 4,470,928 | 480,145 |
| Mode SS | |||
|---|---|---|---|
| Quadrant | BADHDUFLAG | Total packets | Discarded packets |
| A | 0 | 104 | 0 |
| B | 0 | 104 | 0 |
| C | 0 | 104 | 0 |
| D | 0 | 104 | 0 |
| Mode M0 | |||
|---|---|---|---|
| Quadrant | BADHDUFLAG | Total packets | Discarded packets |
| A | 0 | 11409 | 2 |
| B | 0 | 14743 | 1 |
| C | 0 | 13051 | 1 |
| D | 0 | 16910 | 1 |
| Mode M9 | |||
|---|---|---|---|
| Quadrant | BADHDUFLAG | Total packets | Discarded packets |
| A | 0 | 40 | 0 |
| B | 0 | 40 | 0 |
| C | 0 | 40 | 0 |
| D | 0 | 40 | 0 |
| Quadrant | Total seconds | Saturated seconds | Saturation percentage |
|---|---|---|---|
| A | 5032 | 75 | 1.490461% |
| B | 5032 | 318 | 6.319555% |
| C | 5032 | 105 | 2.086645% |
| D | 5032 | 144 | 2.861685% |
Noise dominated data is calculated using 1-second bins in cleaned event files. If a bin has >2000 counts, and if more than 50% of those come from <1% of pixels, then it is considered to be noise-dominated and hence unusable.
| Quadrant | # 1 sec bins | Bins with >0 counts | Bins with >2000 counts | High rate bins dominated by noise | Noise dominated (total time) | Noise dominated (detector-on time) | Marked lightcurve |
|---|---|---|---|---|---|---|---|
| A | 9068 | 5034 | 58 | 58 | 0.64% | 1.15% | 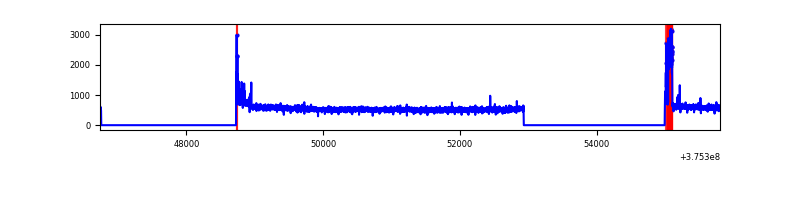 |
| B | 9068 | 5034 | 254 | 254 | 2.80% | 5.05% | 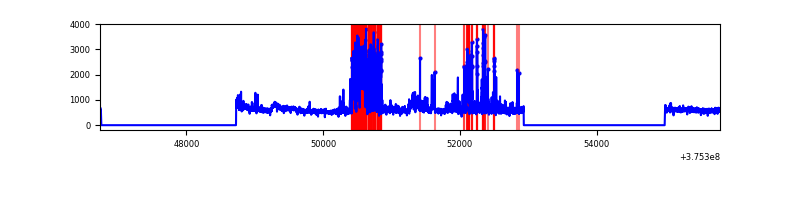 |
| C | 9068 | 5034 | 85 | 85 | 0.94% | 1.69% | 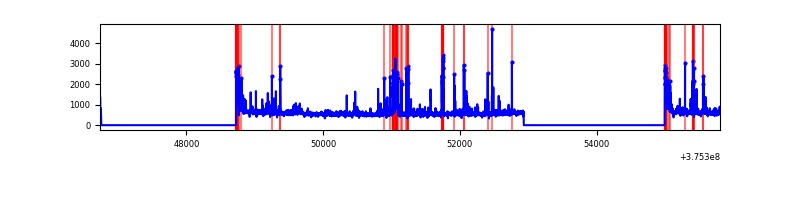 |
| D | 9068 | 5034 | 130 | 130 | 1.43% | 2.58% | 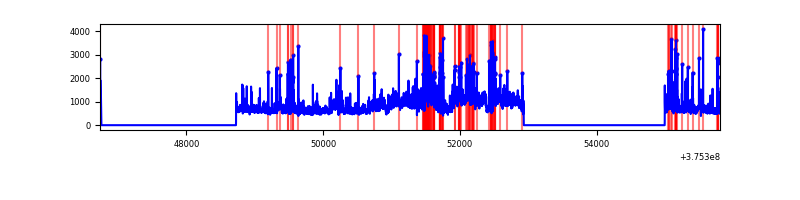 |
Top three noisy pixels from each quadrant. If the there are fewer than three noisy pixels in the level2.evt file, extra rows are filled as -1
| Pixel properties | Quadrant properties | ||||||
|---|---|---|---|---|---|---|---|
| Quadrant | DetID | PixID | Counts | Sigma | Mean | Median | Sigma |
| A | 15 | 169 | 208228 | 1527.54 | 692 | 682 | 135.9 |
| A | 13 | 6 | 14419 | 101.1 | 692 | 682 | 135.9 |
| A | 13 | 254 | 10035 | 68.84 | 692 | 682 | 135.9 |
| B | 5 | 172 | 889536 | 7180.89 | 669 | 655 | 123.8 |
| B | 0 | 219 | 173947 | 1399.95 | 669 | 655 | 123.8 |
| B | 5 | 200 | 31979 | 253.05 | 669 | 655 | 123.8 |
| C | 15 | 214 | 218247 | 1466.61 | 649 | 654 | 148.4 |
| C | 1 | 23 | 175970 | 1181.66 | 649 | 654 | 148.4 |
| C | 15 | 208 | 162236 | 1089.09 | 649 | 654 | 148.4 |
| D | 8 | 195 | 1063621 | 6111.45 | 652 | 641 | 173.9 |
| D | 12 | 218 | 298549 | 1712.78 | 652 | 641 | 173.9 |
| D | 12 | 6 | 179654 | 1029.21 | 652 | 641 | 173.9 |
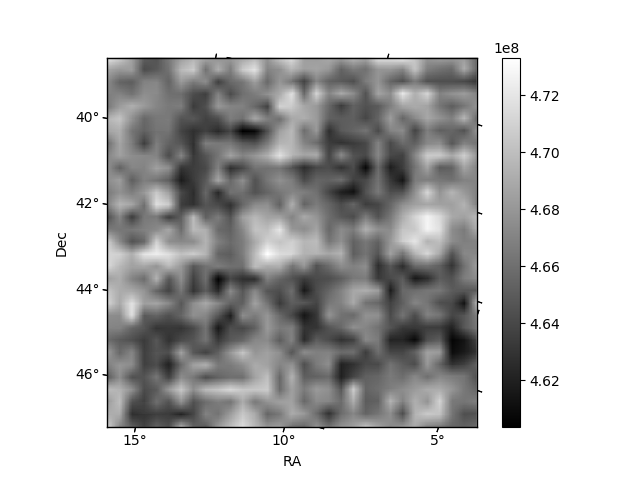
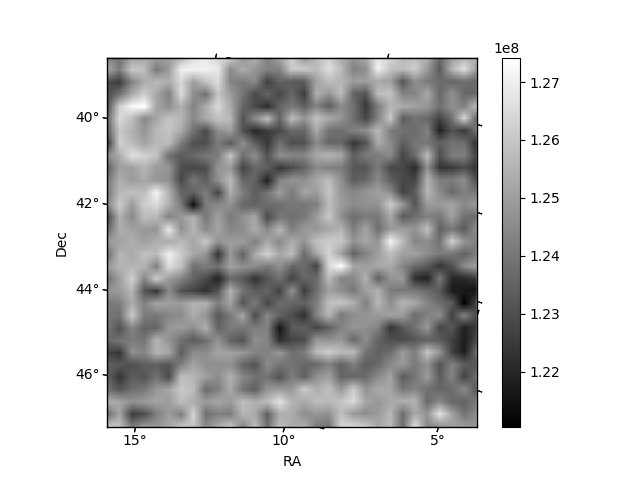
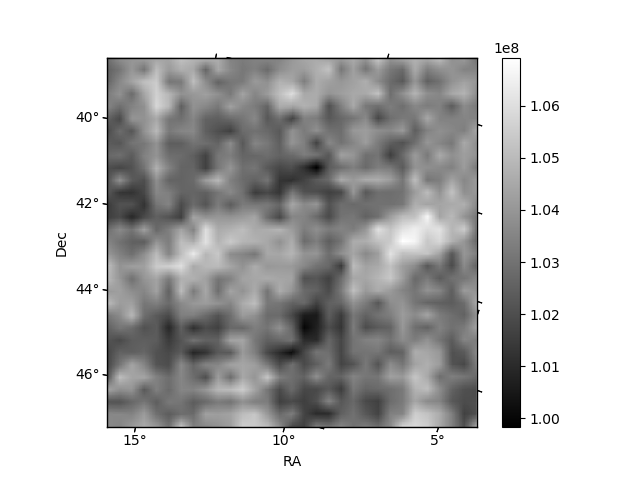
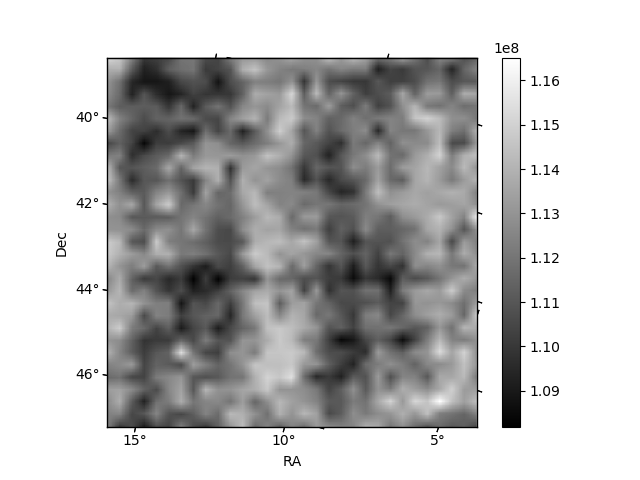
Histogram calculated using DETX and DETY for each event in the final _common_clean file
| Quadrant A | 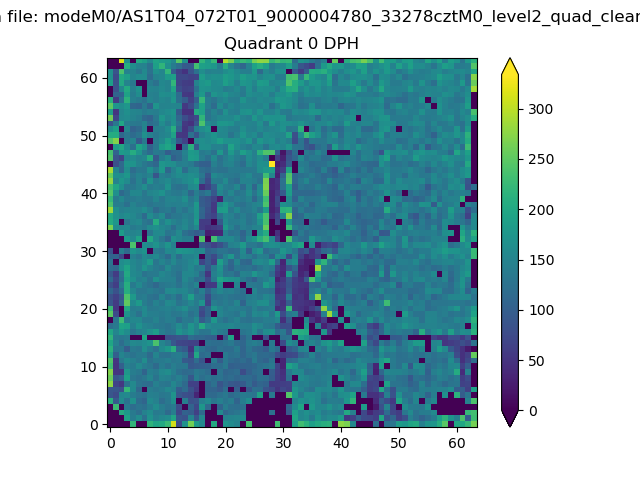 |
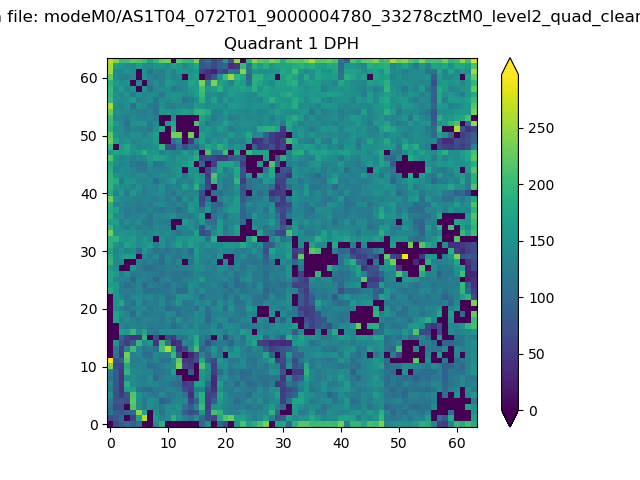 |
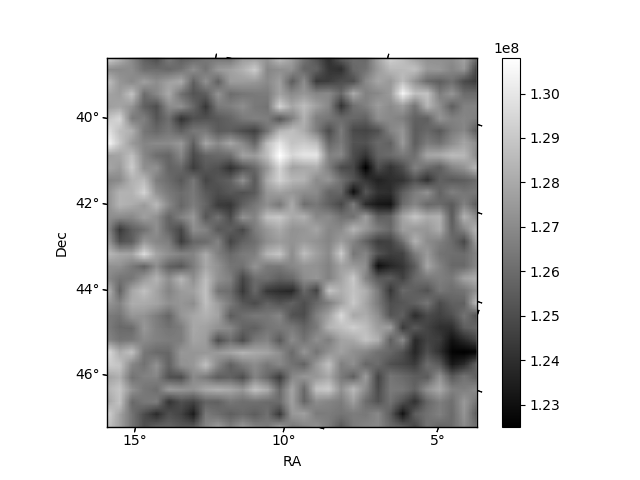
Quadrant B |
|---|---|---|---|
| Quadrant D | 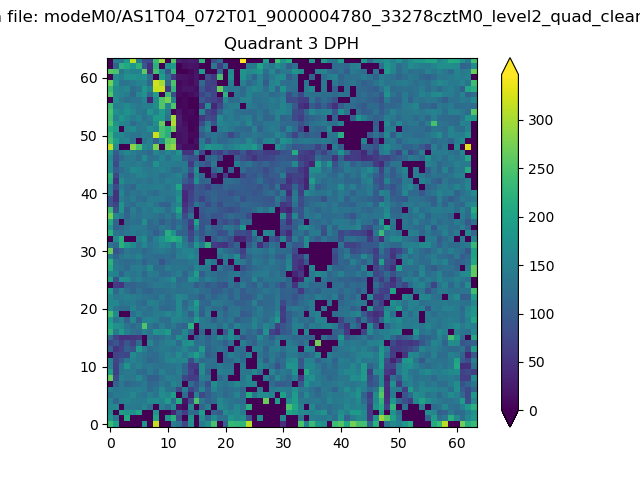 |
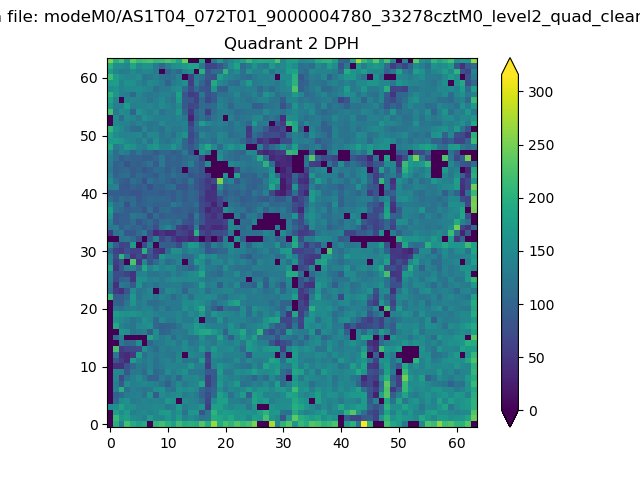 |
Quadrant C |
| Plot type | Count rate plots | Images |
|---|---|---|
| Comparison with Poisson distribution Blue bars denote a histogram of data divided into 1 sec bins. Red curve is a Poisson curve with rate = median count rate of data. |
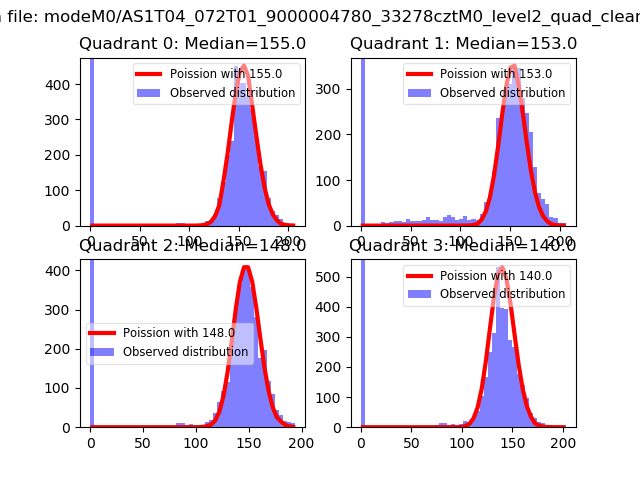 |
 |
| Quadrant-wise count rates Data is divided into 100 sec bins |
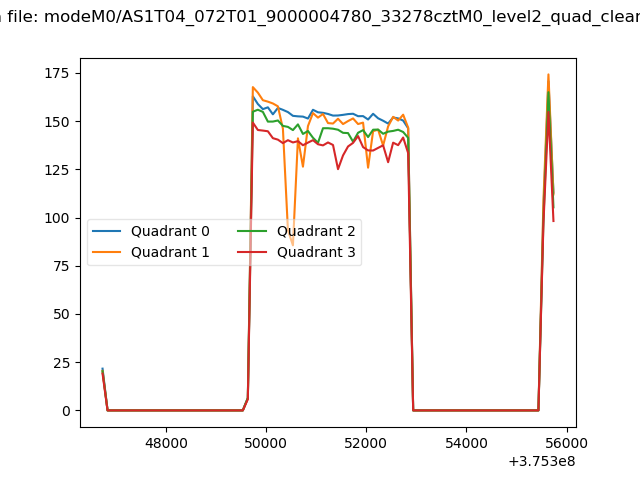 |
|
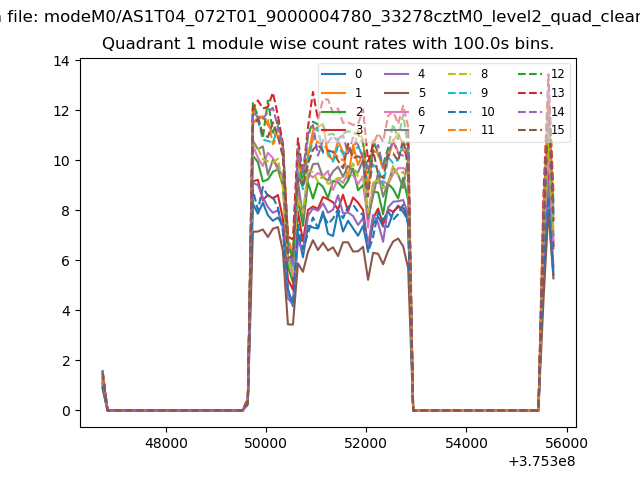
| Module-wise count rates for Quadrant A Data is divided into 100 sec bins |
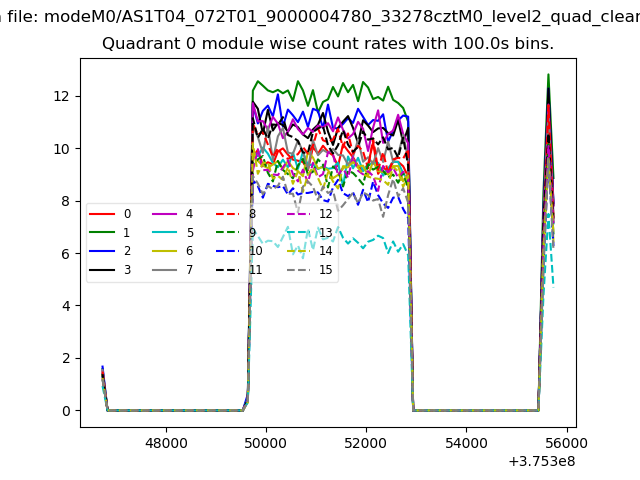 |
 |
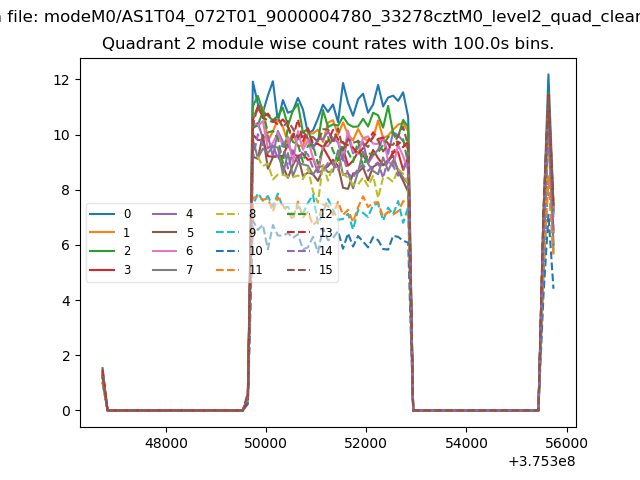
| Module-wise count rates for Quadrant B Data is divided into 100 sec bins |
 |
 |
| Module-wise count rates for Quadrant C Data is divided into 100 sec bins |
 |
 |
| Module-wise count rates for Quadrant D Data is divided into 100 sec bins |
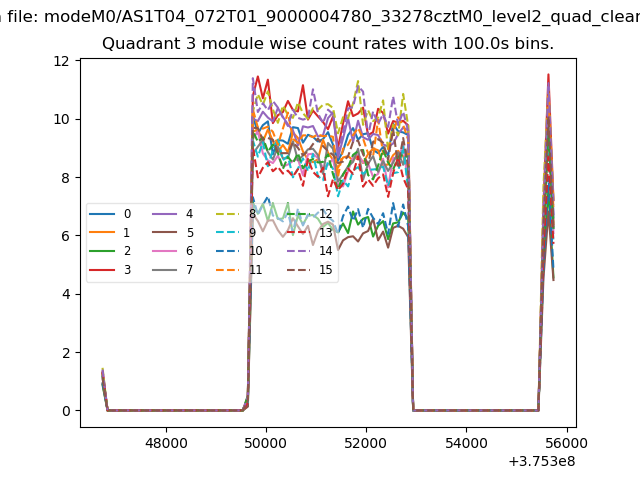 |
 |
| Parameter | Plot |
|---|---|
| CZT HV Monitor | 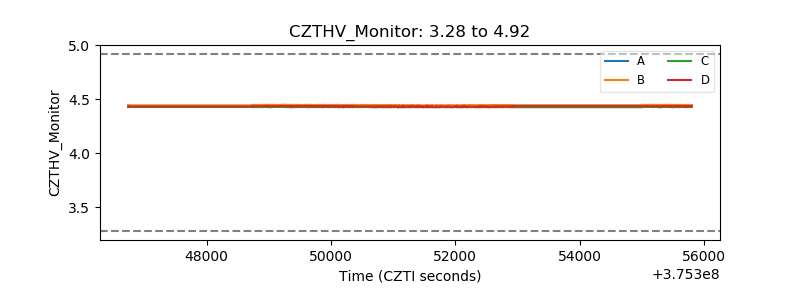 |
| D_VDD | 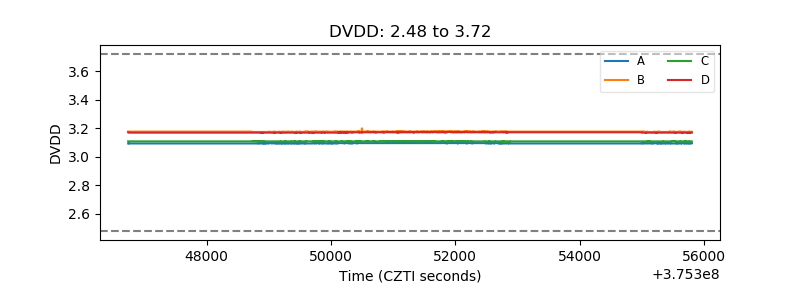 |
| Temperature 1 | 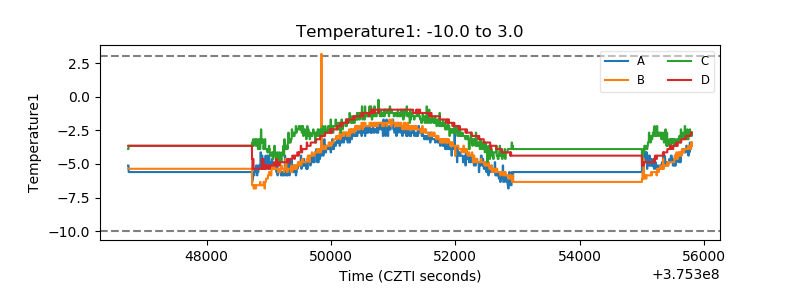 |
| Veto HV Monitor |  |
| Veto LLD | 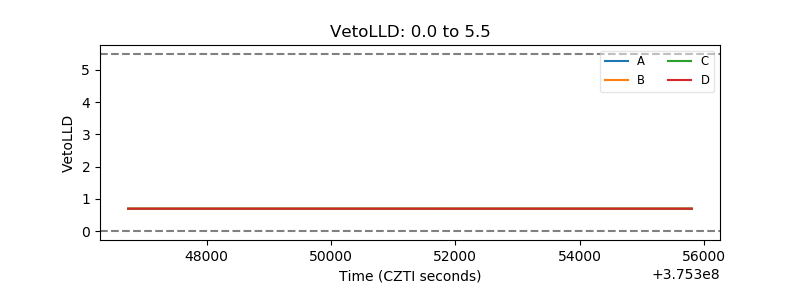 |
| Alpha Counter | 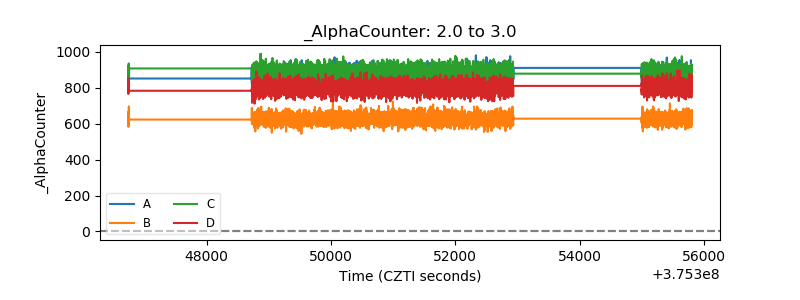 |
| _CPM_Rate | 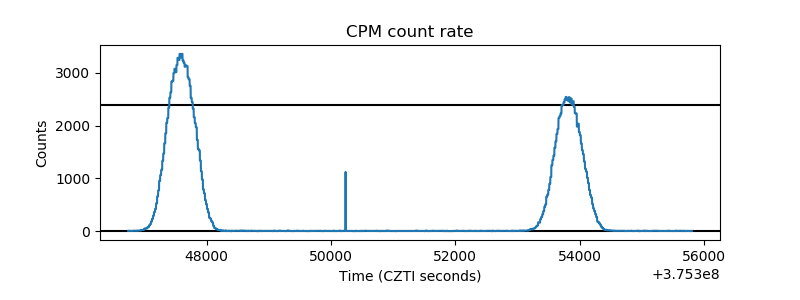 |
| CZT Counter | 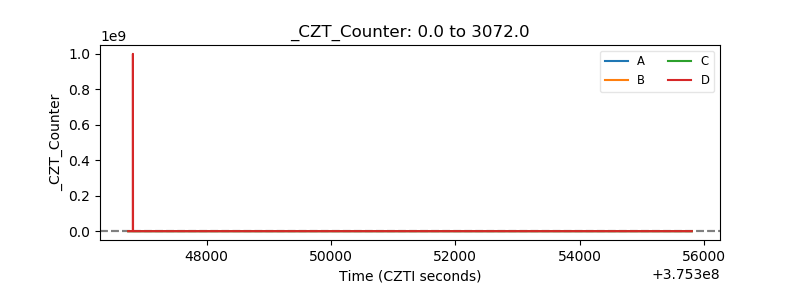 |
| +2.5 Volts monitor |  |
| +5 Volts monitor |  |
| _ROLL_ROT | 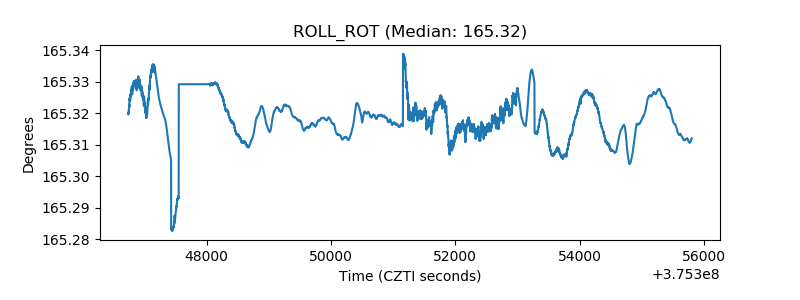 |
| _Roll_DEC | 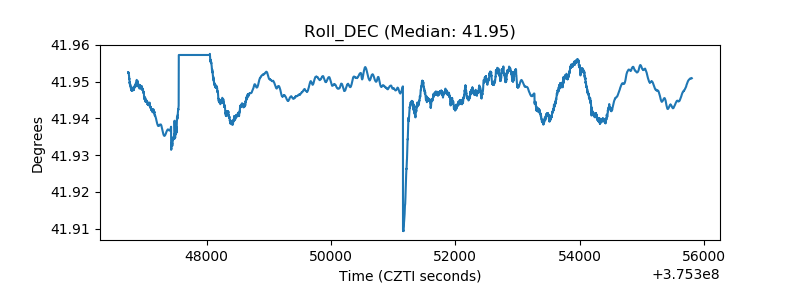 |
| _Roll_RA | 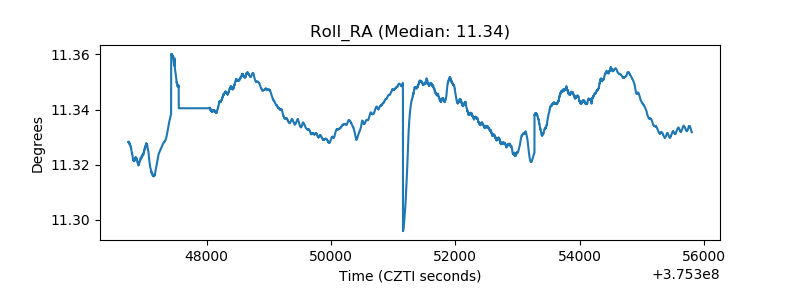 |
| Veto Counter | 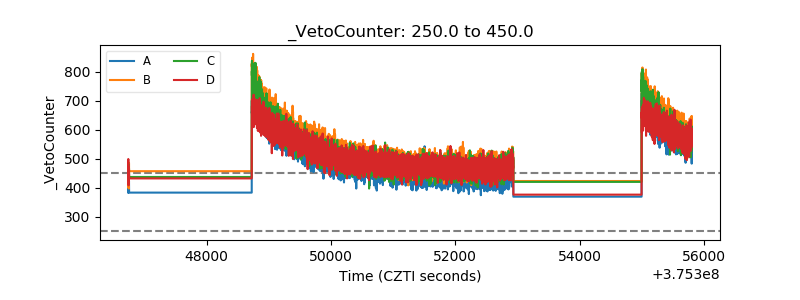 |