| Param | Original file | Final file |
|---|---|---|
| Filename | modeM0/AS1T04_072T01_9000004780_33279cztM0_level2.evt | modeM0/AS1T04_072T01_9000004780_33279cztM0_level2_quad_clean.evt |
| Size (bytes) | 920,908,800 | 167,117,760 |
| Size | 878.2 MB | 159.4 MB |
| Events in quadrant A | 5,396,779 | 1,159,906 |
| Events in quadrant B | 6,874,648 | 1,123,179 |
| Events in quadrant C | 6,470,161 | 1,094,742 |
| Events in quadrant D | 8,526,980 | 1,044,100 |
| Mode SS | |||
|---|---|---|---|
| Quadrant | BADHDUFLAG | Total packets | Discarded packets |
| A | 0 | 190 | 0 |
| B | 0 | 190 | 0 |
| C | 0 | 190 | 0 |
| D | 0 | 190 | 0 |
| Mode M0 | |||
|---|---|---|---|
| Quadrant | BADHDUFLAG | Total packets | Discarded packets |
| A | 0 | 21151 | 3 |
| B | 0 | 26456 | 2 |
| C | 0 | 24892 | 2 |
| D | 0 | 31918 | 2 |
| Mode M9 | |||
|---|---|---|---|
| Quadrant | BADHDUFLAG | Total packets | Discarded packets |
| A | 0 | 47 | 0 |
| B | 0 | 47 | 0 |
| C | 0 | 47 | 0 |
| D | 0 | 48 | 0 |
| Quadrant | Total seconds | Saturated seconds | Saturation percentage |
|---|---|---|---|
| A | 9217 | 112 | 1.215146% |
| B | 9217 | 540 | 5.858739% |
| C | 9217 | 306 | 3.319952% |
| D | 9217 | 342 | 3.710535% |
Noise dominated data is calculated using 1-second bins in cleaned event files. If a bin has >2000 counts, and if more than 50% of those come from <1% of pixels, then it is considered to be noise-dominated and hence unusable.
| Quadrant | # 1 sec bins | Bins with >0 counts | Bins with >2000 counts | High rate bins dominated by noise | Noise dominated (total time) | Noise dominated (detector-on time) | Marked lightcurve |
|---|---|---|---|---|---|---|---|
| A | 13402 | 9219 | 67 | 67 | 0.50% | 0.73% | 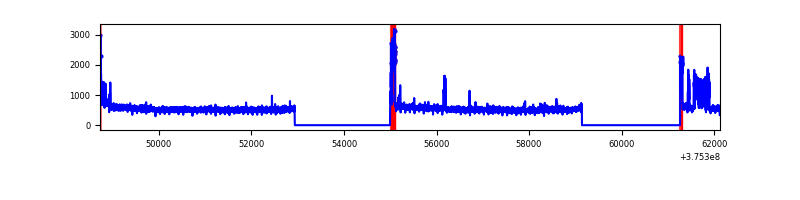 |
| B | 13402 | 9219 | 427 | 427 | 3.19% | 4.63% | 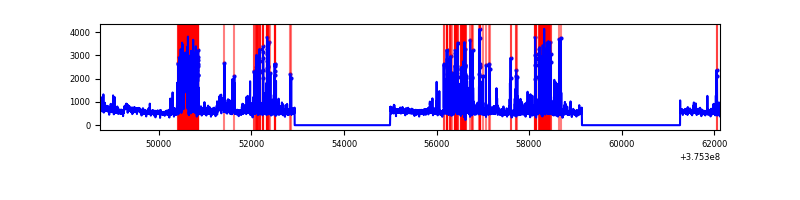 |
| C | 13402 | 9218 | 274 | 274 | 2.04% | 2.97% | 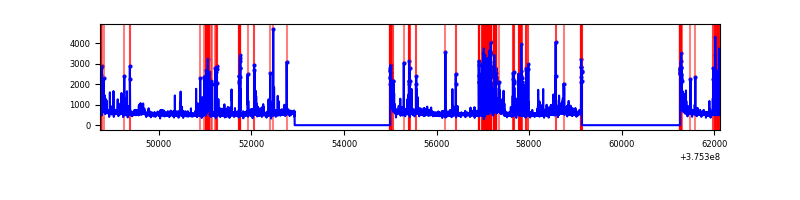 |
| D | 13402 | 9219 | 318 | 318 | 2.37% | 3.45% | 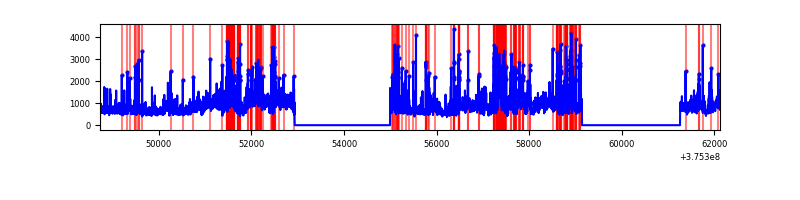 |
Top three noisy pixels from each quadrant. If the there are fewer than three noisy pixels in the level2.evt file, extra rows are filled as -1
| Pixel properties | Quadrant properties | ||||||
|---|---|---|---|---|---|---|---|
| Quadrant | DetID | PixID | Counts | Sigma | Mean | Median | Sigma |
| A | 15 | 169 | 511792 | 2103.29 | 1248 | 1232 | 242.7 |
| A | 13 | 6 | 29126 | 114.91 | 1248 | 1232 | 242.7 |
| A | 12 | 16 | 22054 | 85.78 | 1248 | 1232 | 242.7 |
| B | 5 | 172 | 1585693 | 7149.99 | 1206 | 1181 | 221.6 |
| B | 0 | 219 | 261599 | 1175.12 | 1206 | 1181 | 221.6 |
| B | 5 | 200 | 96158 | 428.58 | 1206 | 1181 | 221.6 |
| C | 1 | 23 | 912784 | 3479.8 | 1163 | 1175 | 262.0 |
| C | 15 | 214 | 393388 | 1497.16 | 1163 | 1175 | 262.0 |
| C | 0 | 10 | 221478 | 840.94 | 1163 | 1175 | 262.0 |
| D | 8 | 195 | 2014926 | 6464.48 | 1180 | 1160 | 311.5 |
| D | 12 | 218 | 702577 | 2251.65 | 1180 | 1160 | 311.5 |
| D | 2 | 249 | 425911 | 1363.51 | 1180 | 1160 | 311.5 |
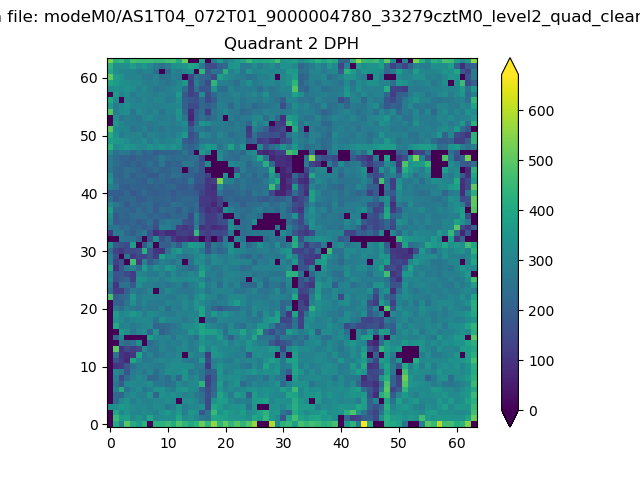
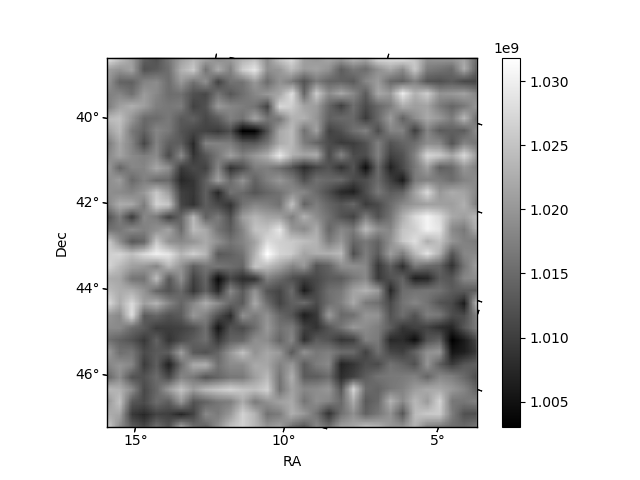
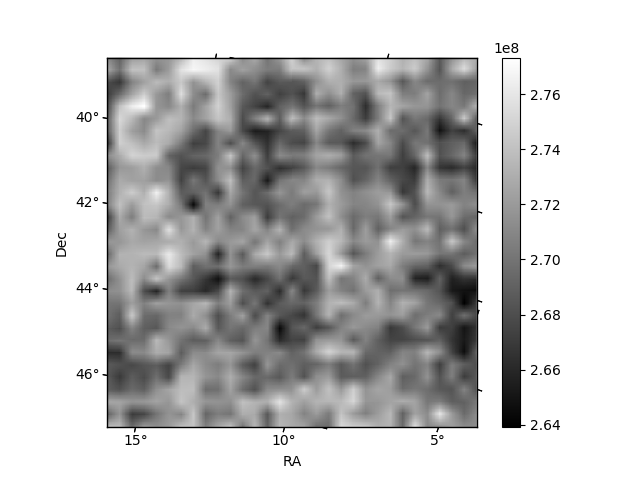
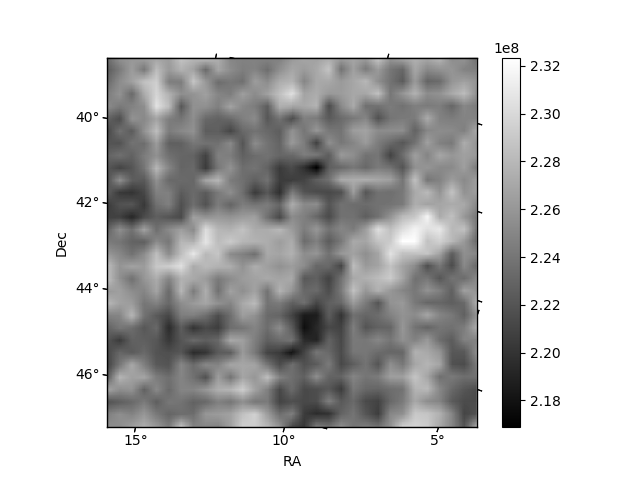
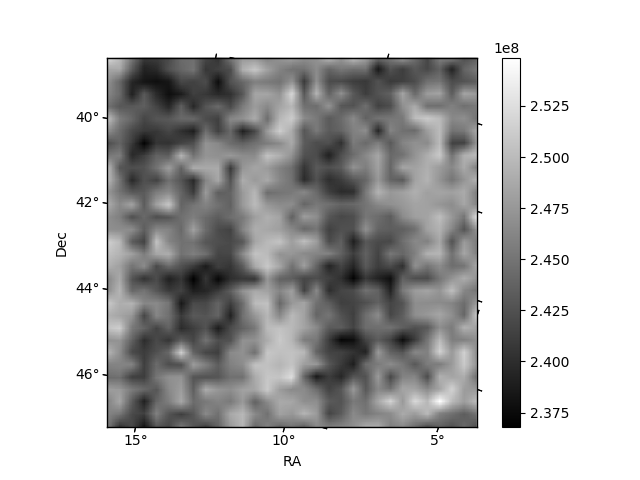
Histogram calculated using DETX and DETY for each event in the final _common_clean file
| Quadrant A | 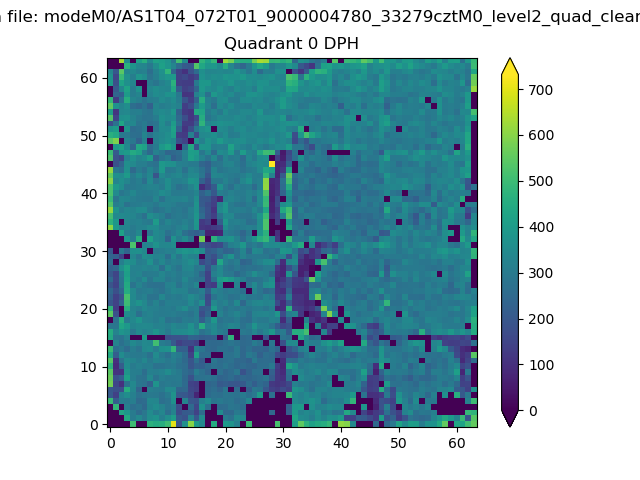 |
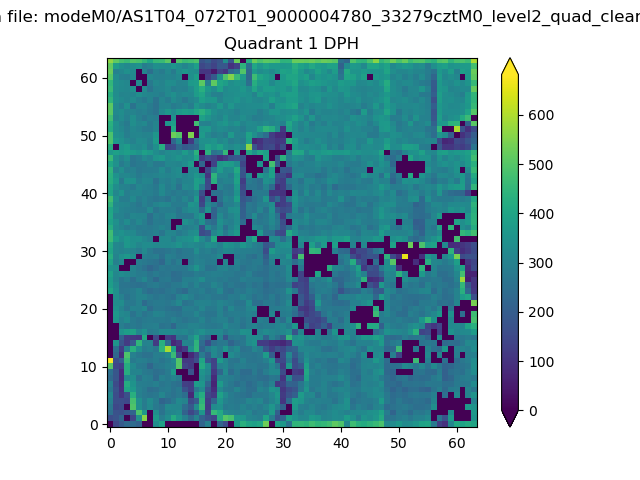 |
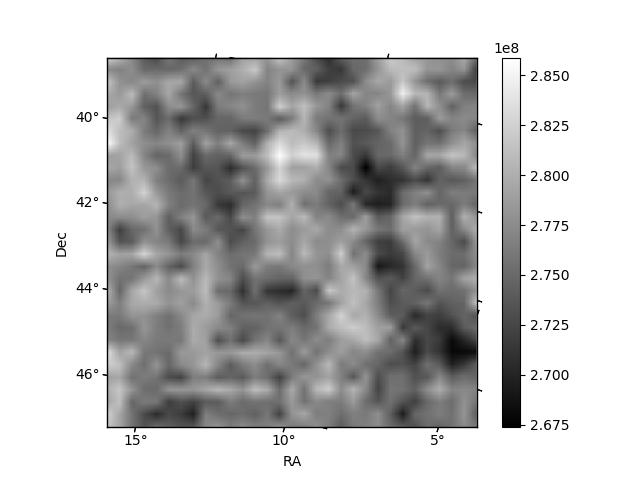
Quadrant B |
|---|---|---|---|
| Quadrant D | 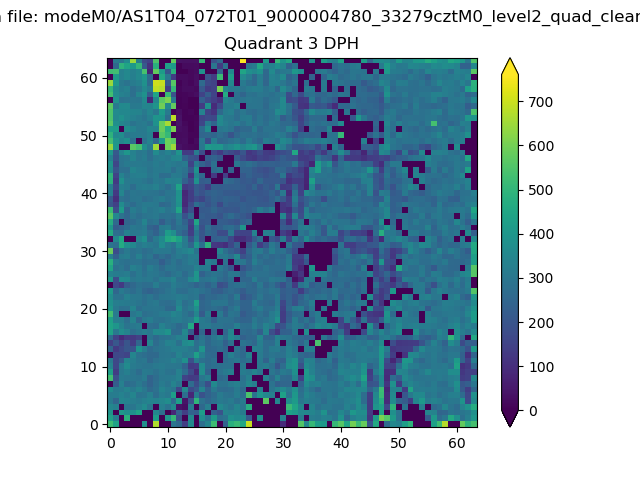 |
 |
Quadrant C |
| Plot type | Count rate plots | Images |
|---|---|---|
| Comparison with Poisson distribution Blue bars denote a histogram of data divided into 1 sec bins. Red curve is a Poisson curve with rate = median count rate of data. |
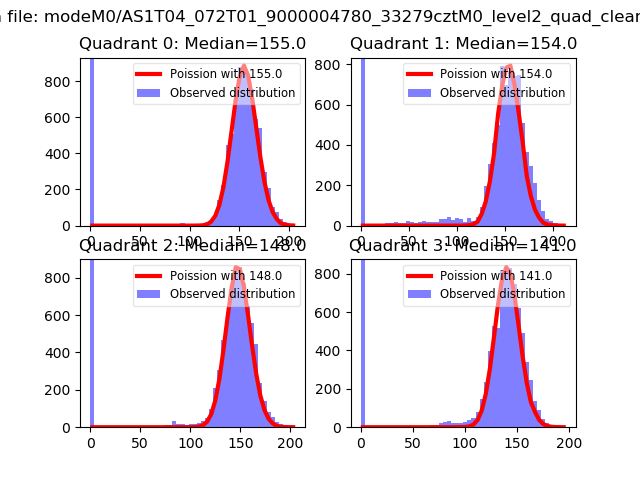 |
 |
| Quadrant-wise count rates Data is divided into 100 sec bins |
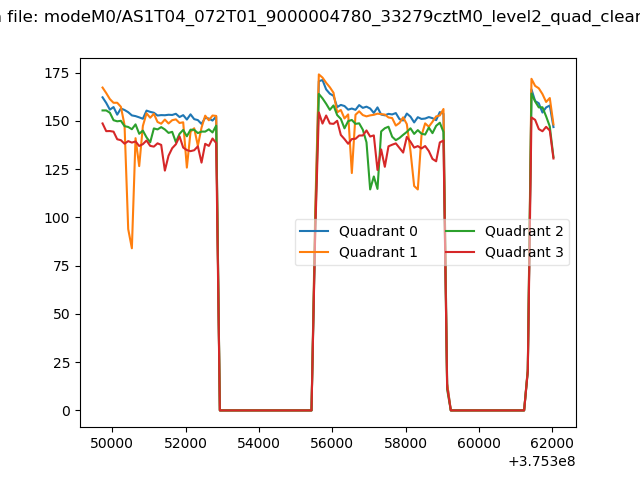 |
|
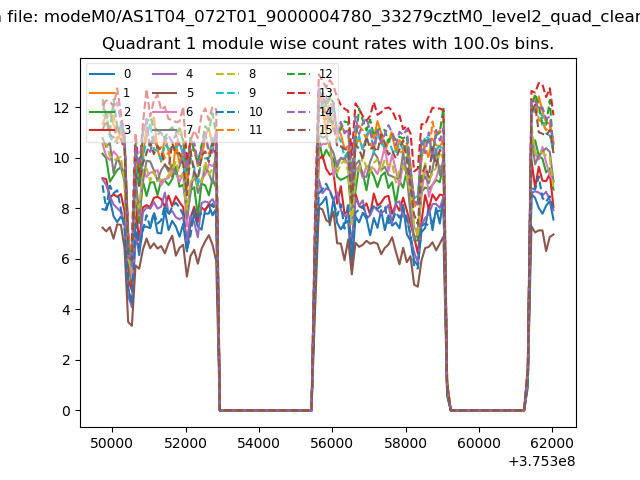
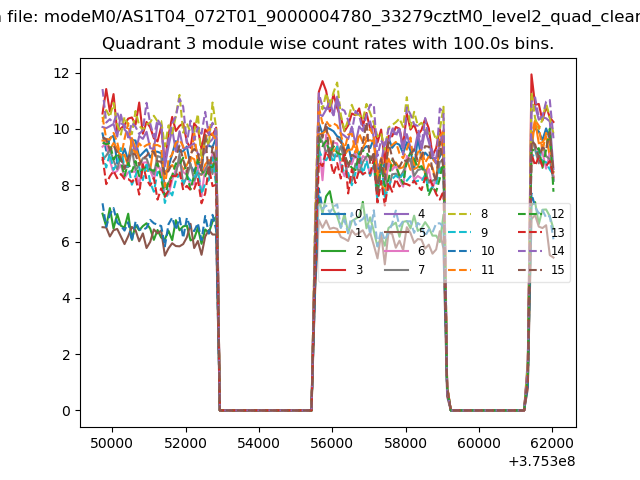
| Module-wise count rates for Quadrant A Data is divided into 100 sec bins |
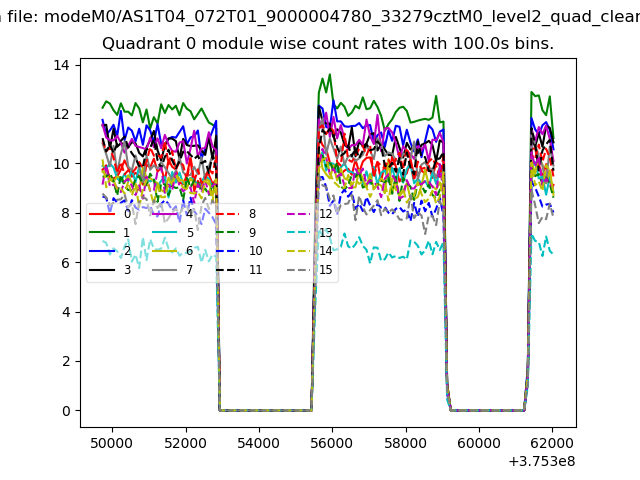 |
 |
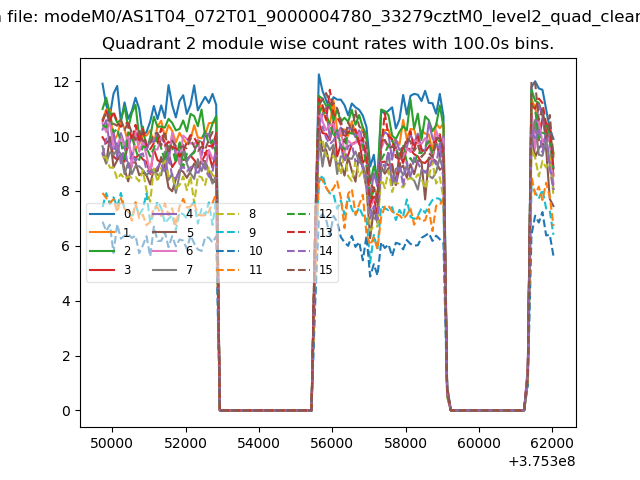
| Module-wise count rates for Quadrant B Data is divided into 100 sec bins |
 |
 |
| Module-wise count rates for Quadrant C Data is divided into 100 sec bins |
 |
 |
| Module-wise count rates for Quadrant D Data is divided into 100 sec bins |
 |
 |
| Parameter | Plot |
|---|---|
| CZT HV Monitor | 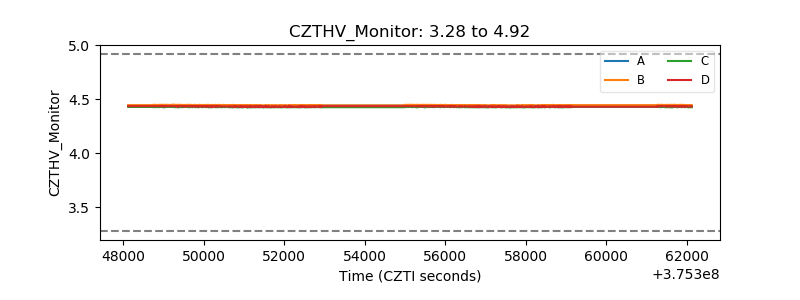 |
| D_VDD | 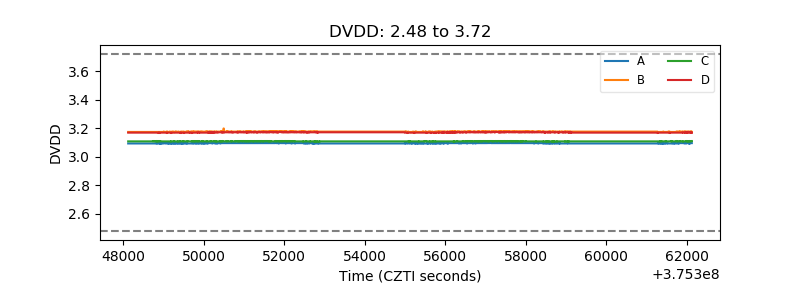 |
| Temperature 1 | 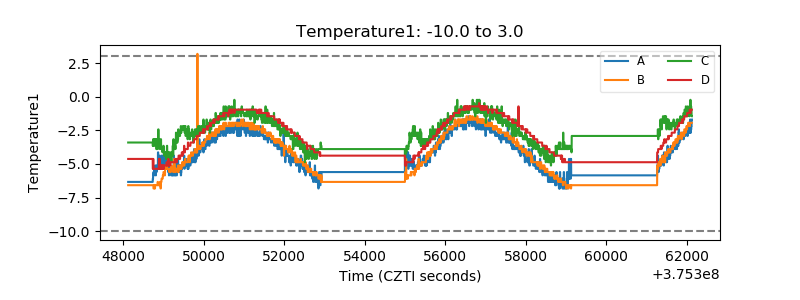 |
| Veto HV Monitor | 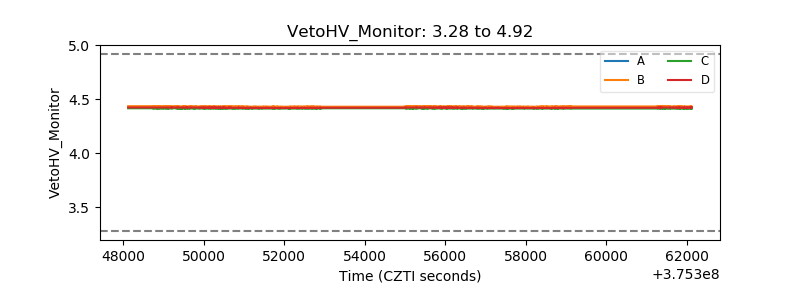 |
| Veto LLD | 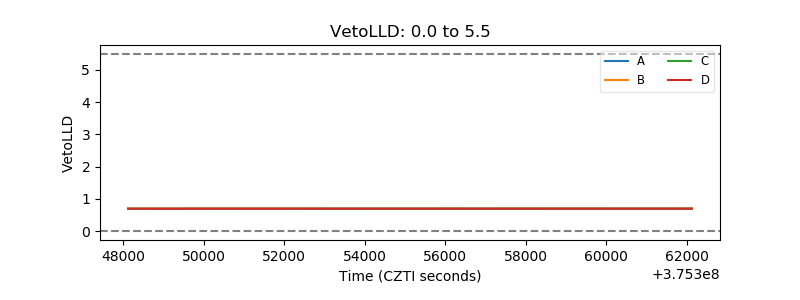 |
| Alpha Counter | 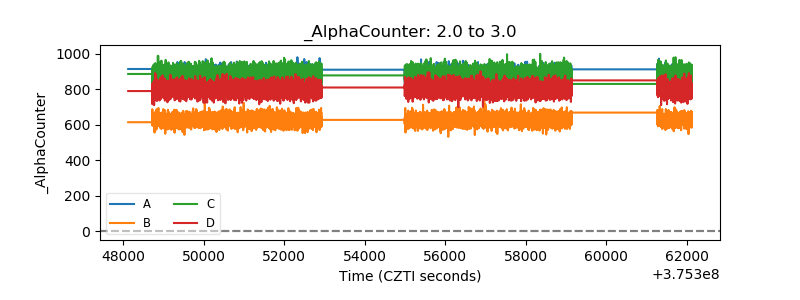 |
| _CPM_Rate | 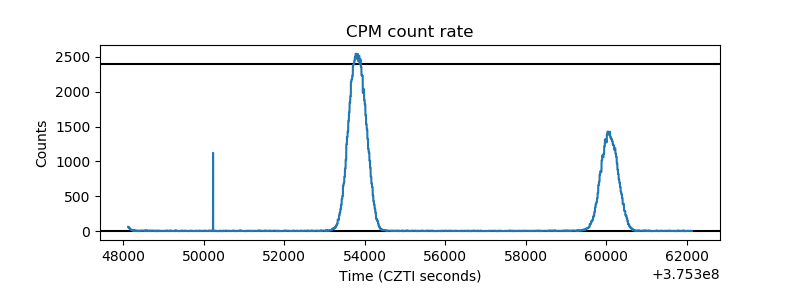 |
| CZT Counter | 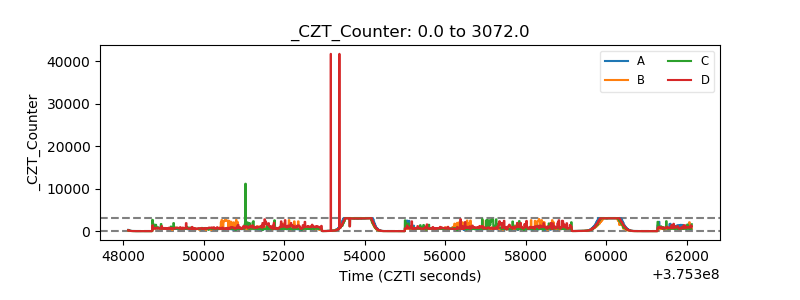 |
| +2.5 Volts monitor | 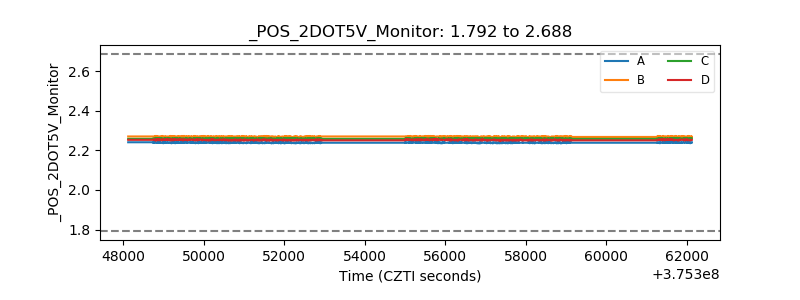 |
| +5 Volts monitor | 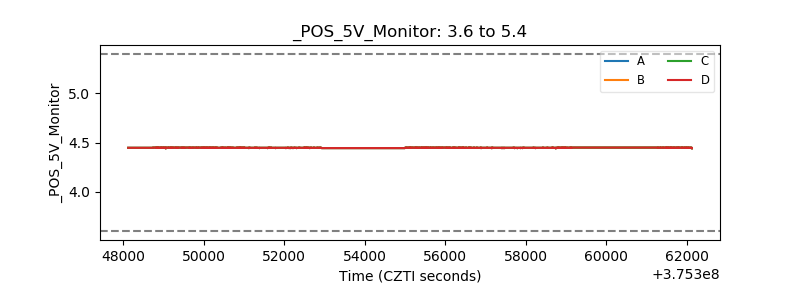 |
| _ROLL_ROT | 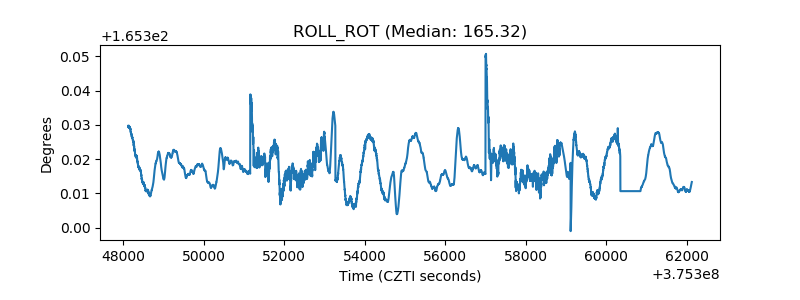 |
| _Roll_DEC |  |
| _Roll_RA | 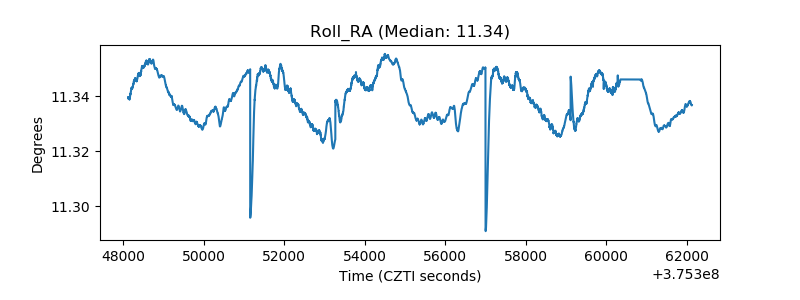 |
| Veto Counter | 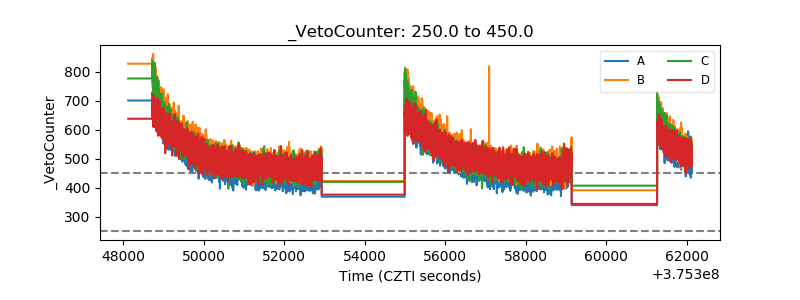 |