| Param | Original file | Final file |
|---|---|---|
| Filename | modeM0/AS1T04_072T01_9000004780_33280cztM0_level2.evt | modeM0/AS1T04_072T01_9000004780_33280cztM0_level2_quad_clean.evt |
| Size (bytes) | 563,454,720 | 95,604,480 |
| Size | 537.4 MB | 91.2 MB |
| Events in quadrant A | 4,672,052 | 641,314 |
| Events in quadrant B | 3,942,433 | 652,904 |
| Events in quadrant C | 3,933,665 | 626,328 |
| Events in quadrant D | 4,183,461 | 628,985 |
| Mode SS | |||
|---|---|---|---|
| Quadrant | BADHDUFLAG | Total packets | Discarded packets |
| A | 0 | 98 | 0 |
| B | 0 | 98 | 0 |
| C | 0 | 98 | 0 |
| D | 0 | 98 | 0 |
| Mode M0 | |||
|---|---|---|---|
| Quadrant | BADHDUFLAG | Total packets | Discarded packets |
| A | 0 | 17148 | 3 |
| B | 0 | 14794 | 2 |
| C | 0 | 14751 | 2 |
| D | 0 | 15859 | 2 |
| Mode M9 | |||
|---|---|---|---|
| Quadrant | BADHDUFLAG | Total packets | Discarded packets |
| A | 0 | 42 | 0 |
| B | 0 | 42 | 0 |
| C | 0 | 42 | 0 |
| D | 0 | 42 | 0 |
| Quadrant | Total seconds | Saturated seconds | Saturation percentage |
|---|---|---|---|
| A | 4932 | 603 | 12.226277% |
| B | 4932 | 424 | 8.596918% |
| C | 4932 | 335 | 6.792376% |
| D | 4932 | 56 | 1.135442% |
Noise dominated data is calculated using 1-second bins in cleaned event files. If a bin has >2000 counts, and if more than 50% of those come from <1% of pixels, then it is considered to be noise-dominated and hence unusable.
| Quadrant | # 1 sec bins | Bins with >0 counts | Bins with >2000 counts | High rate bins dominated by noise | Noise dominated (total time) | Noise dominated (detector-on time) | Marked lightcurve |
|---|---|---|---|---|---|---|---|
| A | 7055 | 4933 | 470 | 470 | 6.66% | 9.53% | 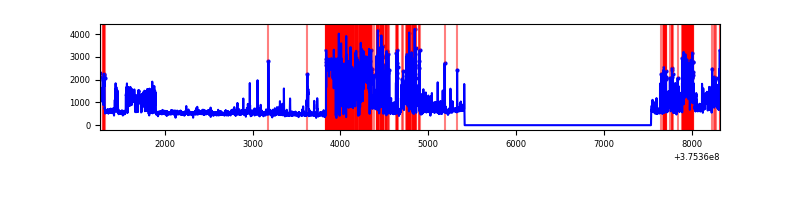 |
| B | 7055 | 4933 | 307 | 307 | 4.35% | 6.22% | 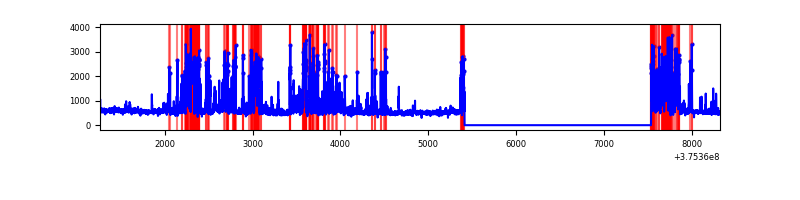 |
| C | 7055 | 4933 | 306 | 306 | 4.34% | 6.20% | 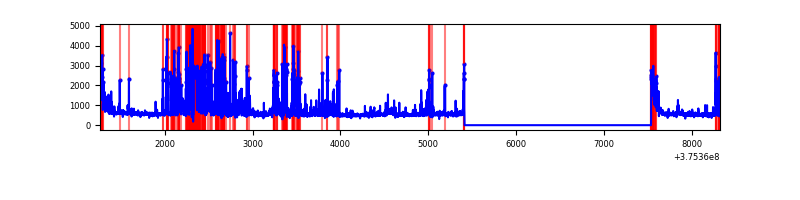 |
| D | 7055 | 4933 | 45 | 45 | 0.64% | 0.91% | 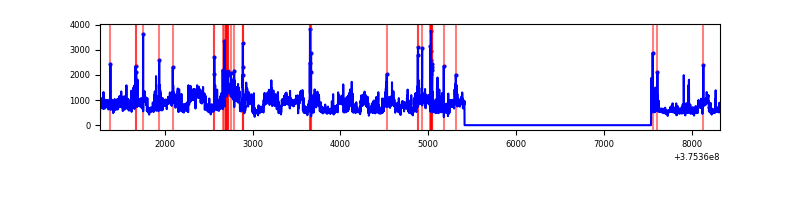 |
Top three noisy pixels from each quadrant. If the there are fewer than three noisy pixels in the level2.evt file, extra rows are filled as -1
| Pixel properties | Quadrant properties | ||||||
|---|---|---|---|---|---|---|---|
| Quadrant | DetID | PixID | Counts | Sigma | Mean | Median | Sigma |
| A | 15 | 169 | 2112857 | 17398.83 | 613 | 603 | 121.4 |
| A | 12 | 16 | 155187 | 1273.32 | 613 | 603 | 121.4 |
| A | 12 | 194 | 26657 | 214.61 | 613 | 603 | 121.4 |
| B | 5 | 172 | 1307869 | 11434.05 | 606 | 593 | 114.3 |
| B | 5 | 200 | 86733 | 753.42 | 606 | 593 | 114.3 |
| B | 0 | 219 | 49367 | 426.6 | 606 | 593 | 114.3 |
| C | 1 | 23 | 1136963 | 8460.7 | 586 | 592 | 134.3 |
| C | 15 | 214 | 210544 | 1563.17 | 586 | 592 | 134.3 |
| C | 0 | 10 | 195835 | 1453.66 | 586 | 592 | 134.3 |
| D | 8 | 195 | 1300914 | 8059.38 | 611 | 600 | 161.3 |
| D | 7 | 223 | 107715 | 663.9 | 611 | 600 | 161.3 |
| D | 2 | 249 | 105863 | 652.42 | 611 | 600 | 161.3 |
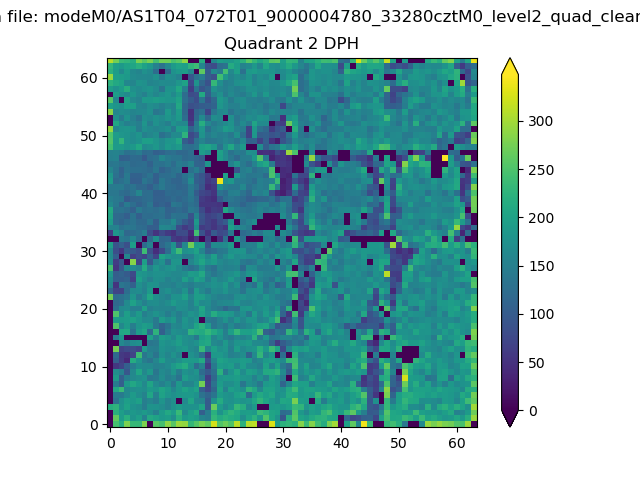
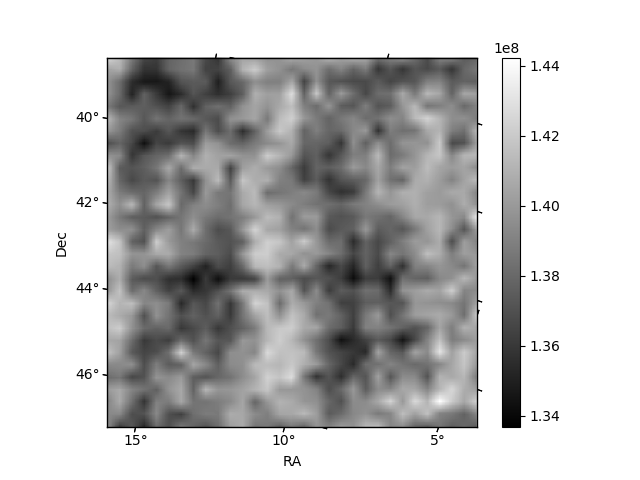
Histogram calculated using DETX and DETY for each event in the final _common_clean file
| Quadrant A | 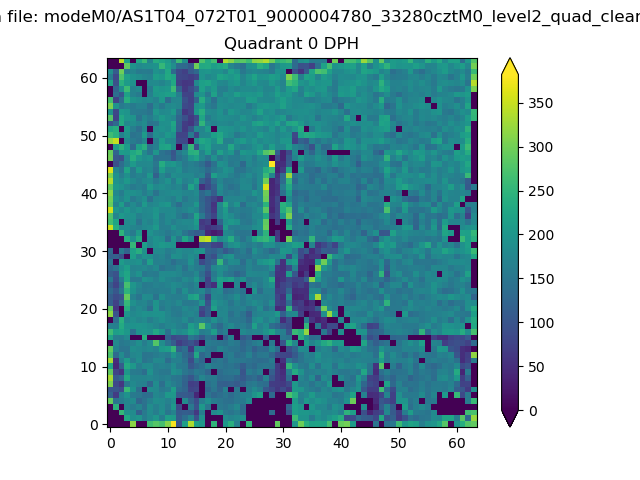 |
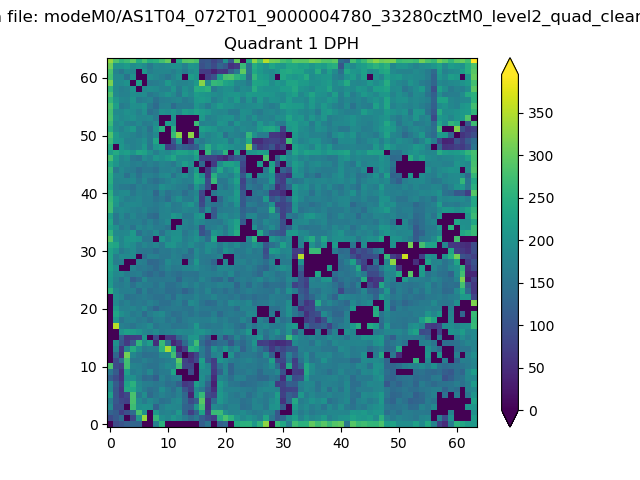 |
Quadrant B |
|---|---|---|---|
| Quadrant D | 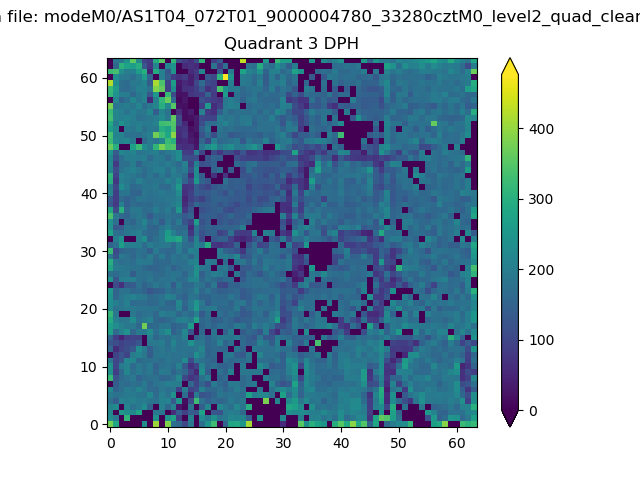 |
 |
Quadrant C |
| Plot type | Count rate plots | Images |
|---|---|---|
| Comparison with Poisson distribution Blue bars denote a histogram of data divided into 1 sec bins. Red curve is a Poisson curve with rate = median count rate of data. |
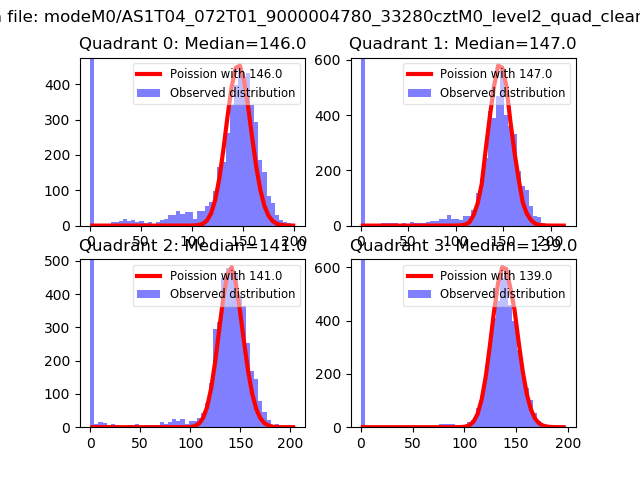 |
 |
| Quadrant-wise count rates Data is divided into 100 sec bins |
 |
|
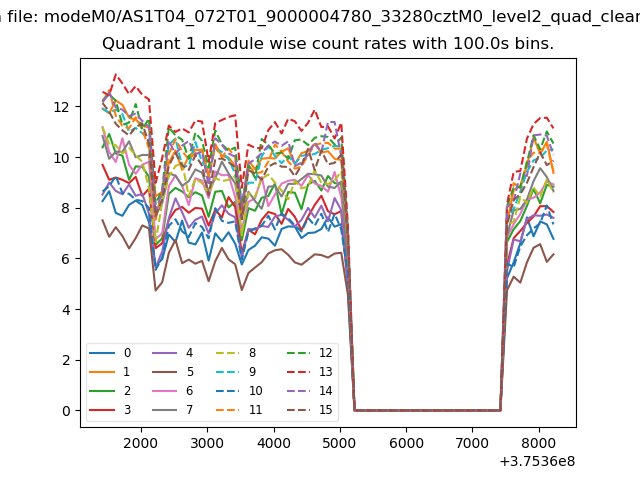
| Module-wise count rates for Quadrant A Data is divided into 100 sec bins |
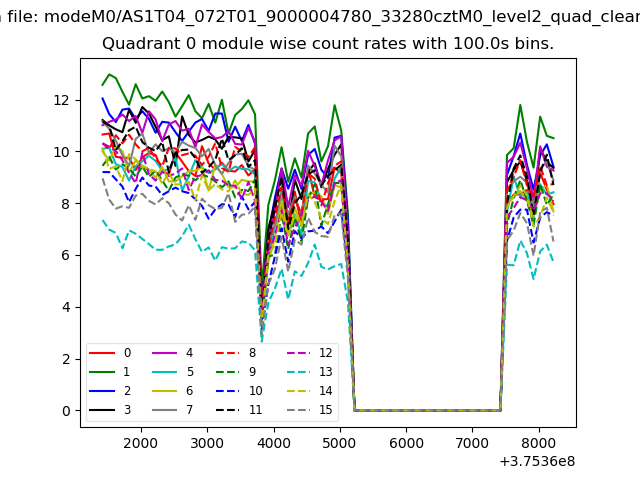 |
 |
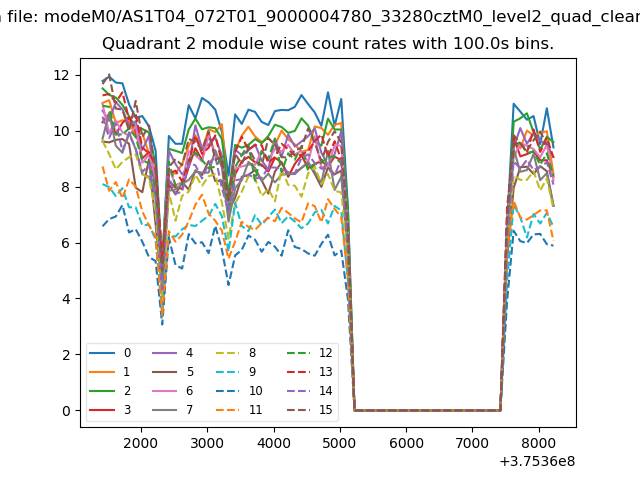
| Module-wise count rates for Quadrant B Data is divided into 100 sec bins |
 |
 |
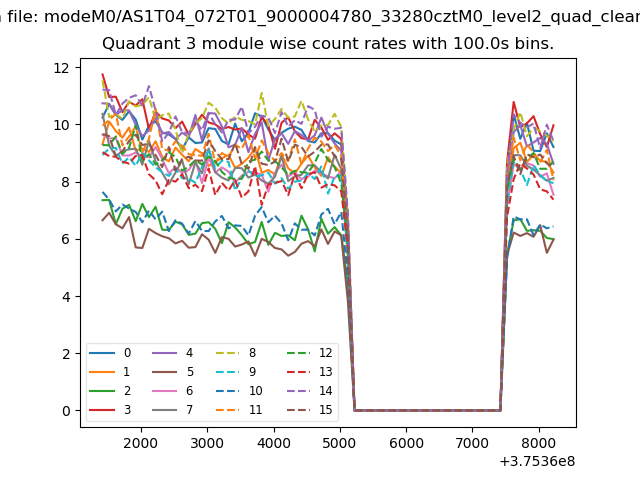
| Module-wise count rates for Quadrant C Data is divided into 100 sec bins |
 |
 |
| Module-wise count rates for Quadrant D Data is divided into 100 sec bins |
 |
 |
| Parameter | Plot |
|---|---|
| CZT HV Monitor | 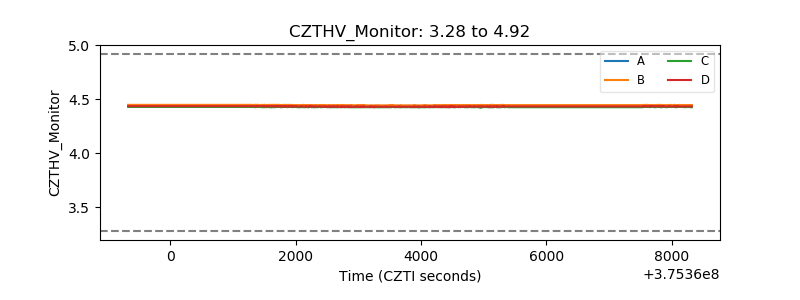 |
| D_VDD | 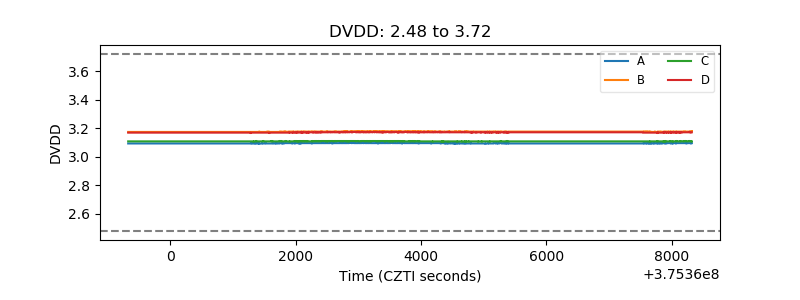 |
| Temperature 1 | 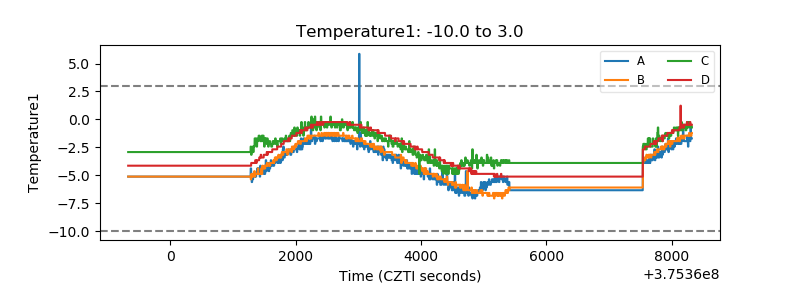 |
| Veto HV Monitor | 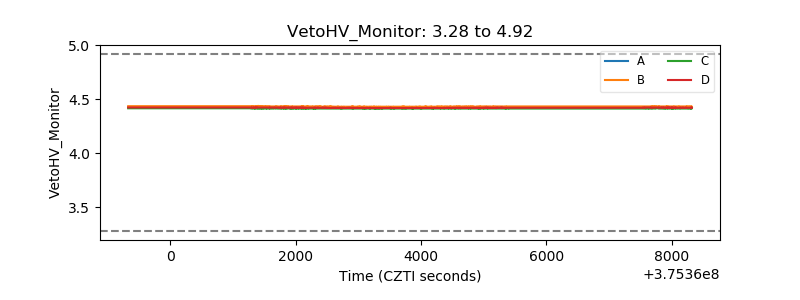 |
| Veto LLD |  |
| Alpha Counter | 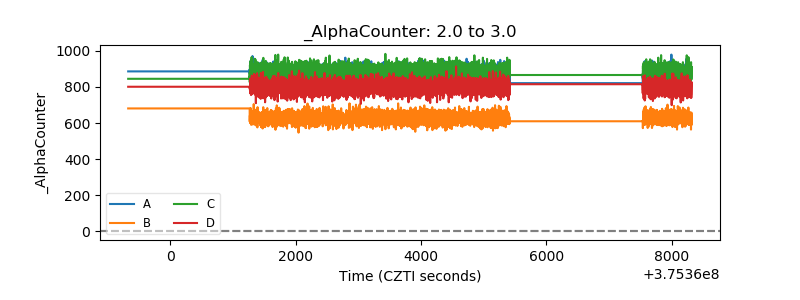 |
| _CPM_Rate |  |
| CZT Counter | 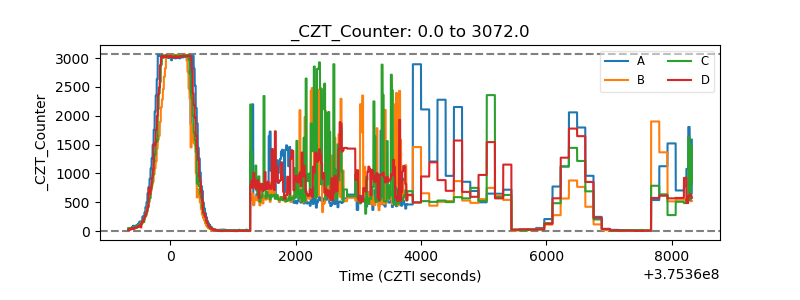 |
| +2.5 Volts monitor |  |
| +5 Volts monitor |  |
| _ROLL_ROT | 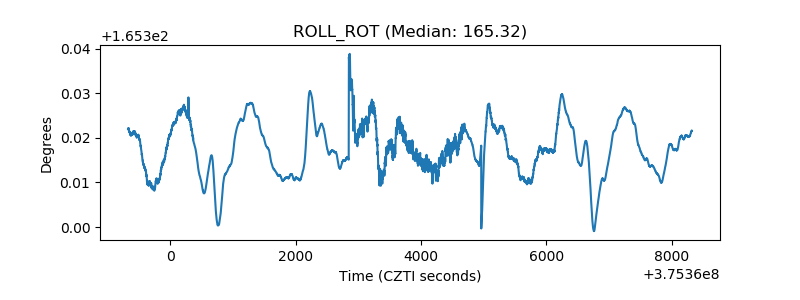 |
| _Roll_DEC | 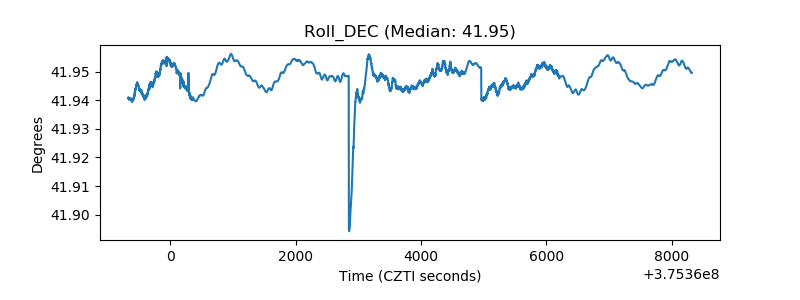 |
| _Roll_RA | 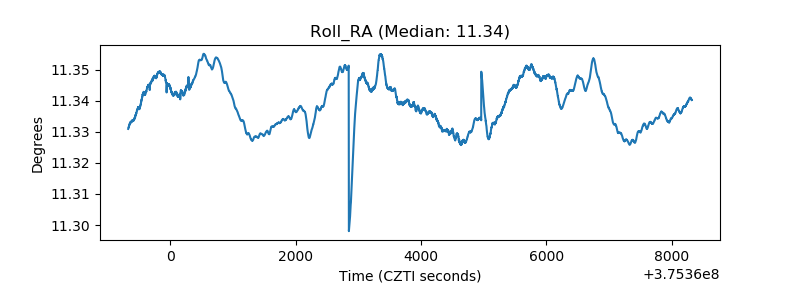 |
| Veto Counter | 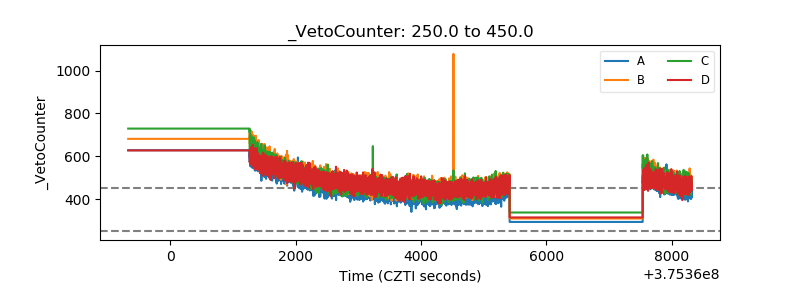 |