| Param | Original file | Final file |
|---|---|---|
| Filename | modeM0/AS1T04_072T01_9000004780_33281cztM0_level2.evt | modeM0/AS1T04_072T01_9000004780_33281cztM0_level2_quad_clean.evt |
| Size (bytes) | 596,255,040 | 89,568,000 |
| Size | 568.6 MB | 85.4 MB |
| Events in quadrant A | 4,600,542 | 586,711 |
| Events in quadrant B | 3,947,934 | 604,100 |
| Events in quadrant C | 4,286,753 | 573,646 |
| Events in quadrant D | 4,863,959 | 575,828 |
| Mode SS | |||
|---|---|---|---|
| Quadrant | BADHDUFLAG | Total packets | Discarded packets |
| A | 0 | 108 | 0 |
| B | 0 | 108 | 0 |
| C | 0 | 108 | 0 |
| D | 0 | 108 | 0 |
| Mode M0 | |||
|---|---|---|---|
| Quadrant | BADHDUFLAG | Total packets | Discarded packets |
| A | 0 | 17067 | 3 |
| B | 0 | 15144 | 2 |
| C | 0 | 16021 | 2 |
| D | 0 | 18257 | 2 |
| Mode M9 | |||
|---|---|---|---|
| Quadrant | BADHDUFLAG | Total packets | Discarded packets |
| A | 0 | 19 | 0 |
| B | 0 | 19 | 0 |
| C | 0 | 19 | 0 |
| D | 0 | 19 | 0 |
| Quadrant | Total seconds | Saturated seconds | Saturation percentage |
|---|---|---|---|
| A | 5307 | 605 | 11.400038% |
| B | 5307 | 317 | 5.973243% |
| C | 5307 | 413 | 7.782174% |
| D | 5308 | 155 | 2.920121% |
Noise dominated data is calculated using 1-second bins in cleaned event files. If a bin has >2000 counts, and if more than 50% of those come from <1% of pixels, then it is considered to be noise-dominated and hence unusable.
| Quadrant | # 1 sec bins | Bins with >0 counts | Bins with >2000 counts | High rate bins dominated by noise | Noise dominated (total time) | Noise dominated (detector-on time) | Marked lightcurve |
|---|---|---|---|---|---|---|---|
| A | 7280 | 5308 | 364 | 364 | 5.00% | 6.86% | 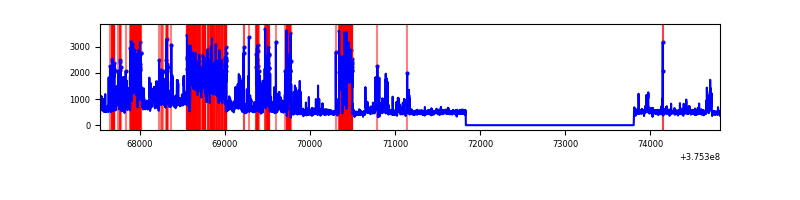 |
| B | 7280 | 5307 | 216 | 216 | 2.97% | 4.07% | 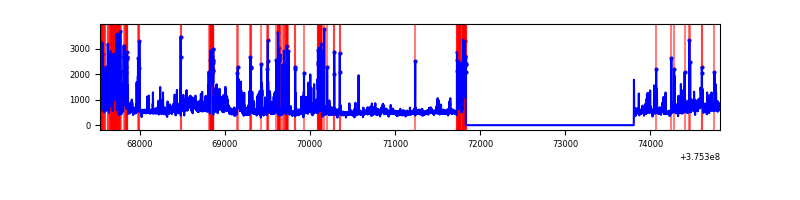 |
| C | 7280 | 5308 | 379 | 379 | 5.21% | 7.14% | 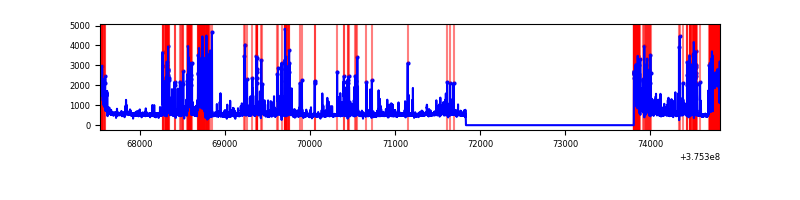 |
| D | 7281 | 5309 | 120 | 120 | 1.65% | 2.26% | 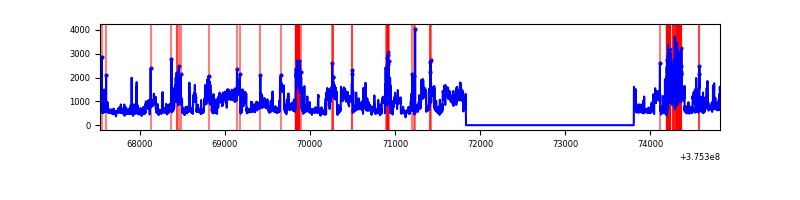 |
Top three noisy pixels from each quadrant. If the there are fewer than three noisy pixels in the level2.evt file, extra rows are filled as -1
| Pixel properties | Quadrant properties | ||||||
|---|---|---|---|---|---|---|---|
| Quadrant | DetID | PixID | Counts | Sigma | Mean | Median | Sigma |
| A | 15 | 169 | 1930036 | 15621.85 | 621 | 610 | 123.5 |
| A | 12 | 16 | 224405 | 1811.99 | 621 | 610 | 123.5 |
| A | 12 | 194 | 37022 | 294.81 | 621 | 610 | 123.5 |
| B | 5 | 172 | 945096 | 7985.59 | 624 | 610 | 118.3 |
| B | 0 | 219 | 282895 | 2386.71 | 624 | 610 | 118.3 |
| B | 0 | 190 | 65425 | 548.01 | 624 | 610 | 118.3 |
| C | 1 | 23 | 1133473 | 8203.74 | 602 | 608 | 138.1 |
| C | 10 | 49 | 273320 | 1974.87 | 602 | 608 | 138.1 |
| C | 15 | 214 | 224498 | 1621.32 | 602 | 608 | 138.1 |
| D | 8 | 195 | 1859438 | 11354.49 | 618 | 604 | 163.7 |
| D | 12 | 218 | 200068 | 1218.4 | 618 | 604 | 163.7 |
| D | 12 | 6 | 52596 | 317.59 | 618 | 604 | 163.7 |
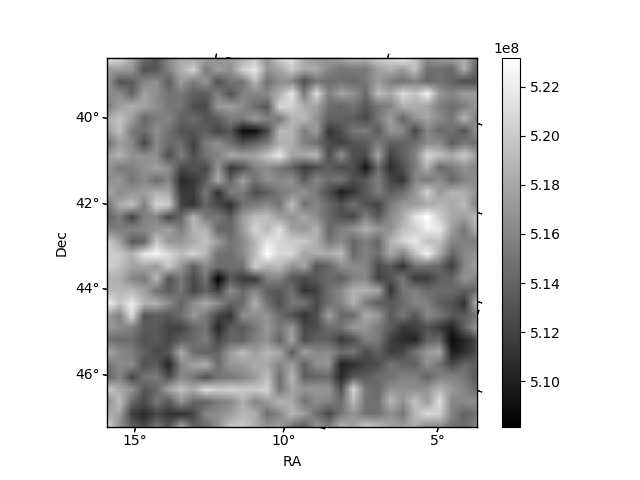
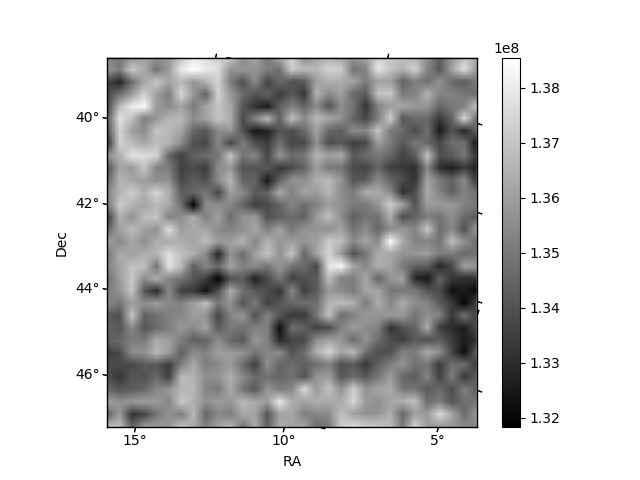
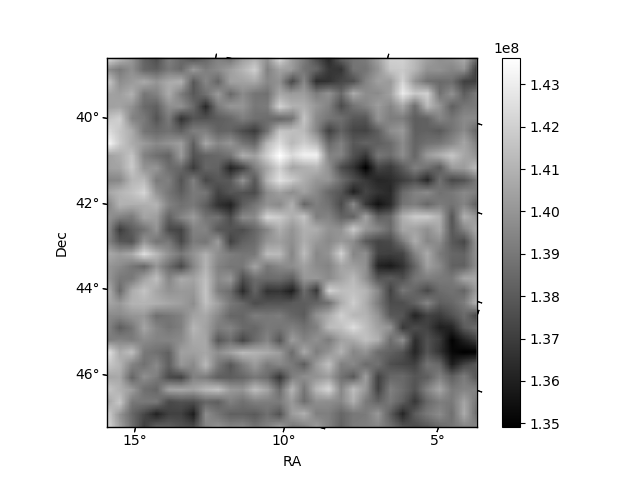
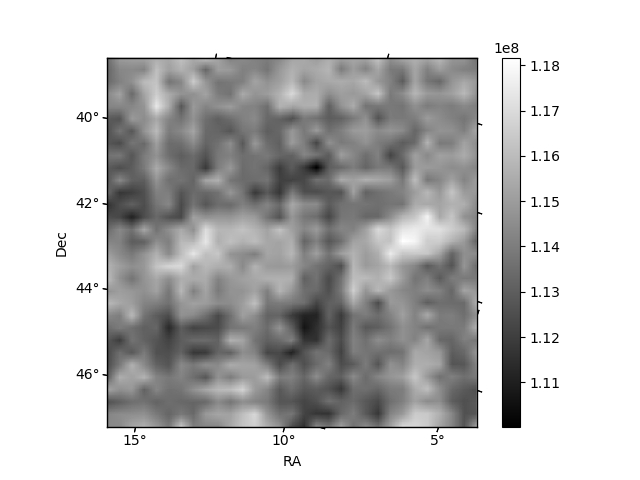
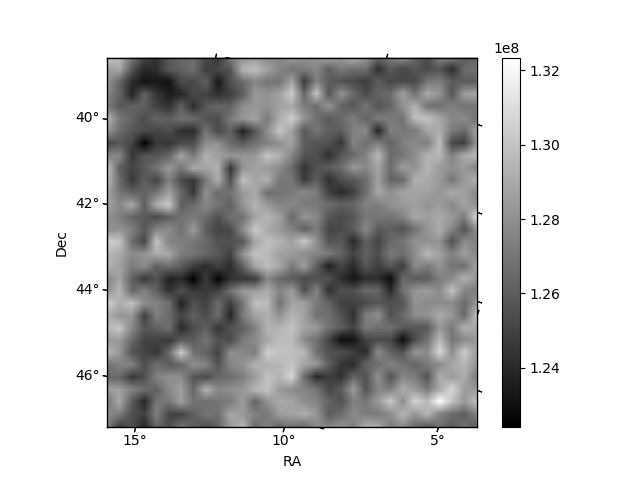
Histogram calculated using DETX and DETY for each event in the final _common_clean file
| Quadrant A |  |
 |
Quadrant B |
|---|---|---|---|
| Quadrant D |  |
 |
Quadrant C |
| Plot type | Count rate plots | Images |
|---|---|---|
| Comparison with Poisson distribution Blue bars denote a histogram of data divided into 1 sec bins. Red curve is a Poisson curve with rate = median count rate of data. |
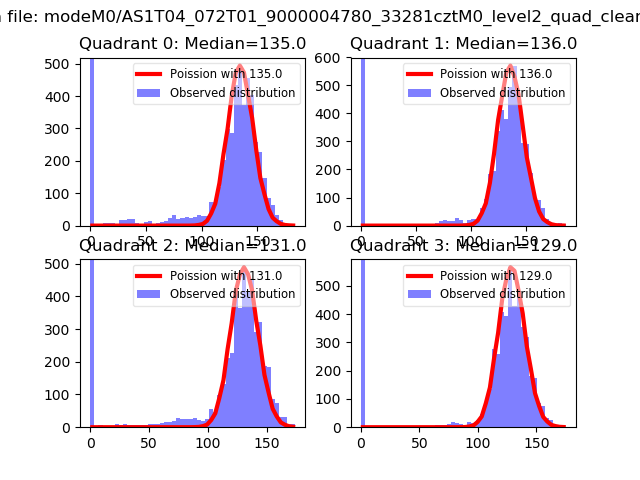 |
 |
| Quadrant-wise count rates Data is divided into 100 sec bins |
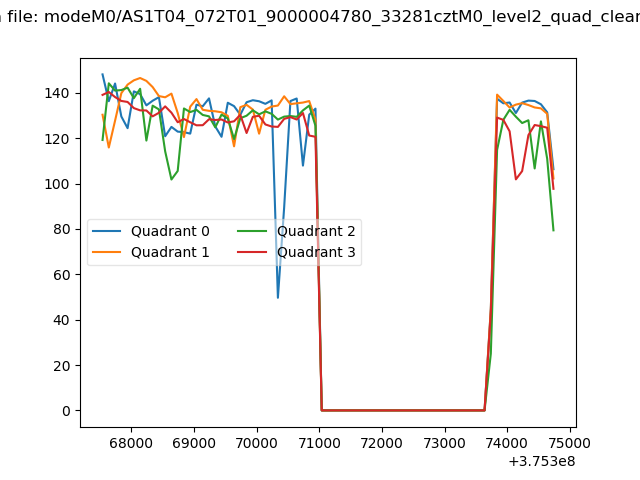 |
|
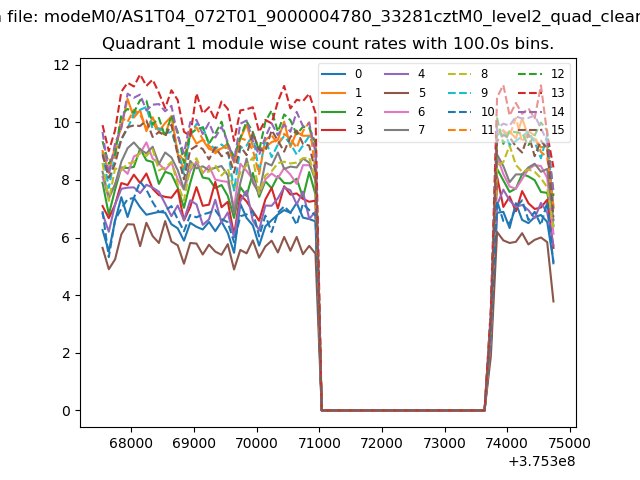
| Module-wise count rates for Quadrant A Data is divided into 100 sec bins |
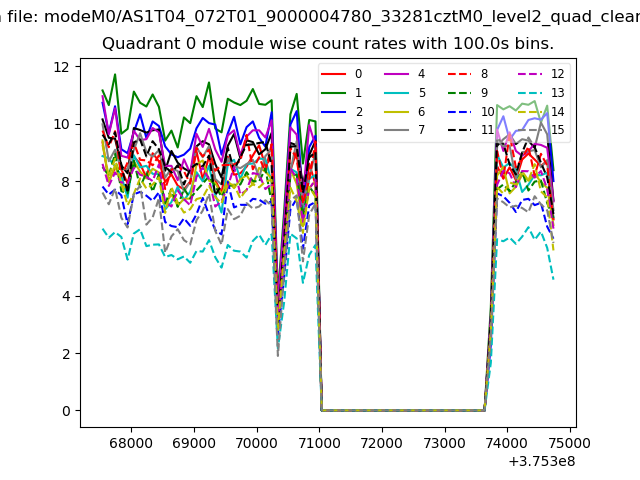 |
 |
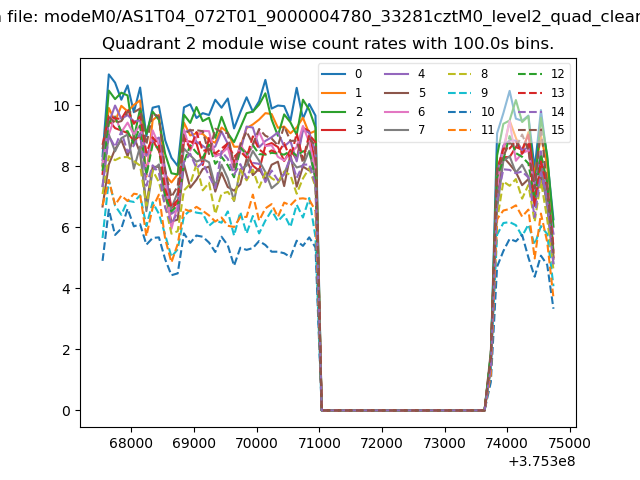
| Module-wise count rates for Quadrant B Data is divided into 100 sec bins |
 |
 |
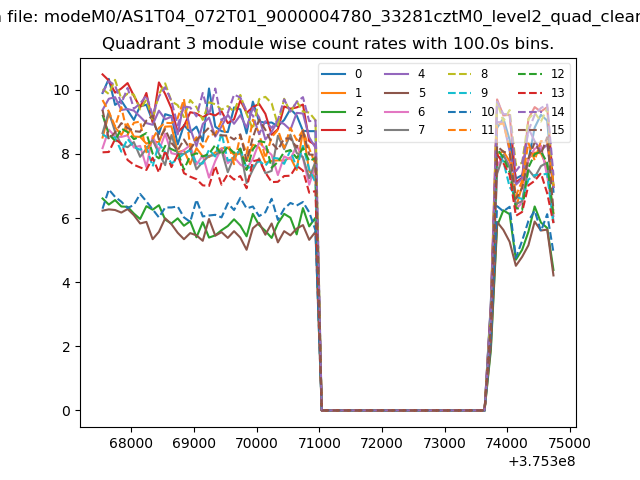
| Module-wise count rates for Quadrant C Data is divided into 100 sec bins |
 |
 |
| Module-wise count rates for Quadrant D Data is divided into 100 sec bins |
 |
 |
| Parameter | Plot |
|---|---|
| CZT HV Monitor | 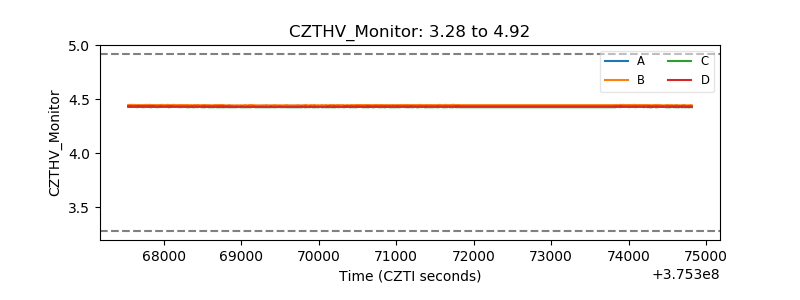 |
| D_VDD | 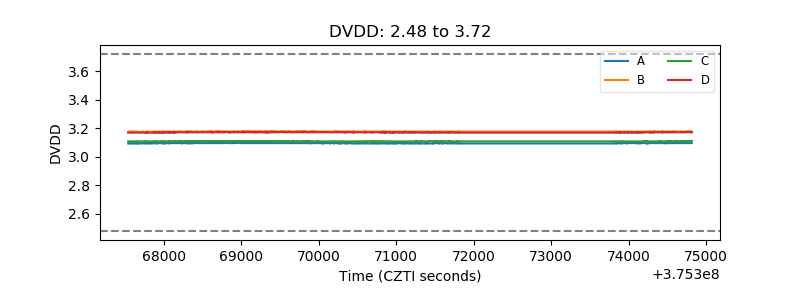 |
| Temperature 1 | 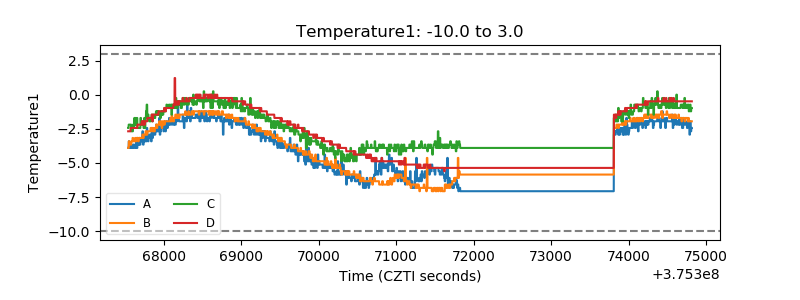 |
| Veto HV Monitor | 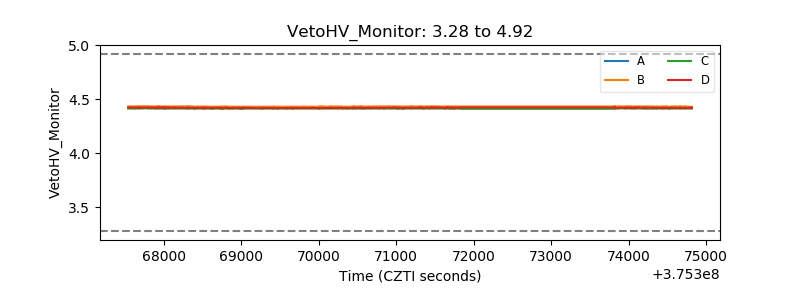 |
| Veto LLD | 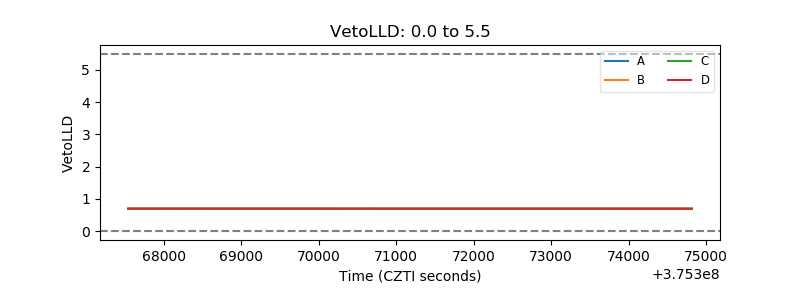 |
| Alpha Counter | 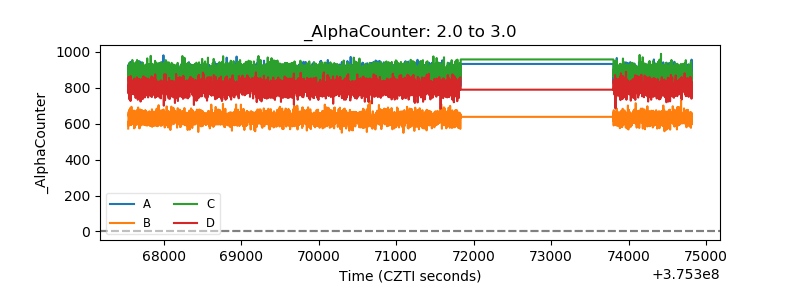 |
| _CPM_Rate | 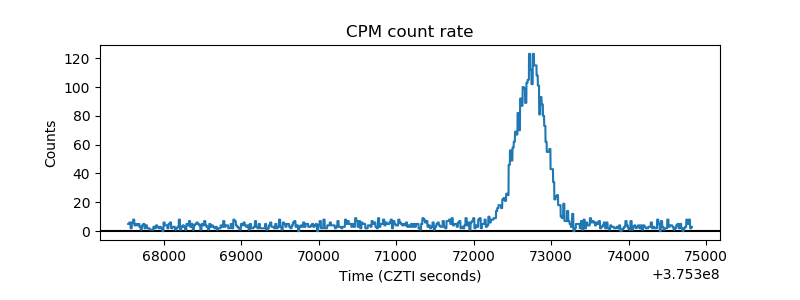 |
| CZT Counter | 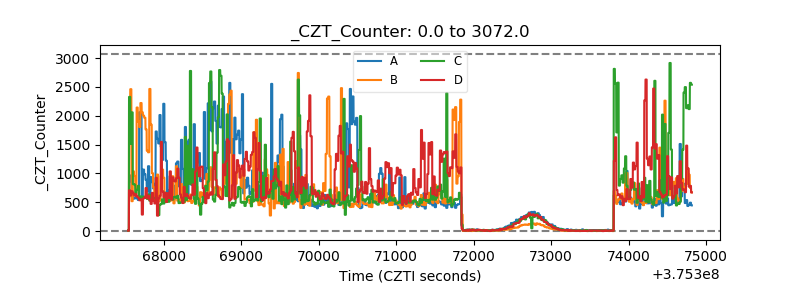 |
| +2.5 Volts monitor |  |
| +5 Volts monitor | 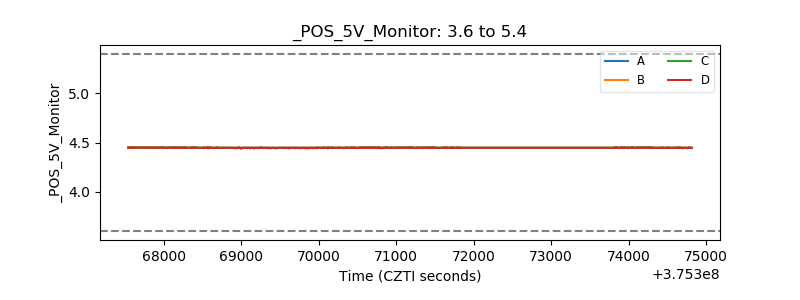 |
| _ROLL_ROT | 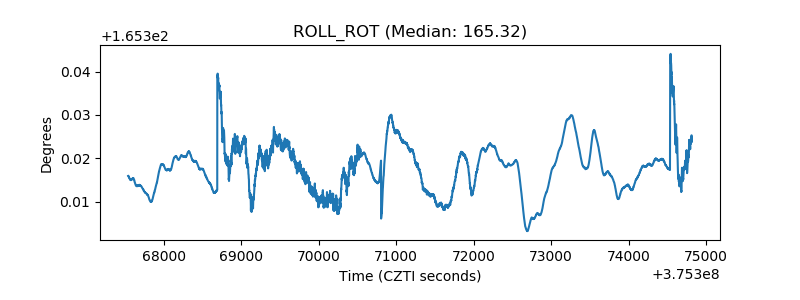 |
| _Roll_DEC | 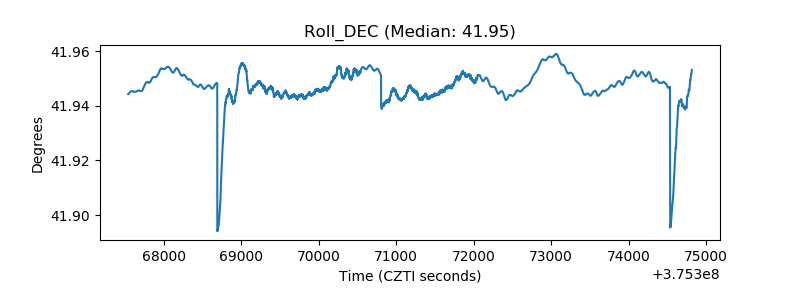 |
| _Roll_RA | 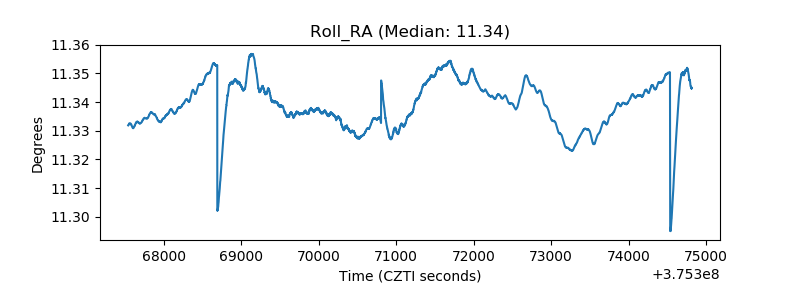 |
| Veto Counter | 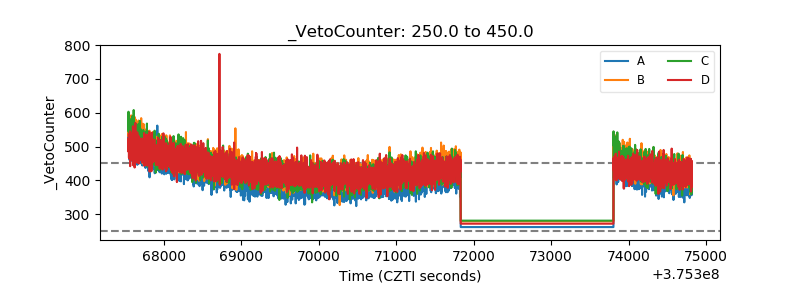 |