| Param | Original file | Final file |
|---|---|---|
| Filename | modeM0/AS1T04_072T01_9000004780_33282cztM0_level2.evt | modeM0/AS1T04_072T01_9000004780_33282cztM0_level2_quad_clean.evt |
| Size (bytes) | 581,774,400 | 76,942,080 |
| Size | 554.8 MB | 73.4 MB |
| Events in quadrant A | 2,663,289 | 521,753 |
| Events in quadrant B | 4,513,390 | 478,534 |
| Events in quadrant C | 4,746,167 | 464,396 |
| Events in quadrant D | 5,323,197 | 478,488 |
| Mode SS | |||
|---|---|---|---|
| Quadrant | BADHDUFLAG | Total packets | Discarded packets |
| A | 0 | 114 | 0 |
| B | 0 | 114 | 0 |
| C | 0 | 114 | 0 |
| D | 0 | 114 | 0 |
| Mode M0 | |||
|---|---|---|---|
| Quadrant | BADHDUFLAG | Total packets | Discarded packets |
| A | 0 | 11504 | 3 |
| B | 0 | 16991 | 2 |
| C | 0 | 17539 | 2 |
| D | 0 | 19801 | 2 |
| Mode M9 | |||
|---|---|---|---|
| Quadrant | BADHDUFLAG | Total packets | Discarded packets |
| A | 0 | 17 | 0 |
| B | 0 | 17 | 0 |
| C | 0 | 17 | 0 |
| D | 0 | 18 | 0 |
| Quadrant | Total seconds | Saturated seconds | Saturation percentage |
|---|---|---|---|
| A | 5513 | 22 | 0.399057% |
| B | 5513 | 533 | 9.668057% |
| C | 5513 | 641 | 11.627063% |
| D | 5513 | 218 | 3.954290% |
Noise dominated data is calculated using 1-second bins in cleaned event files. If a bin has >2000 counts, and if more than 50% of those come from <1% of pixels, then it is considered to be noise-dominated and hence unusable.
| Quadrant | # 1 sec bins | Bins with >0 counts | Bins with >2000 counts | High rate bins dominated by noise | Noise dominated (total time) | Noise dominated (detector-on time) | Marked lightcurve |
|---|---|---|---|---|---|---|---|
| A | 7156 | 5514 | 5 | 5 | 0.07% | 0.09% | 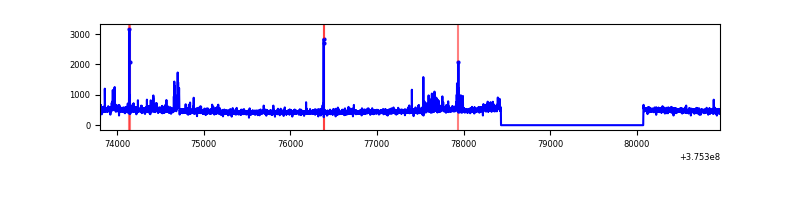 |
| B | 7156 | 5514 | 407 | 407 | 5.69% | 7.38% | 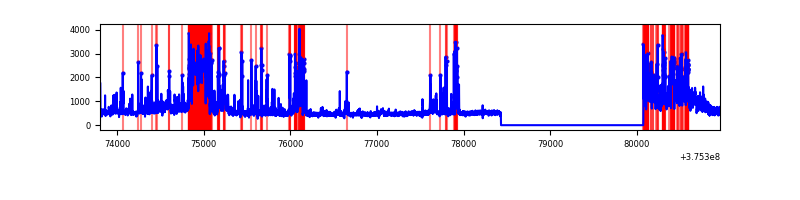 |
| C | 7156 | 5514 | 575 | 575 | 8.04% | 10.43% | 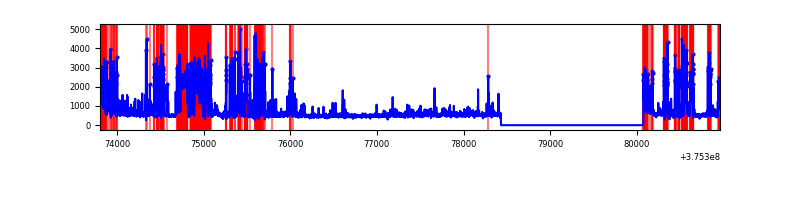 |
| D | 7156 | 5514 | 186 | 186 | 2.60% | 3.37% | 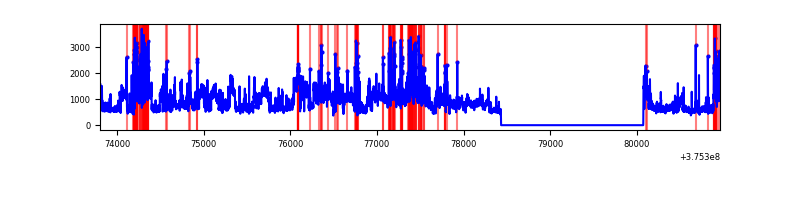 |
Top three noisy pixels from each quadrant. If the there are fewer than three noisy pixels in the level2.evt file, extra rows are filled as -1
| Pixel properties | Quadrant properties | ||||||
|---|---|---|---|---|---|---|---|
| Quadrant | DetID | PixID | Counts | Sigma | Mean | Median | Sigma |
| A | 12 | 16 | 73012 | 558.65 | 648 | 637 | 129.6 |
| A | 15 | 169 | 48851 | 372.16 | 648 | 637 | 129.6 |
| A | 12 | 194 | 15183 | 112.28 | 648 | 637 | 129.6 |
| B | 5 | 172 | 1313142 | 11250.4 | 615 | 600 | 116.7 |
| B | 0 | 219 | 486597 | 4165.7 | 615 | 600 | 116.7 |
| B | 0 | 245 | 73724 | 626.78 | 615 | 600 | 116.7 |
| C | 1 | 23 | 1685393 | 12194.73 | 598 | 604 | 138.2 |
| C | 10 | 49 | 239899 | 1732.05 | 598 | 604 | 138.2 |
| C | 15 | 214 | 226635 | 1636.04 | 598 | 604 | 138.2 |
| D | 8 | 195 | 1889232 | 11322.97 | 623 | 608 | 166.8 |
| D | 12 | 218 | 218924 | 1308.88 | 623 | 608 | 166.8 |
| D | 12 | 6 | 200730 | 1199.8 | 623 | 608 | 166.8 |
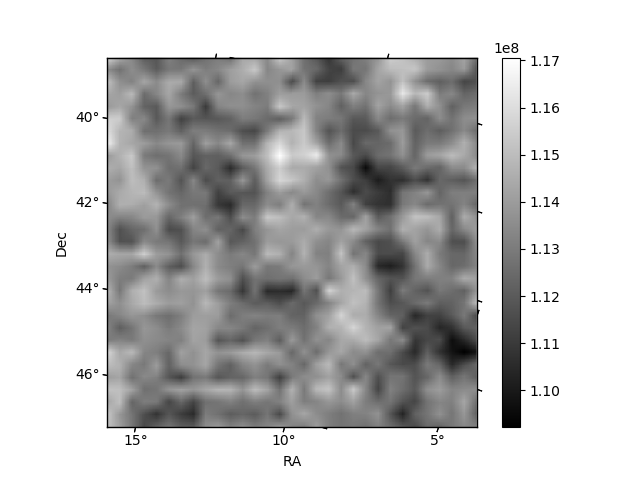
Histogram calculated using DETX and DETY for each event in the final _common_clean file
| Quadrant A | 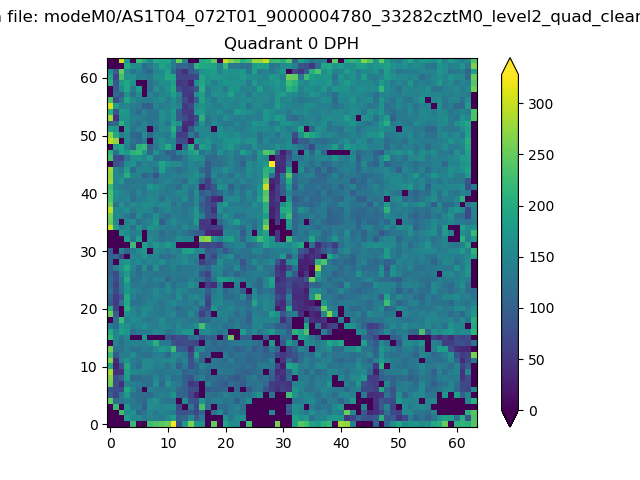 |
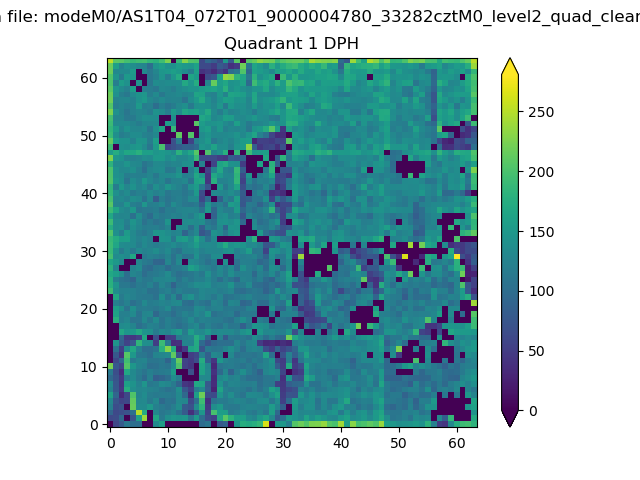 |
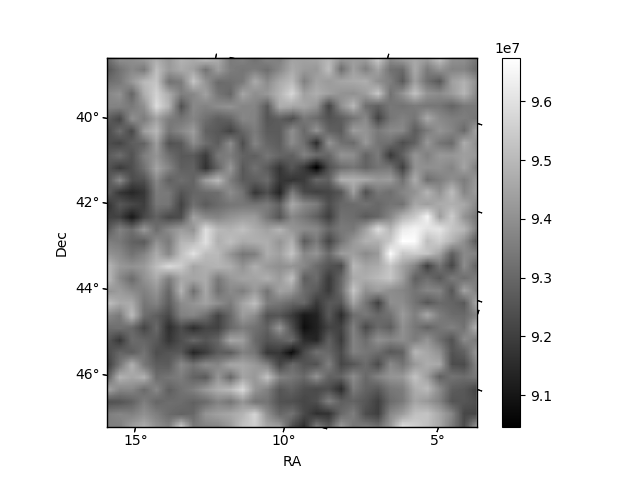
Quadrant B |
|---|---|---|---|
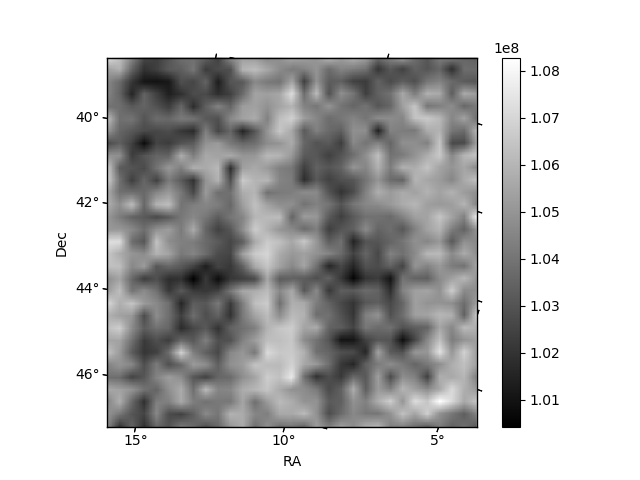
| Quadrant D | 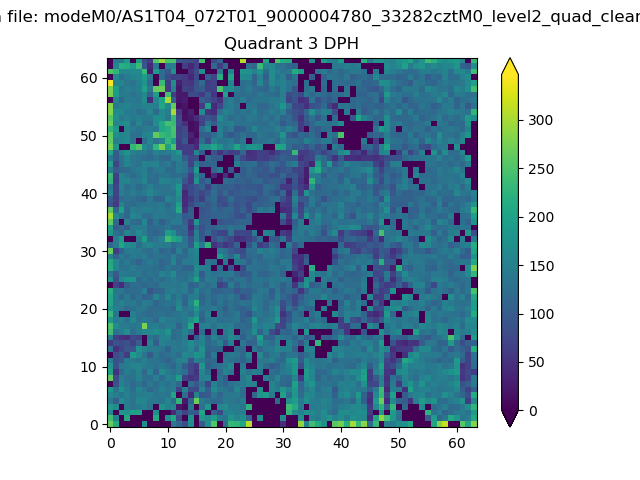 |
 |
Quadrant C |
| Plot type | Count rate plots | Images |
|---|---|---|
| Comparison with Poisson distribution Blue bars denote a histogram of data divided into 1 sec bins. Red curve is a Poisson curve with rate = median count rate of data. |
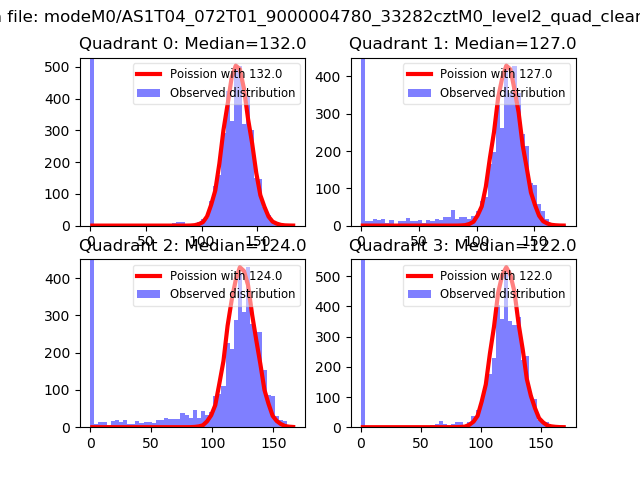 |
 |
| Quadrant-wise count rates Data is divided into 100 sec bins |
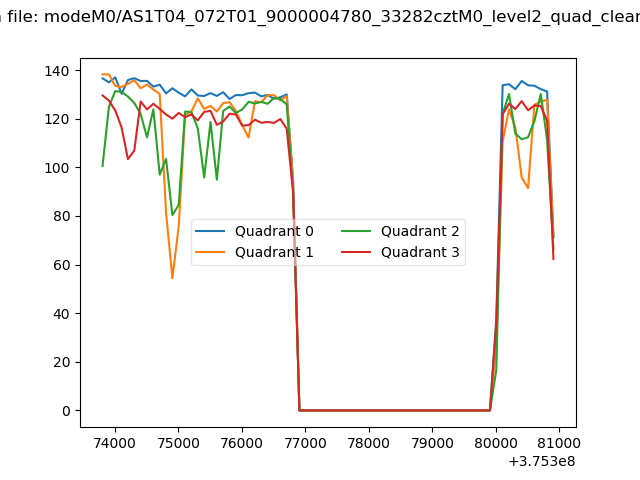 |
|
| Module-wise count rates for Quadrant A Data is divided into 100 sec bins |
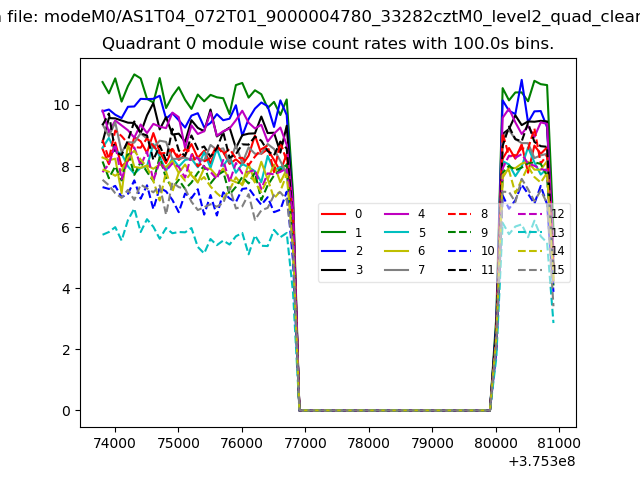 |
 |
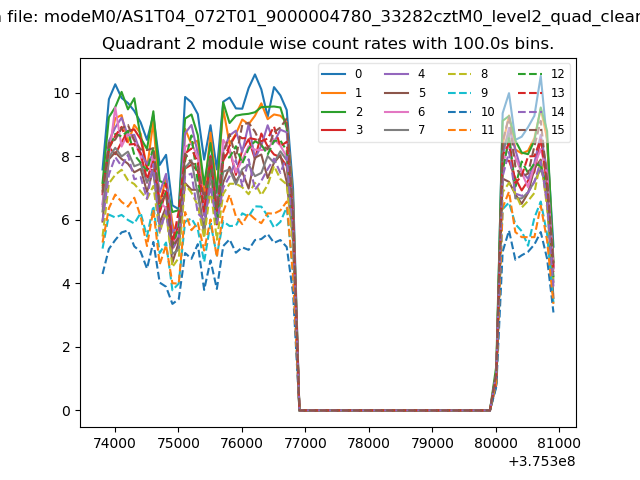
| Module-wise count rates for Quadrant B Data is divided into 100 sec bins |
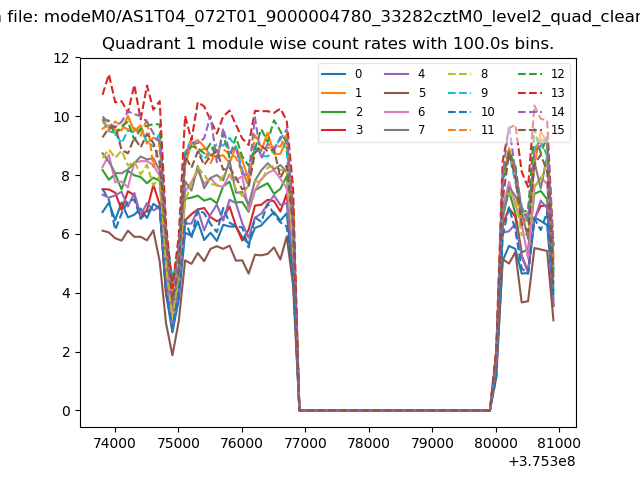 |
 |
| Module-wise count rates for Quadrant C Data is divided into 100 sec bins |
 |
 |
| Module-wise count rates for Quadrant D Data is divided into 100 sec bins |
 |
 |
| Parameter | Plot |
|---|---|
| CZT HV Monitor | 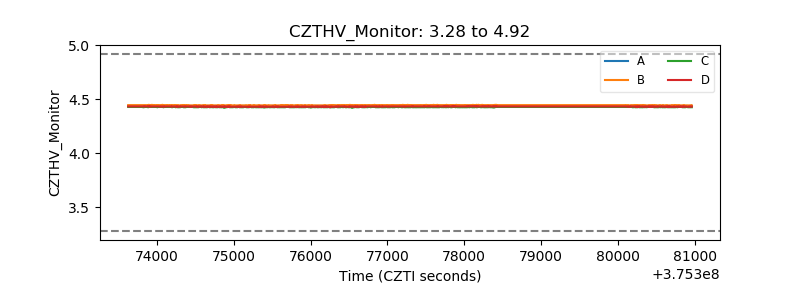 |
| D_VDD | 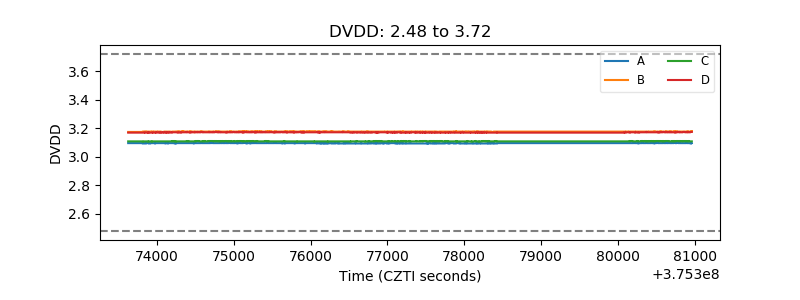 |
| Temperature 1 | 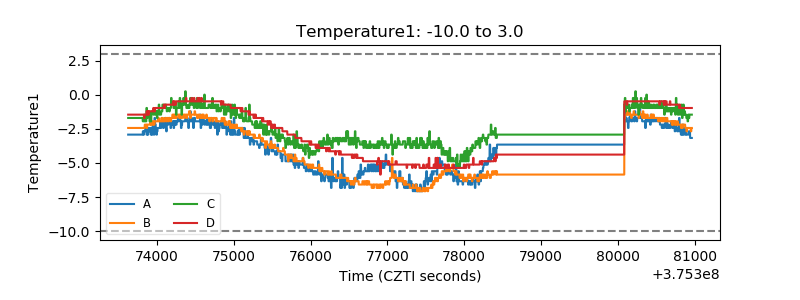 |
| Veto HV Monitor | 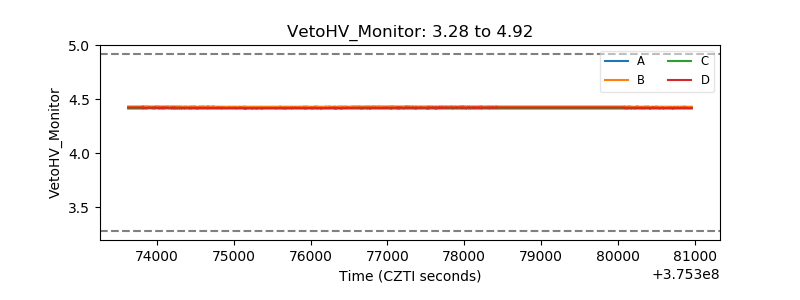 |
| Veto LLD | 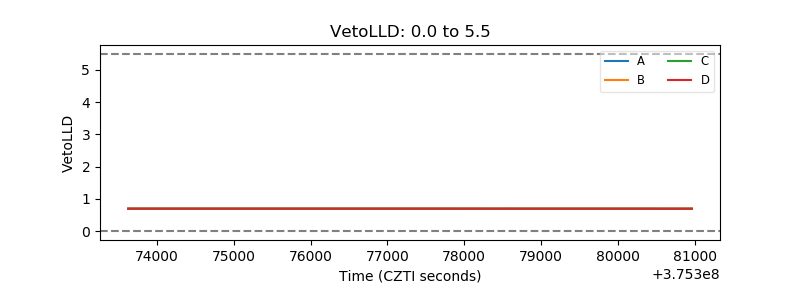 |
| Alpha Counter | 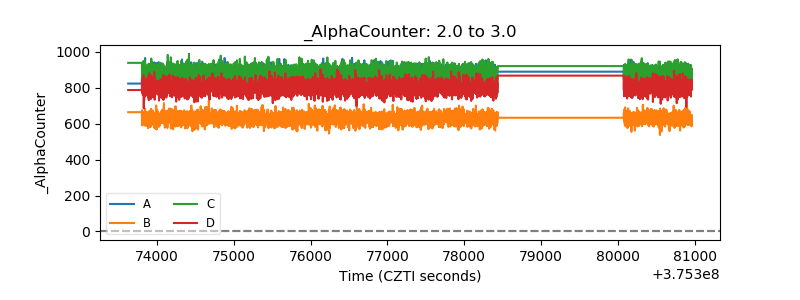 |
| _CPM_Rate | 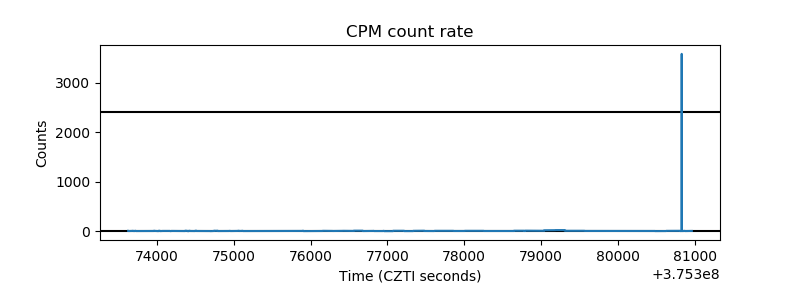 |
| CZT Counter |  |
| +2.5 Volts monitor |  |
| +5 Volts monitor | 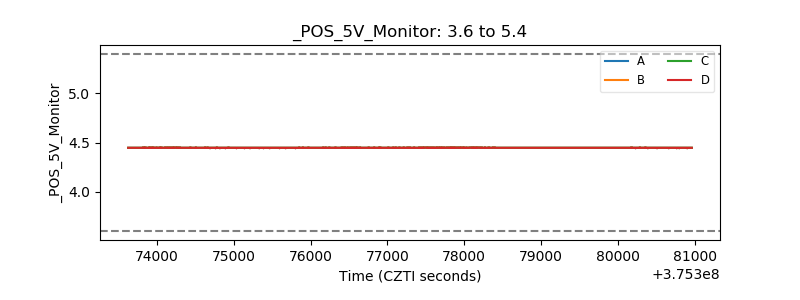 |
| _ROLL_ROT |  |
| _Roll_DEC |  |
| _Roll_RA |  |
| Veto Counter |  |