| Param | Original file | Final file |
|---|---|---|
| Filename | modeM0/AS1T04_072T01_9000004780_33284cztM0_level2.evt | modeM0/AS1T04_072T01_9000004780_33284cztM0_level2_quad_clean.evt |
| Size (bytes) | 575,107,200 | 73,949,760 |
| Size | 548.5 MB | 70.5 MB |
| Events in quadrant A | 2,685,235 | 483,514 |
| Events in quadrant B | 4,510,162 | 457,918 |
| Events in quadrant C | 4,047,632 | 451,294 |
| Events in quadrant D | 5,779,171 | 437,999 |
| Mode SS | |||
|---|---|---|---|
| Quadrant | BADHDUFLAG | Total packets | Discarded packets |
| A | 0 | 118 | 0 |
| B | 0 | 118 | 0 |
| C | 0 | 118 | 0 |
| D | 0 | 118 | 0 |
| Mode M0 | |||
|---|---|---|---|
| Quadrant | BADHDUFLAG | Total packets | Discarded packets |
| A | 0 | 11924 | 3 |
| B | 0 | 17236 | 2 |
| C | 0 | 15655 | 2 |
| D | 0 | 21304 | 2 |
| Mode M9 | |||
|---|---|---|---|
| Quadrant | BADHDUFLAG | Total packets | Discarded packets |
| A | 0 | 20 | 0 |
| B | 0 | 20 | 0 |
| C | 0 | 20 | 0 |
| D | 0 | 21 | 0 |
| Quadrant | Total seconds | Saturated seconds | Saturation percentage |
|---|---|---|---|
| A | 5842 | 22 | 0.376583% |
| B | 5842 | 423 | 7.240671% |
| C | 5842 | 277 | 4.741527% |
| D | 5842 | 428 | 7.326258% |
Noise dominated data is calculated using 1-second bins in cleaned event files. If a bin has >2000 counts, and if more than 50% of those come from <1% of pixels, then it is considered to be noise-dominated and hence unusable.
| Quadrant | # 1 sec bins | Bins with >0 counts | Bins with >2000 counts | High rate bins dominated by noise | Noise dominated (total time) | Noise dominated (detector-on time) | Marked lightcurve |
|---|---|---|---|---|---|---|---|
| A | 7155 | 5843 | 11 | 11 | 0.15% | 0.19% | 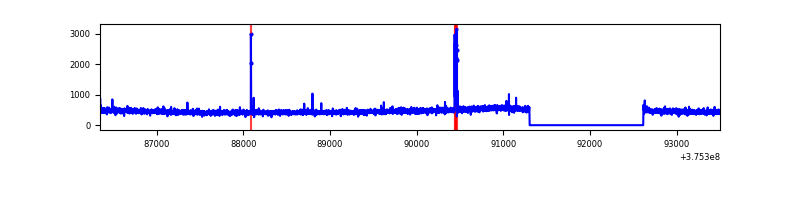 |
| B | 7155 | 5843 | 225 | 225 | 3.14% | 3.85% | 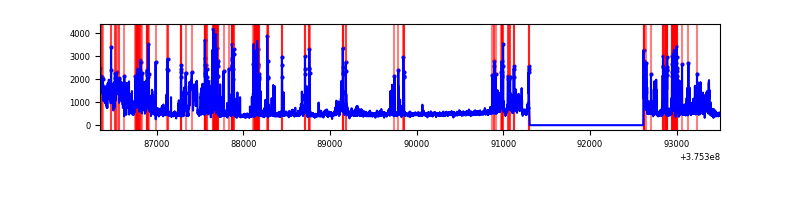 |
| C | 7155 | 5843 | 246 | 246 | 3.44% | 4.21% | 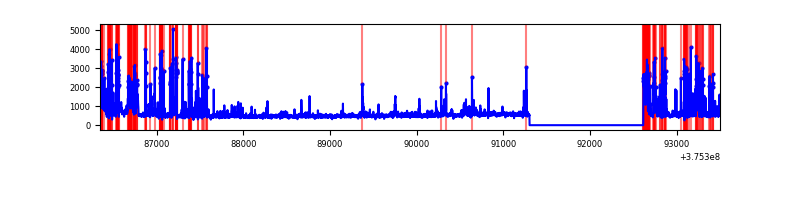 |
| D | 7155 | 5843 | 361 | 361 | 5.05% | 6.18% | 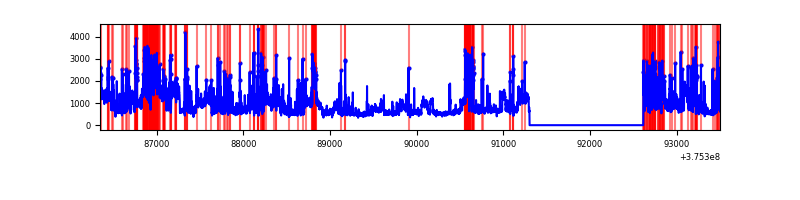 |
Top three noisy pixels from each quadrant. If the there are fewer than three noisy pixels in the level2.evt file, extra rows are filled as -1
| Pixel properties | Quadrant properties | ||||||
|---|---|---|---|---|---|---|---|
| Quadrant | DetID | PixID | Counts | Sigma | Mean | Median | Sigma |
| A | 15 | 17 | 43722 | 315.3 | 678 | 664 | 136.6 |
| A | 13 | 254 | 9537 | 64.97 | 678 | 664 | 136.6 |
| A | 15 | 169 | 7687 | 51.43 | 678 | 664 | 136.6 |
| B | 5 | 172 | 733685 | 5813.04 | 661 | 643 | 126.1 |
| B | 0 | 219 | 714461 | 5660.6 | 661 | 643 | 126.1 |
| B | 5 | 200 | 198413 | 1568.32 | 661 | 643 | 126.1 |
| C | 1 | 23 | 1064038 | 7103.11 | 647 | 652 | 149.7 |
| C | 15 | 214 | 244791 | 1630.78 | 647 | 652 | 149.7 |
| C | 0 | 10 | 133045 | 884.35 | 647 | 652 | 149.7 |
| D | 8 | 195 | 1894627 | 11534.38 | 639 | 625 | 164.2 |
| D | 12 | 218 | 349965 | 2127.46 | 639 | 625 | 164.2 |
| D | 12 | 6 | 204240 | 1240.01 | 639 | 625 | 164.2 |
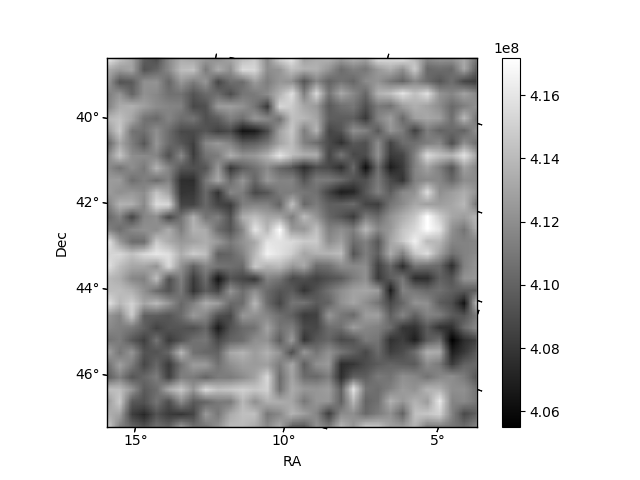
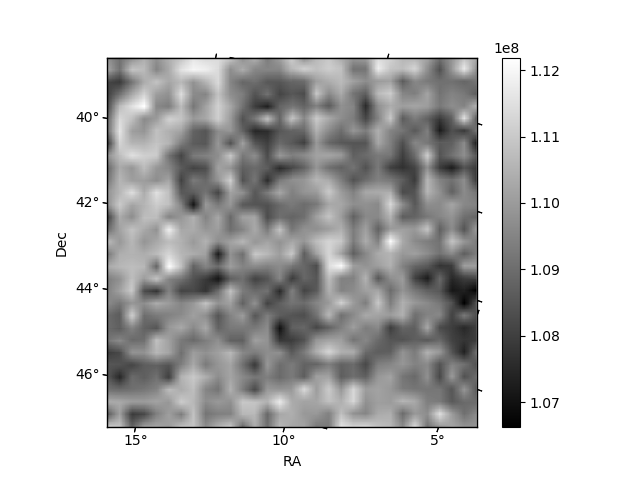
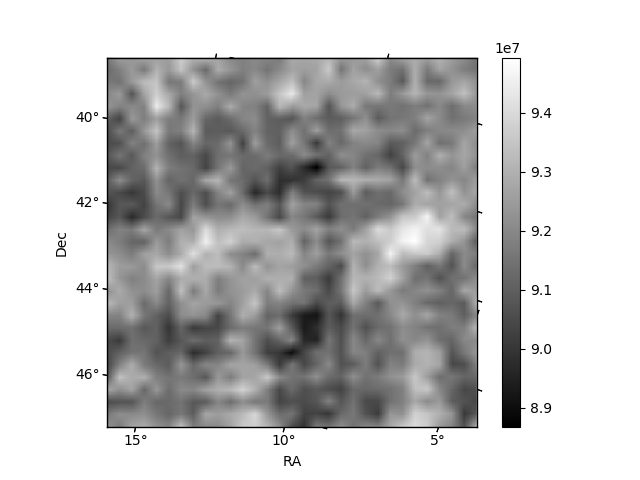
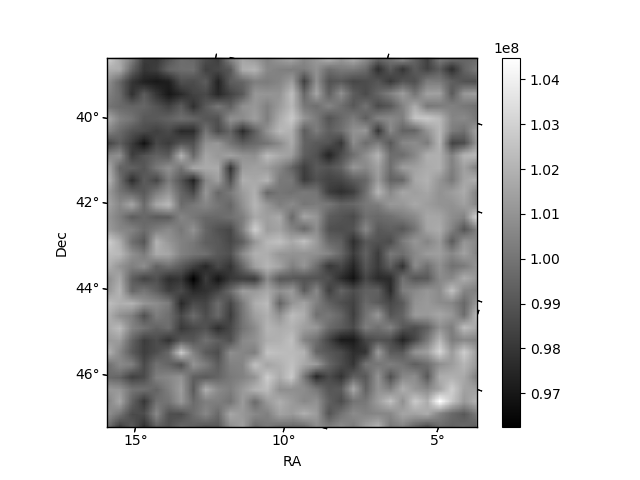
Histogram calculated using DETX and DETY for each event in the final _common_clean file
| Quadrant A | 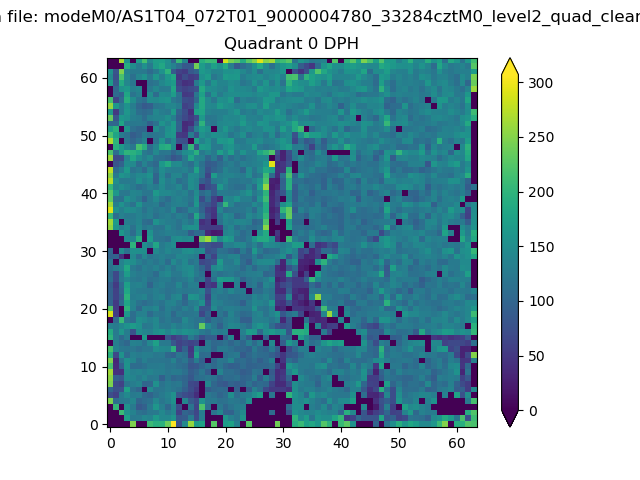 |
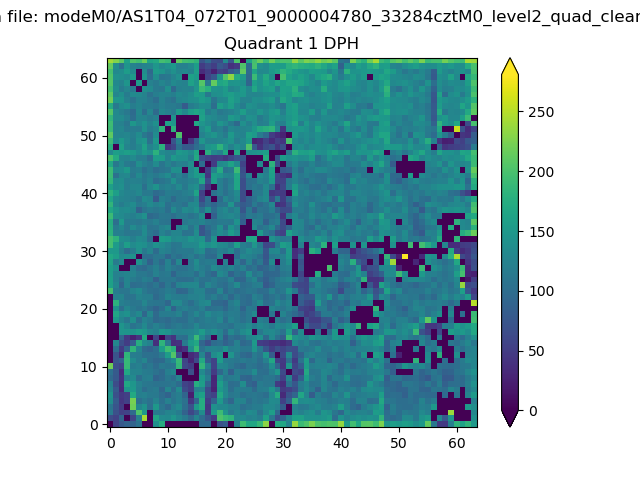 |
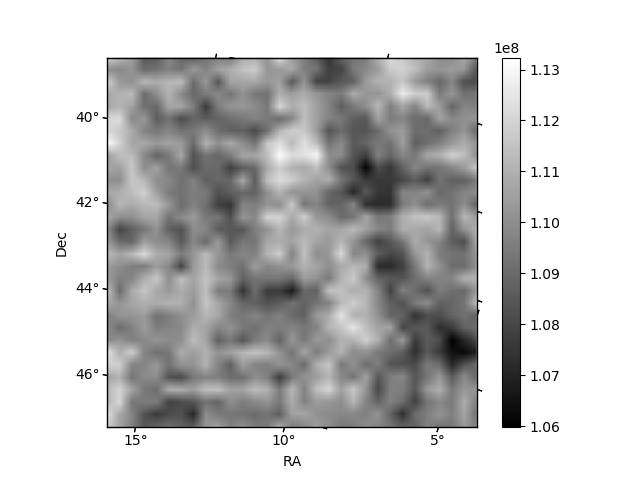
Quadrant B |
|---|---|---|---|
| Quadrant D | 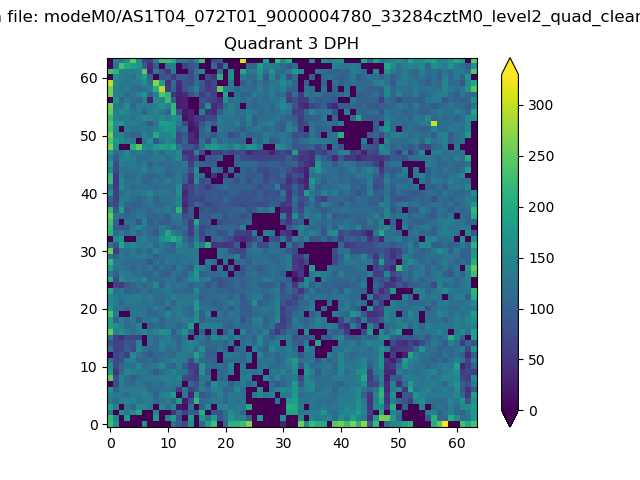 |
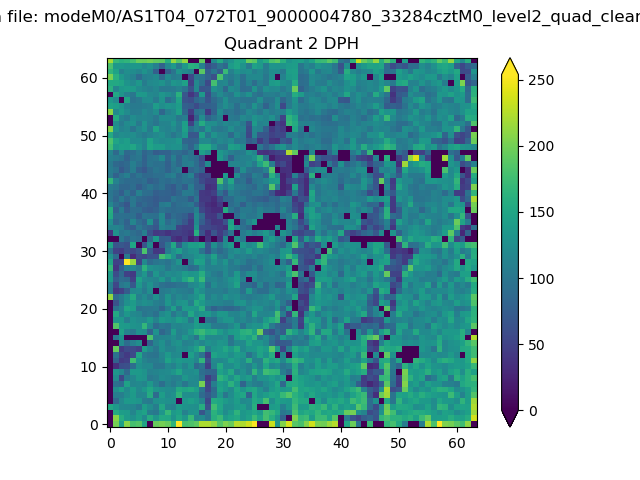 |
Quadrant C |
| Plot type | Count rate plots | Images |
|---|---|---|
| Comparison with Poisson distribution Blue bars denote a histogram of data divided into 1 sec bins. Red curve is a Poisson curve with rate = median count rate of data. |
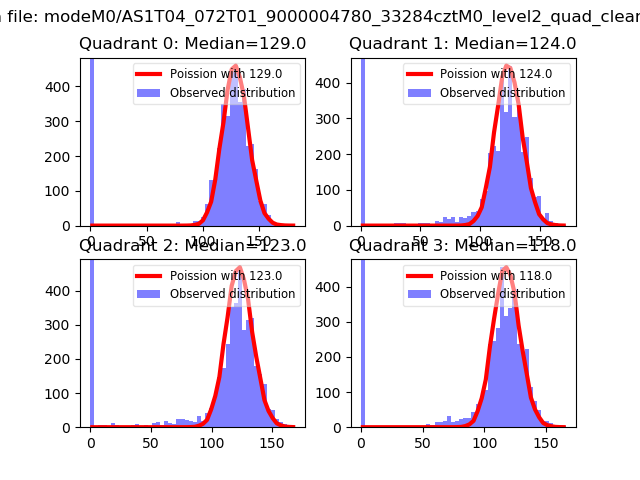 |
 |
| Quadrant-wise count rates Data is divided into 100 sec bins |
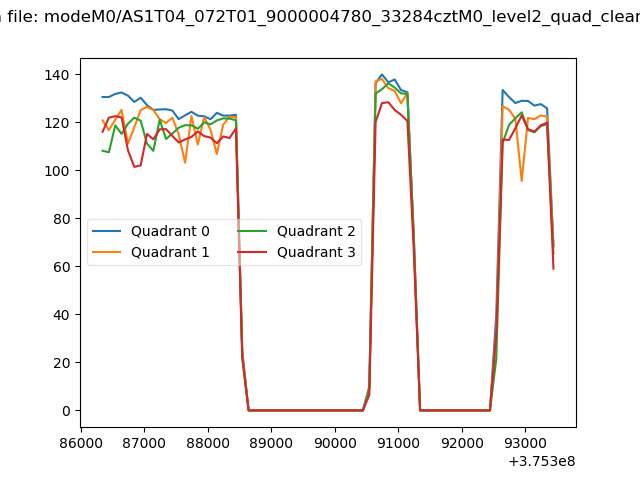 |
|
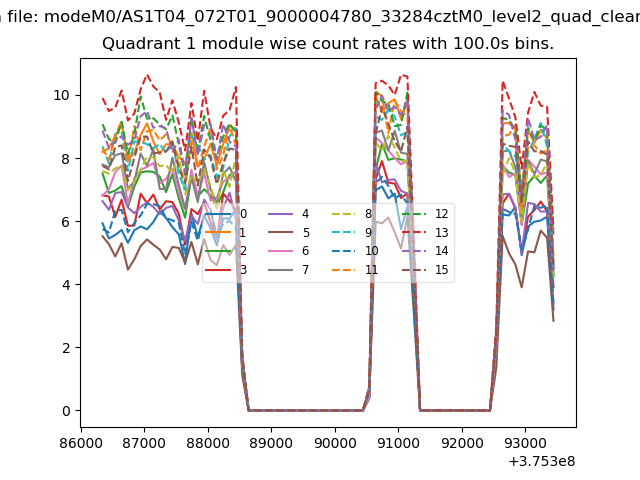
| Module-wise count rates for Quadrant A Data is divided into 100 sec bins |
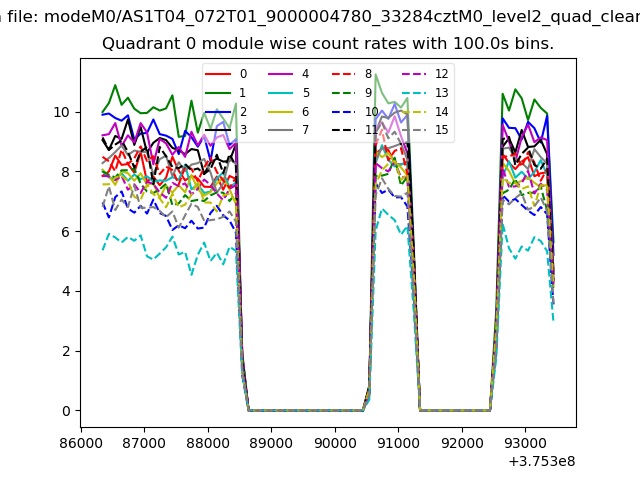 |
 |
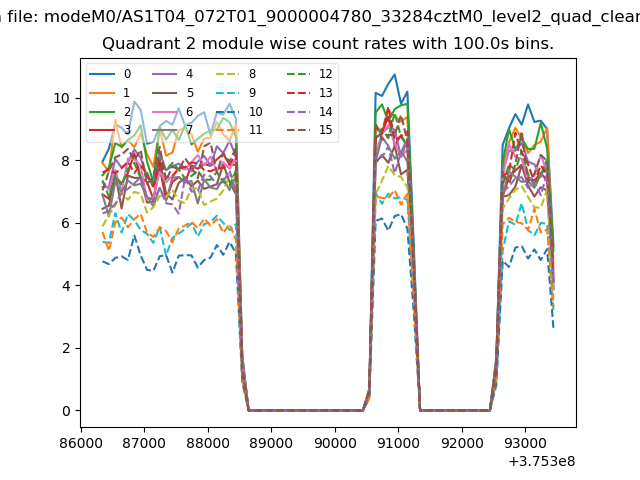
| Module-wise count rates for Quadrant B Data is divided into 100 sec bins |
 |
 |
| Module-wise count rates for Quadrant C Data is divided into 100 sec bins |
 |
 |
| Module-wise count rates for Quadrant D Data is divided into 100 sec bins |
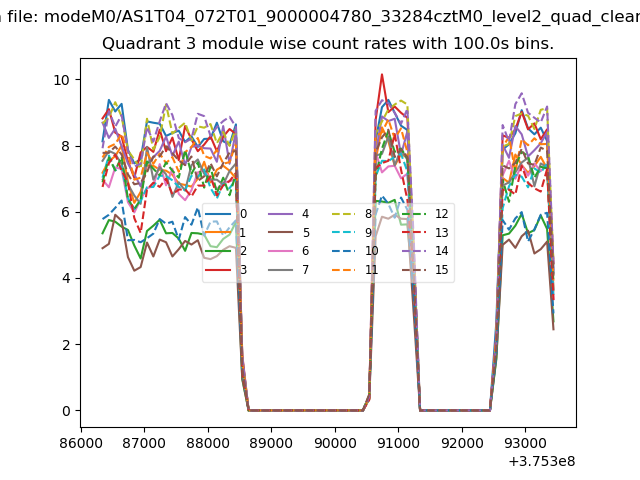 |
 |
| Parameter | Plot |
|---|---|
| CZT HV Monitor | 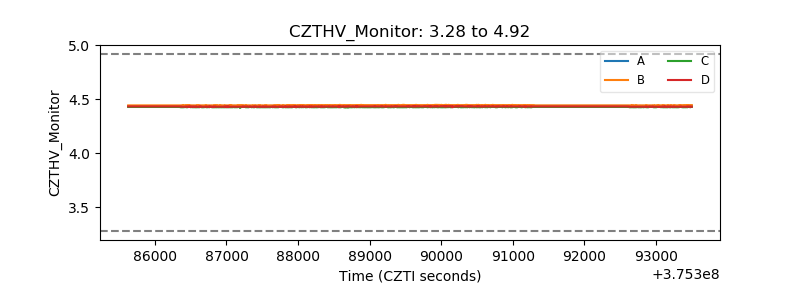 |
| D_VDD | 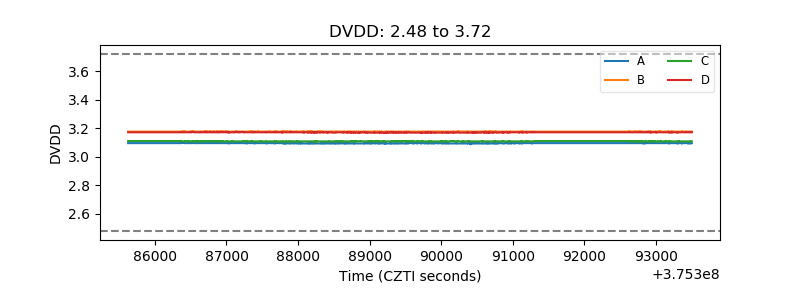 |
| Temperature 1 | 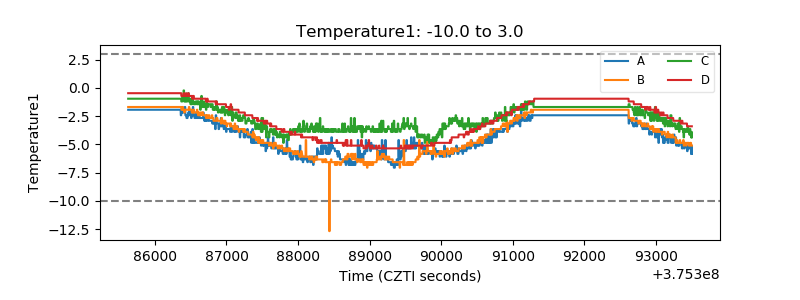 |
| Veto HV Monitor | 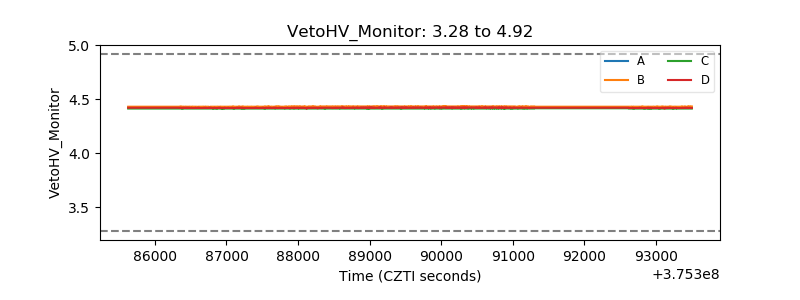 |
| Veto LLD |  |
| Alpha Counter |  |
| _CPM_Rate | 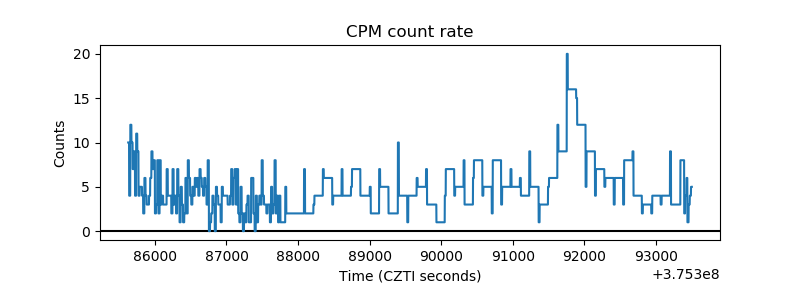 |
| CZT Counter | 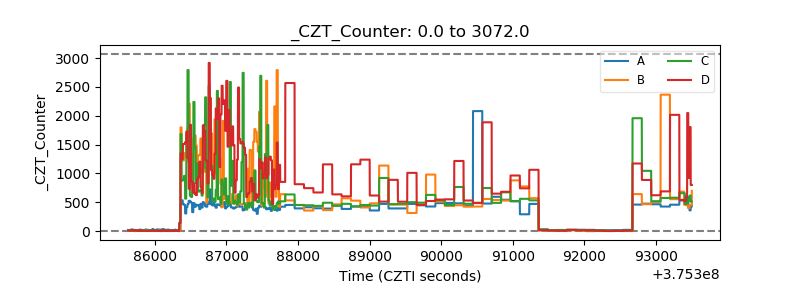 |
| +2.5 Volts monitor |  |
| +5 Volts monitor |  |
| _ROLL_ROT | 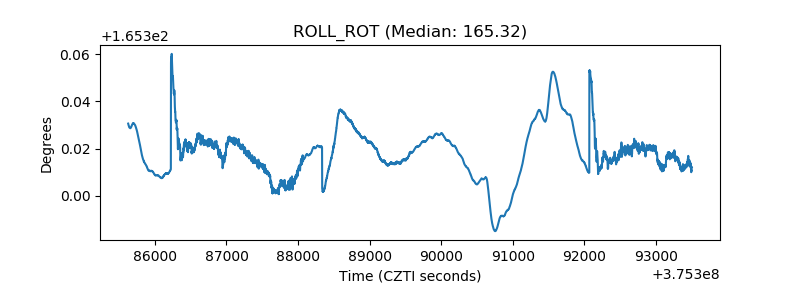 |
| _Roll_DEC | 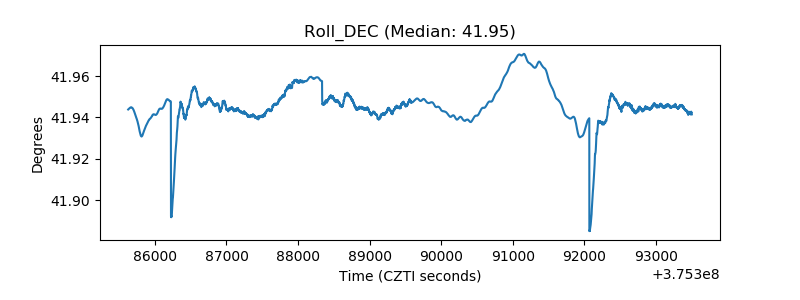 |
| _Roll_RA |  |
| Veto Counter | 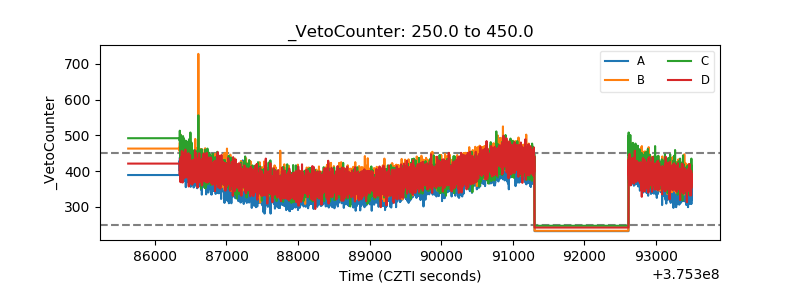 |