| Param | Original file | Final file |
|---|---|---|
| Filename | modeM0/AS1T04_072T01_9000004780_33286cztM0_level2.evt | modeM0/AS1T04_072T01_9000004780_33286cztM0_level2_quad_clean.evt |
| Size (bytes) | 785,151,360 | 86,716,800 |
| Size | 748.8 MB | 82.7 MB |
| Events in quadrant A | 3,606,110 | 538,346 |
| Events in quadrant B | 5,458,929 | 515,836 |
| Events in quadrant C | 4,833,700 | 515,143 |
| Events in quadrant D | 9,330,696 | 491,002 |
| Mode SS | |||
|---|---|---|---|
| Quadrant | BADHDUFLAG | Total packets | Discarded packets |
| A | 0 | 166 | 0 |
| B | 0 | 166 | 0 |
| C | 0 | 166 | 0 |
| D | 0 | 166 | 0 |
| Mode M0 | |||
|---|---|---|---|
| Quadrant | BADHDUFLAG | Total packets | Discarded packets |
| A | 0 | 16414 | 3 |
| B | 0 | 21682 | 2 |
| C | 0 | 19341 | 2 |
| D | 0 | 33477 | 2 |
| Mode M9 | |||
|---|---|---|---|
| Quadrant | BADHDUFLAG | Total packets | Discarded packets |
| A | 0 | 22 | 0 |
| B | 0 | 22 | 0 |
| C | 0 | 22 | 0 |
| D | 0 | 23 | 0 |
| Quadrant | Total seconds | Saturated seconds | Saturation percentage |
|---|---|---|---|
| A | 8128 | 8 | 0.098425% |
| B | 8128 | 460 | 5.659449% |
| C | 8128 | 192 | 2.362205% |
| D | 8128 | 752 | 9.251969% |
Noise dominated data is calculated using 1-second bins in cleaned event files. If a bin has >2000 counts, and if more than 50% of those come from <1% of pixels, then it is considered to be noise-dominated and hence unusable.
| Quadrant | # 1 sec bins | Bins with >0 counts | Bins with >2000 counts | High rate bins dominated by noise | Noise dominated (total time) | Noise dominated (detector-on time) | Marked lightcurve |
|---|---|---|---|---|---|---|---|
| A | 9471 | 8129 | 1 | 1 | 0.01% | 0.01% | 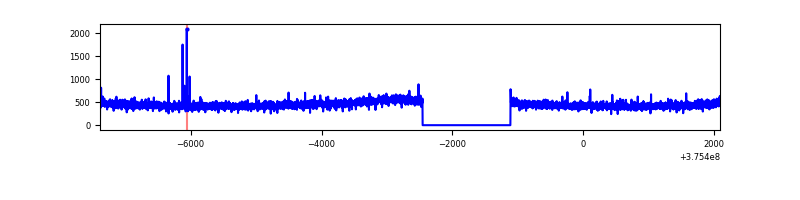 |
| B | 9471 | 8129 | 303 | 303 | 3.20% | 3.73% | 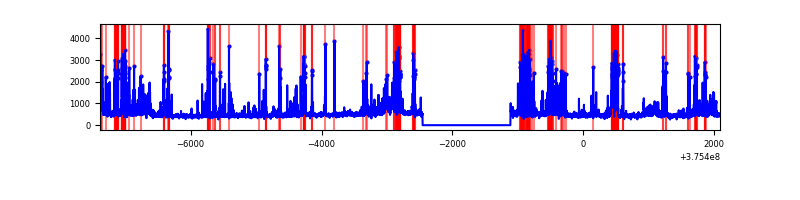 |
| C | 9471 | 8129 | 158 | 158 | 1.67% | 1.94% | 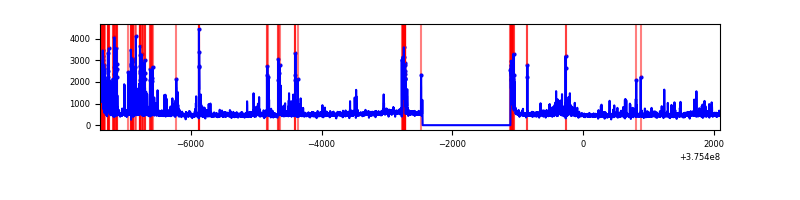 |
| D | 9471 | 8129 | 646 | 646 | 6.82% | 7.95% | 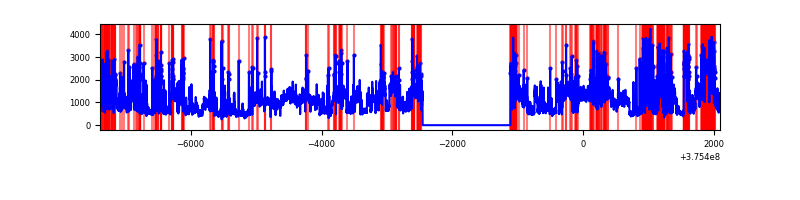 |
Top three noisy pixels from each quadrant. If the there are fewer than three noisy pixels in the level2.evt file, extra rows are filled as -1
| Pixel properties | Quadrant properties | ||||||
|---|---|---|---|---|---|---|---|
| Quadrant | DetID | PixID | Counts | Sigma | Mean | Median | Sigma |
| A | 13 | 254 | 13930 | 69.64 | 923 | 900 | 187.1 |
| A | 10 | 248 | 10668 | 52.2 | 923 | 900 | 187.1 |
| A | 3 | 137 | 9030 | 43.45 | 923 | 900 | 187.1 |
| B | 5 | 172 | 919949 | 5346.43 | 901 | 878 | 171.9 |
| B | 0 | 219 | 837239 | 4865.29 | 901 | 878 | 171.9 |
| B | 4 | 170 | 38534 | 219.05 | 901 | 878 | 171.9 |
| C | 1 | 23 | 672316 | 3258.45 | 892 | 898 | 206.1 |
| C | 15 | 214 | 342747 | 1659.02 | 892 | 898 | 206.1 |
| C | 0 | 10 | 169505 | 818.27 | 892 | 898 | 206.1 |
| D | 8 | 195 | 3623077 | 15825.94 | 861 | 842 | 228.9 |
| D | 12 | 6 | 900390 | 3930.22 | 861 | 842 | 228.9 |
| D | 14 | 52 | 455022 | 1984.36 | 861 | 842 | 228.9 |
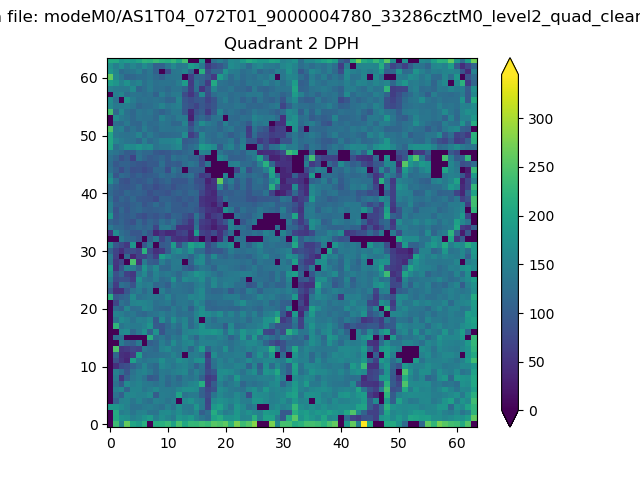
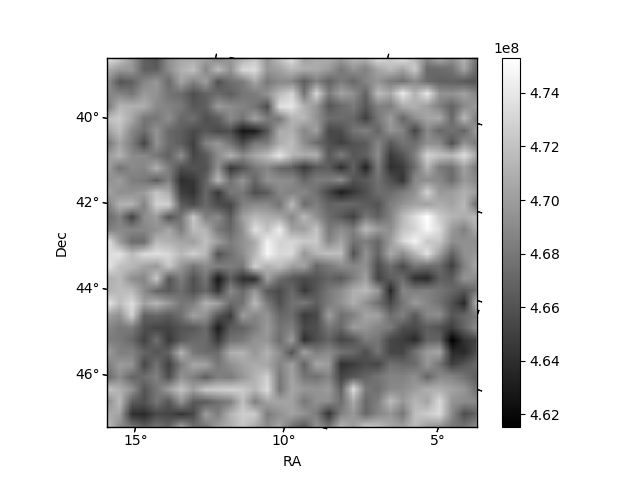
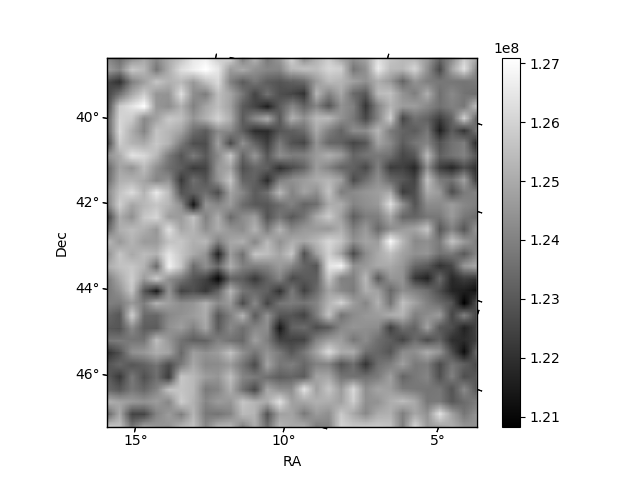
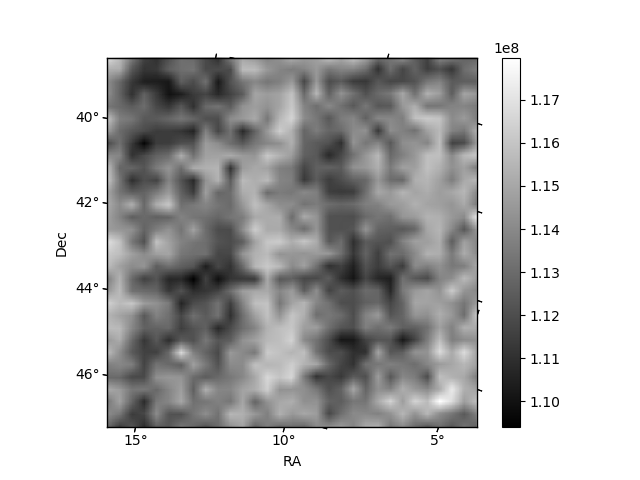
Histogram calculated using DETX and DETY for each event in the final _common_clean file
| Quadrant A | 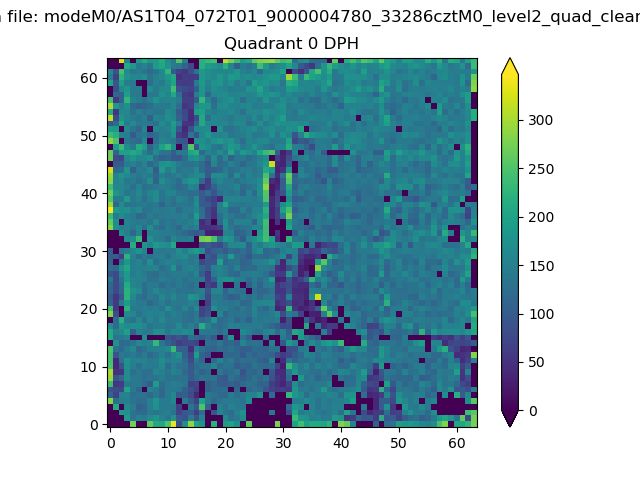 |
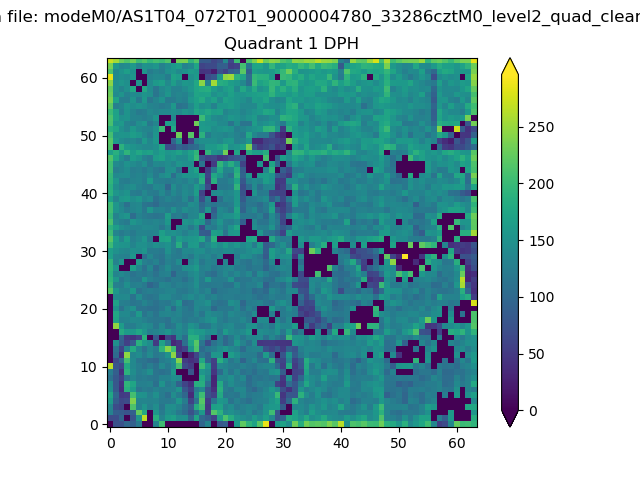 |
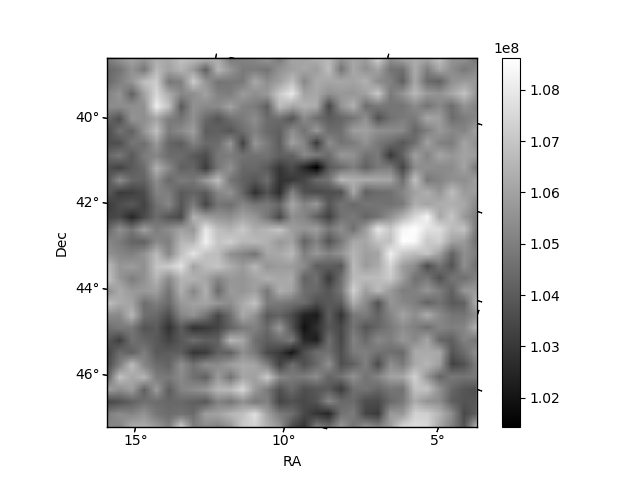
Quadrant B |
|---|---|---|---|
| Quadrant D | 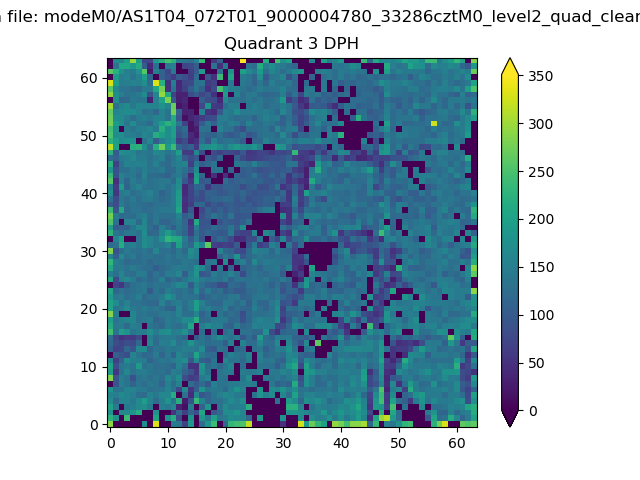 |
 |
Quadrant C |
| Plot type | Count rate plots | Images |
|---|---|---|
| Comparison with Poisson distribution Blue bars denote a histogram of data divided into 1 sec bins. Red curve is a Poisson curve with rate = median count rate of data. |
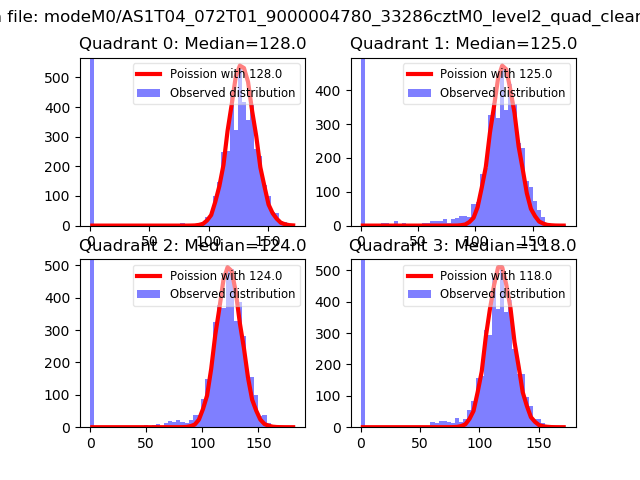 |
 |
| Quadrant-wise count rates Data is divided into 100 sec bins |
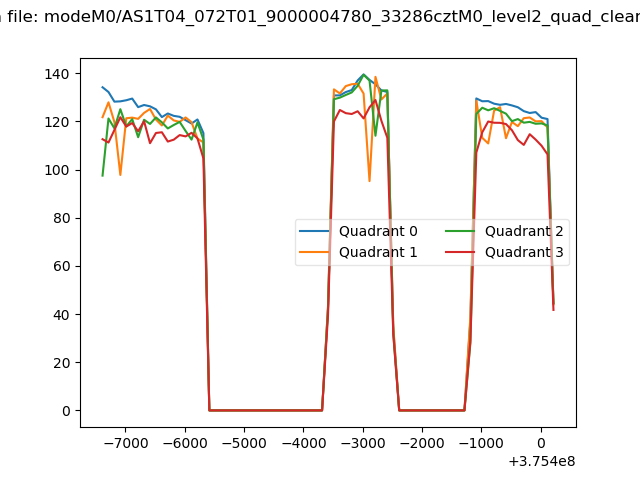 |
|
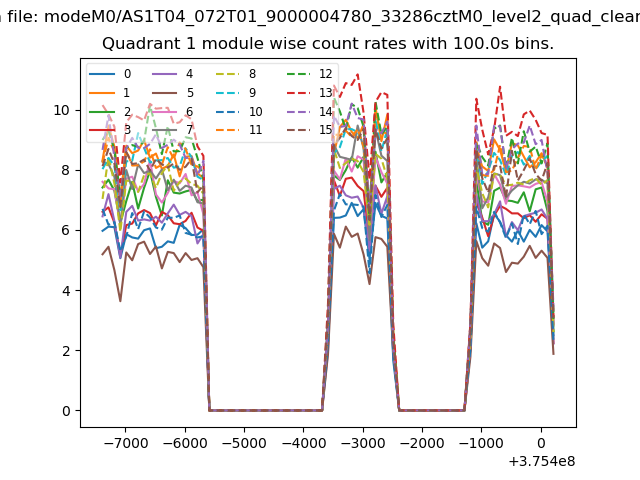
| Module-wise count rates for Quadrant A Data is divided into 100 sec bins |
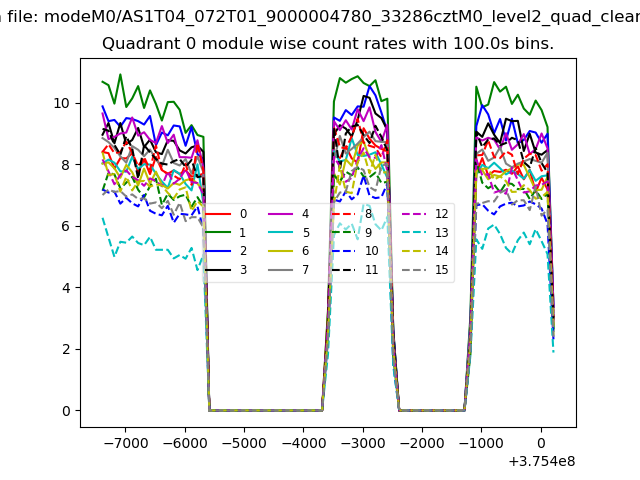 |
 |
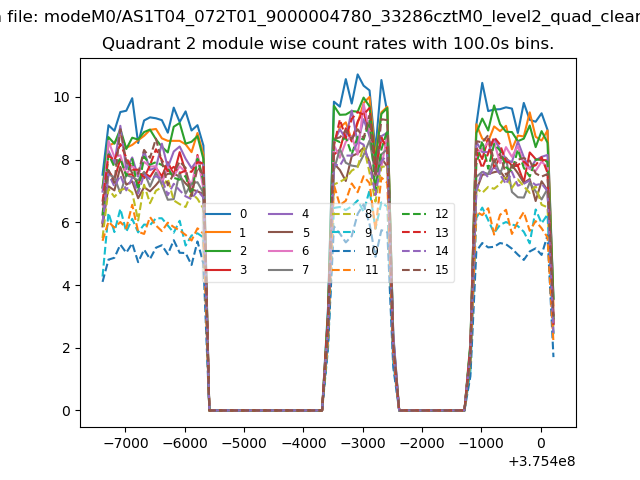
| Module-wise count rates for Quadrant B Data is divided into 100 sec bins |
 |
 |
| Module-wise count rates for Quadrant C Data is divided into 100 sec bins |
 |
 |
| Module-wise count rates for Quadrant D Data is divided into 100 sec bins |
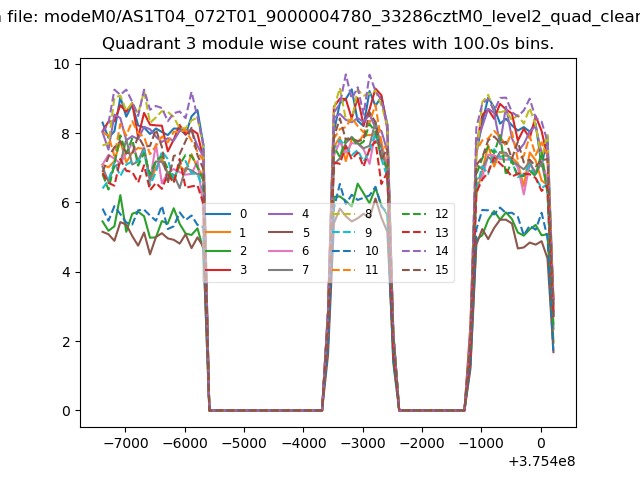 |
 |
| Parameter | Plot |
|---|---|
| CZT HV Monitor | 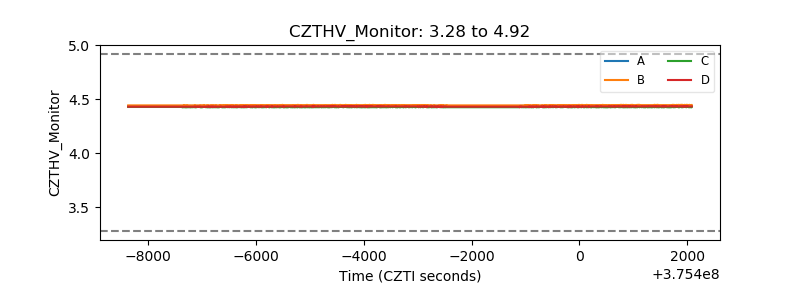 |
| D_VDD | 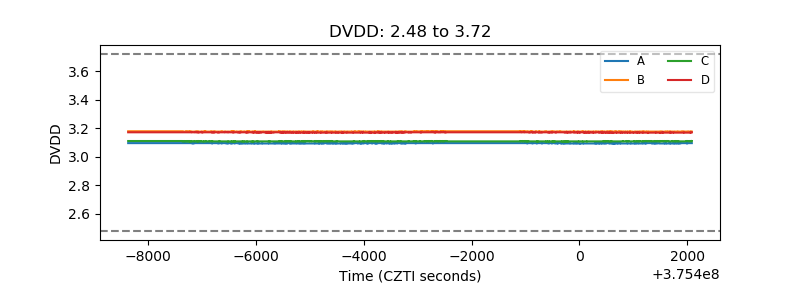 |
| Temperature 1 | 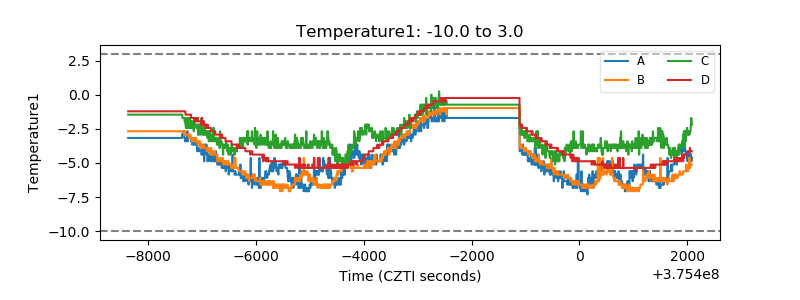 |
| Veto HV Monitor |  |
| Veto LLD |  |
| Alpha Counter | 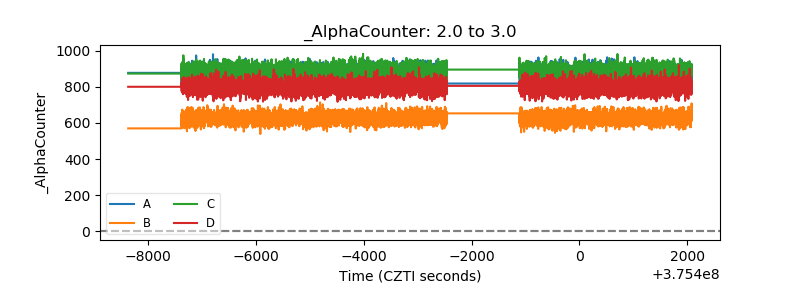 |
| _CPM_Rate | 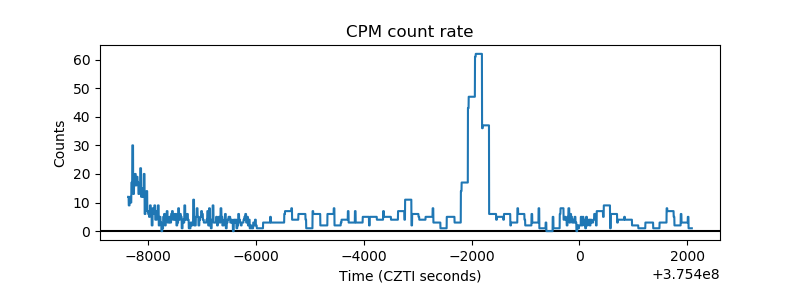 |
| CZT Counter | 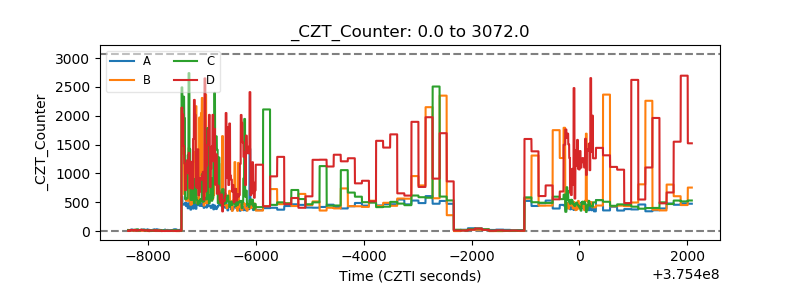 |
| +2.5 Volts monitor |  |
| +5 Volts monitor |  |
| _ROLL_ROT | 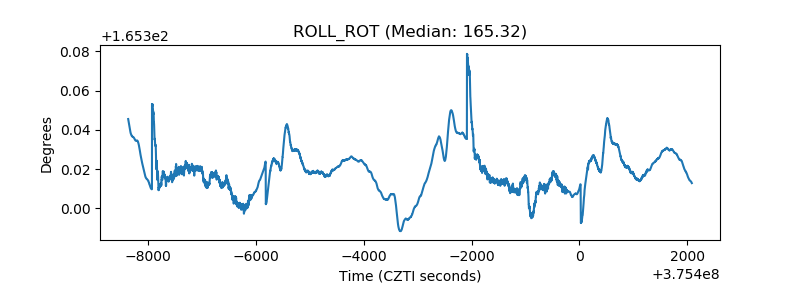 |
| _Roll_DEC | 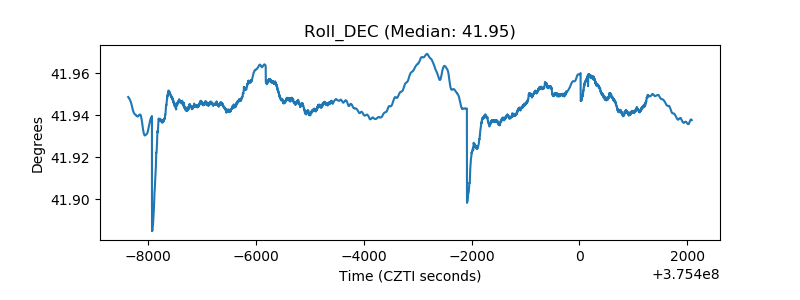 |
| _Roll_RA | 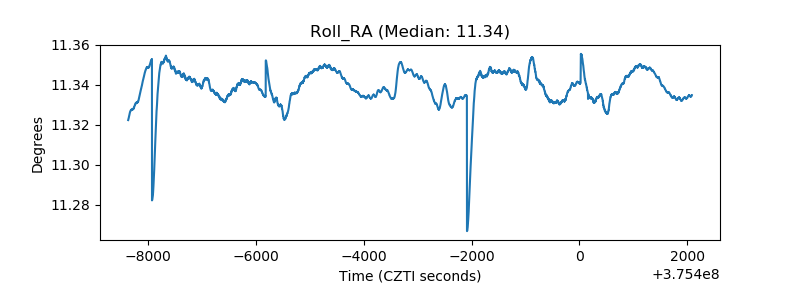 |
| Veto Counter | 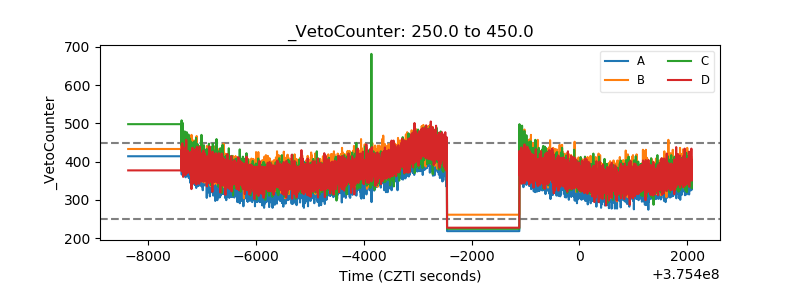 |