| Param | Original file | Final file |
|---|---|---|
| Filename | modeM0/AS1T04_072T01_9000004780_33287cztM0_level2.evt | modeM0/AS1T04_072T01_9000004780_33287cztM0_level2_quad_clean.evt |
| Size (bytes) | 1,429,220,160 | 169,925,760 |
| Size | 1.3 GB | 162.1 MB |
| Events in quadrant A | 6,866,312 | 1,071,890 |
| Events in quadrant B | 10,057,068 | 1,029,434 |
| Events in quadrant C | 8,825,689 | 1,039,970 |
| Events in quadrant D | 16,525,409 | 968,887 |
| Mode SS | |||
|---|---|---|---|
| Quadrant | BADHDUFLAG | Total packets | Discarded packets |
| A | 0 | 306 | 0 |
| B | 0 | 306 | 0 |
| C | 0 | 306 | 0 |
| D | 0 | 306 | 0 |
| Mode M0 | |||
|---|---|---|---|
| Quadrant | BADHDUFLAG | Total packets | Discarded packets |
| A | 0 | 30541 | 3 |
| B | 0 | 39913 | 2 |
| C | 0 | 35391 | 2 |
| D | 0 | 59706 | 2 |
| Mode M9 | |||
|---|---|---|---|
| Quadrant | BADHDUFLAG | Total packets | Discarded packets |
| A | 0 | 43 | 0 |
| B | 0 | 43 | 0 |
| C | 0 | 43 | 0 |
| D | 0 | 43 | 0 |
| Quadrant | Total seconds | Saturated seconds | Saturation percentage |
|---|---|---|---|
| A | 15005 | 16 | 0.106631% |
| B | 15005 | 853 | 5.684772% |
| C | 15005 | 203 | 1.352882% |
| D | 15005 | 1246 | 8.303899% |
Noise dominated data is calculated using 1-second bins in cleaned event files. If a bin has >2000 counts, and if more than 50% of those come from <1% of pixels, then it is considered to be noise-dominated and hence unusable.
| Quadrant | # 1 sec bins | Bins with >0 counts | Bins with >2000 counts | High rate bins dominated by noise | Noise dominated (total time) | Noise dominated (detector-on time) | Marked lightcurve |
|---|---|---|---|---|---|---|---|
| A | 19274 | 15008 | 1 | 1 | 0.01% | 0.01% | 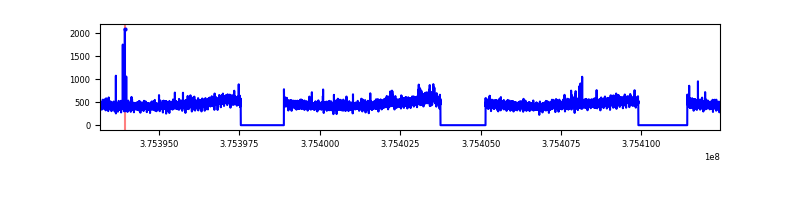 |
| B | 19274 | 15008 | 553 | 553 | 2.87% | 3.68% | 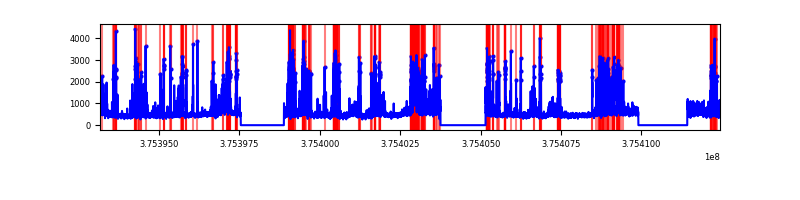 |
| C | 19274 | 15008 | 181 | 181 | 0.94% | 1.21% | 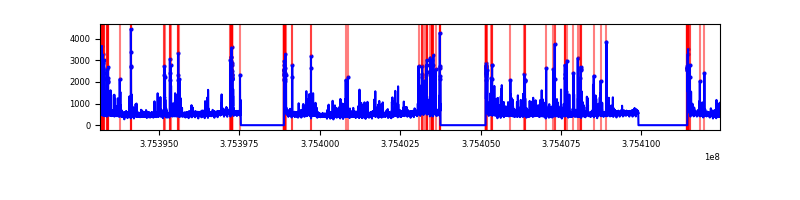 |
| D | 19274 | 15008 | 1032 | 1032 | 5.35% | 6.88% | 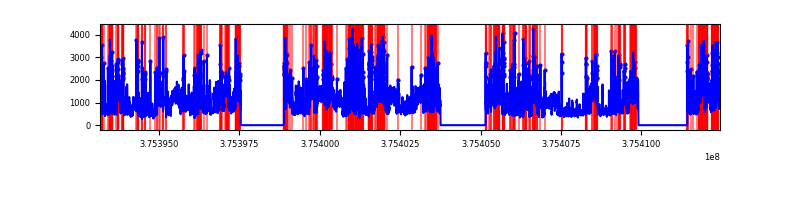 |
Top three noisy pixels from each quadrant. If the there are fewer than three noisy pixels in the level2.evt file, extra rows are filled as -1
| Pixel properties | Quadrant properties | ||||||
|---|---|---|---|---|---|---|---|
| Quadrant | DetID | PixID | Counts | Sigma | Mean | Median | Sigma |
| A | 12 | 16 | 38037 | 103.76 | 1748 | 1709 | 350.1 |
| A | 13 | 254 | 25727 | 68.6 | 1748 | 1709 | 350.1 |
| A | 13 | 6 | 23199 | 61.38 | 1748 | 1709 | 350.1 |
| B | 5 | 172 | 1669034 | 5158.99 | 1701 | 1654 | 323.2 |
| B | 0 | 219 | 1296842 | 4007.4 | 1701 | 1654 | 323.2 |
| B | 0 | 190 | 74521 | 225.46 | 1701 | 1654 | 323.2 |
| C | 1 | 23 | 955764 | 2466.02 | 1688 | 1701 | 386.9 |
| C | 15 | 214 | 633145 | 1632.13 | 1688 | 1701 | 386.9 |
| C | 0 | 10 | 261292 | 670.98 | 1688 | 1701 | 386.9 |
| D | 8 | 195 | 6288011 | 14161.37 | 1634 | 1604 | 443.9 |
| D | 12 | 6 | 1093280 | 2459.21 | 1634 | 1604 | 443.9 |
| D | 12 | 218 | 983075 | 2210.96 | 1634 | 1604 | 443.9 |
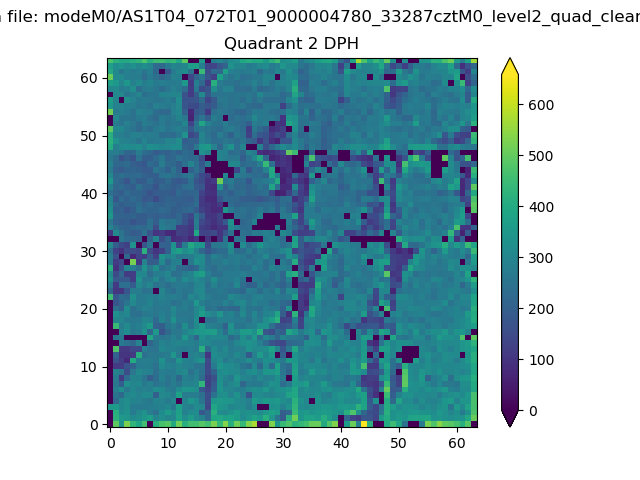
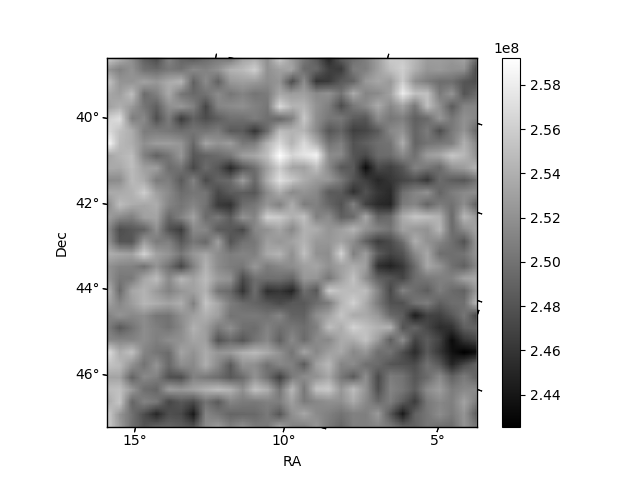
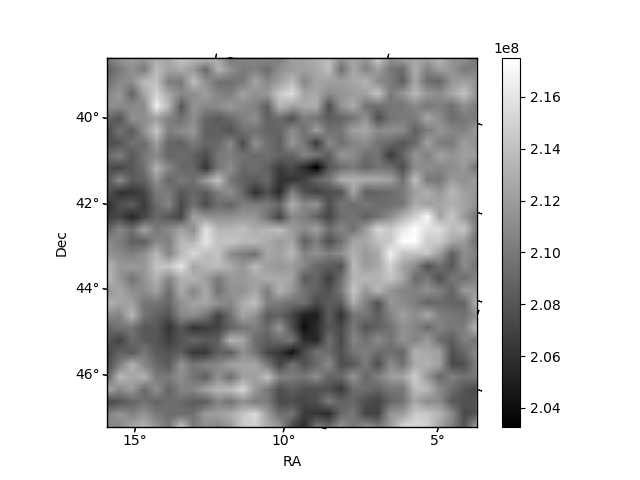
Histogram calculated using DETX and DETY for each event in the final _common_clean file
| Quadrant A | 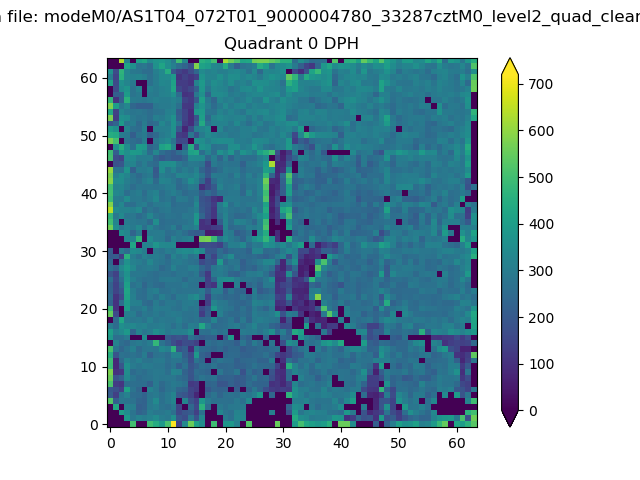 |
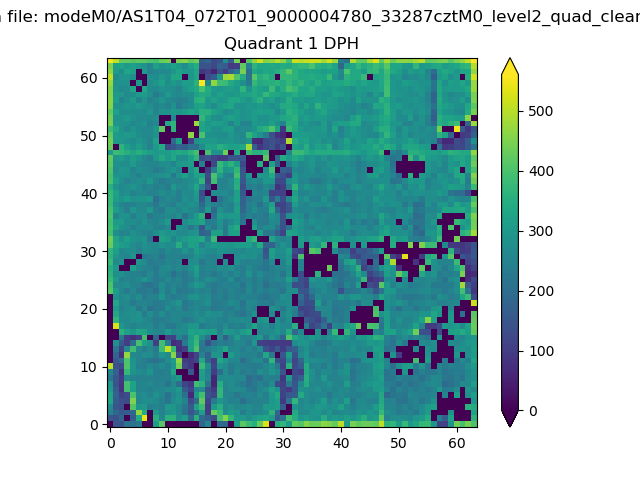 |
Quadrant B |
|---|---|---|---|
| Quadrant D | 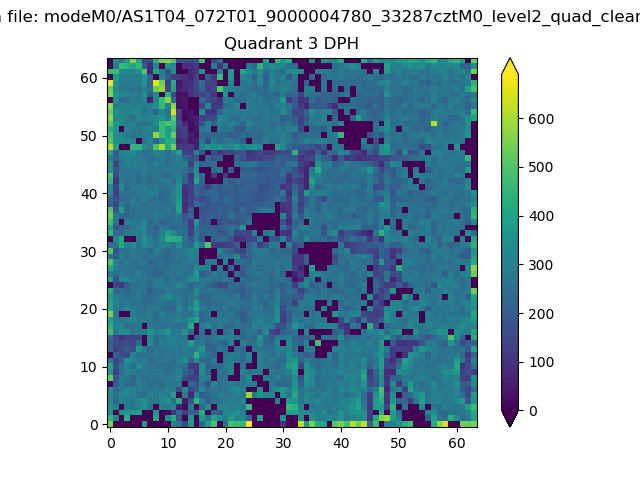 |
 |
Quadrant C |
| Plot type | Count rate plots | Images |
|---|---|---|
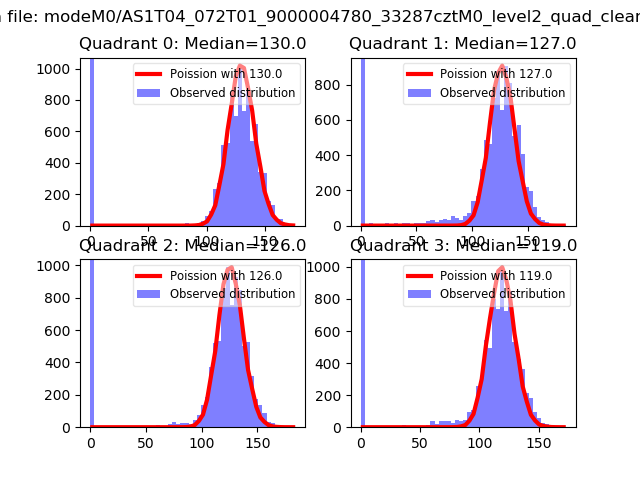
| Comparison with Poisson distribution Blue bars denote a histogram of data divided into 1 sec bins. Red curve is a Poisson curve with rate = median count rate of data. |
 |
 |
| Quadrant-wise count rates Data is divided into 100 sec bins |
 |
|
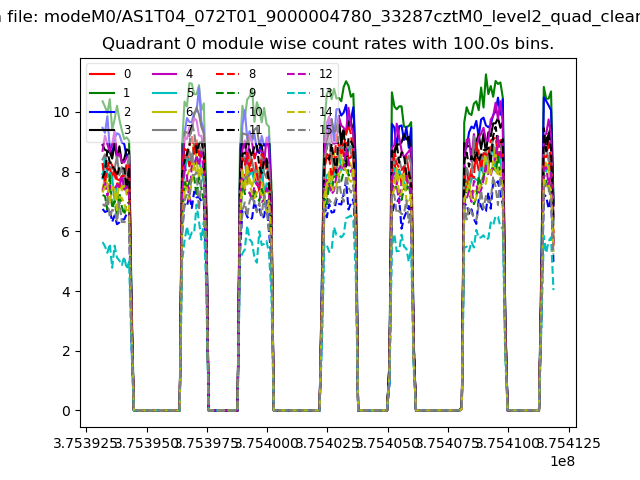
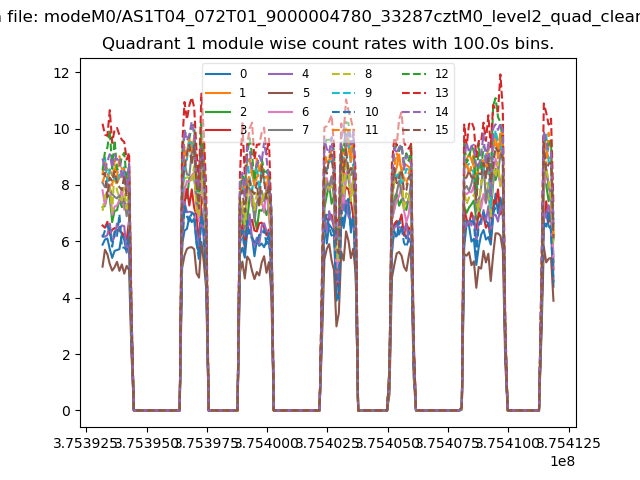
| Module-wise count rates for Quadrant A Data is divided into 100 sec bins |
 |
 |
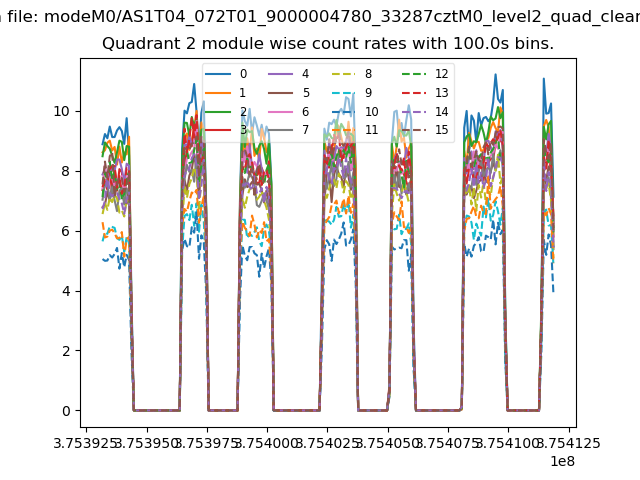
| Module-wise count rates for Quadrant B Data is divided into 100 sec bins |
 |
 |
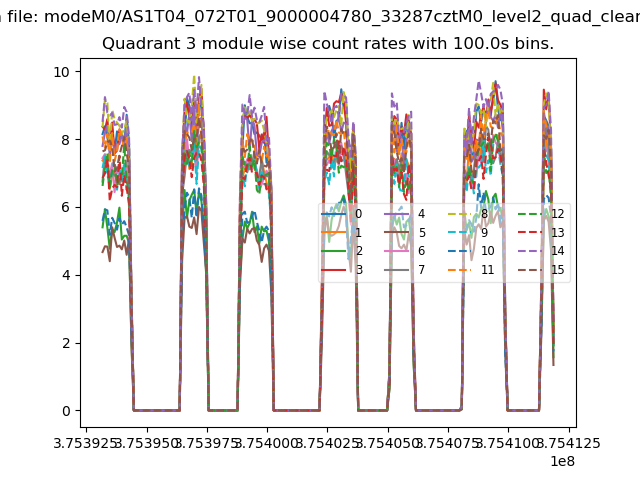
| Module-wise count rates for Quadrant C Data is divided into 100 sec bins |
 |
 |
| Module-wise count rates for Quadrant D Data is divided into 100 sec bins |
 |
 |
| Parameter | Plot |
|---|---|
| CZT HV Monitor | 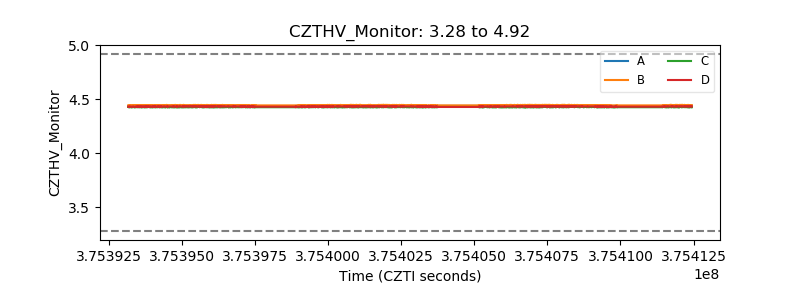 |
| D_VDD | 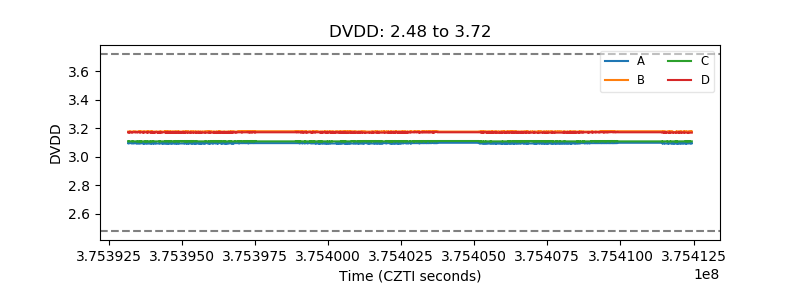 |
| Temperature 1 | 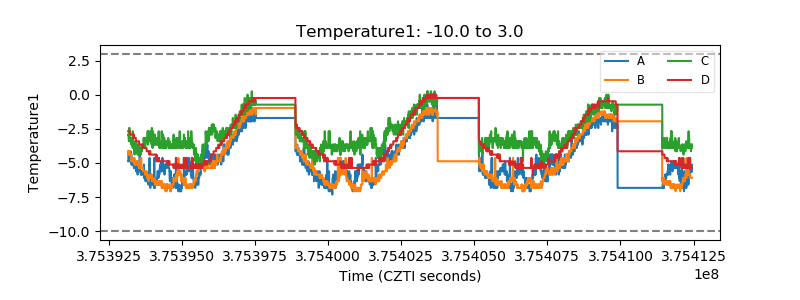 |
| Veto HV Monitor | 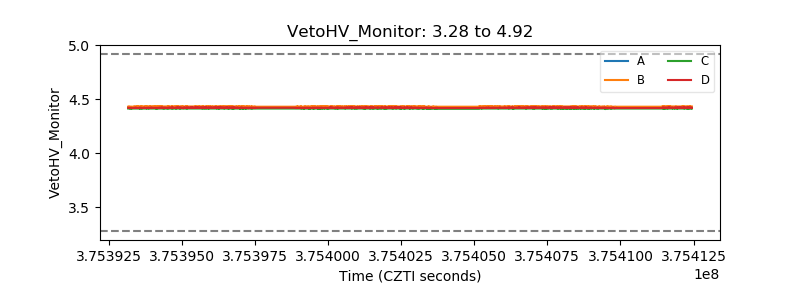 |
| Veto LLD | 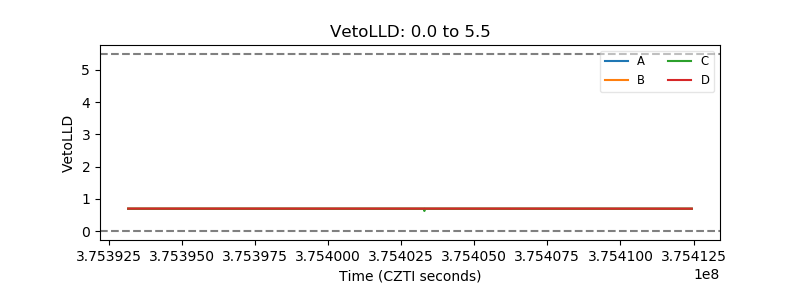 |
| Alpha Counter | 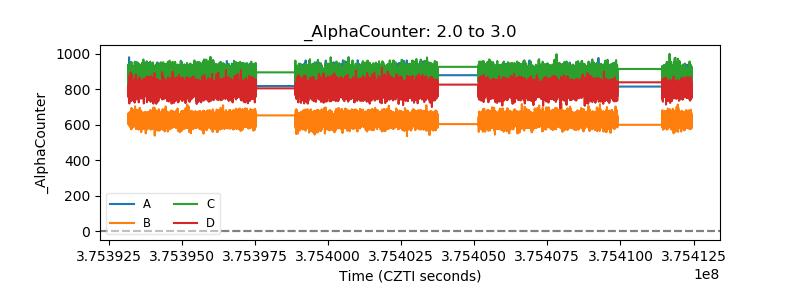 |
| _CPM_Rate | 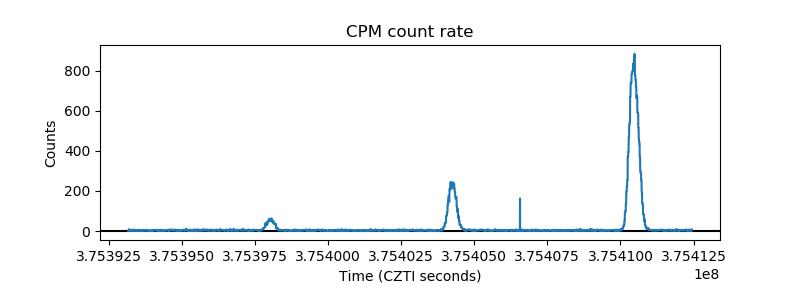 |
| CZT Counter | 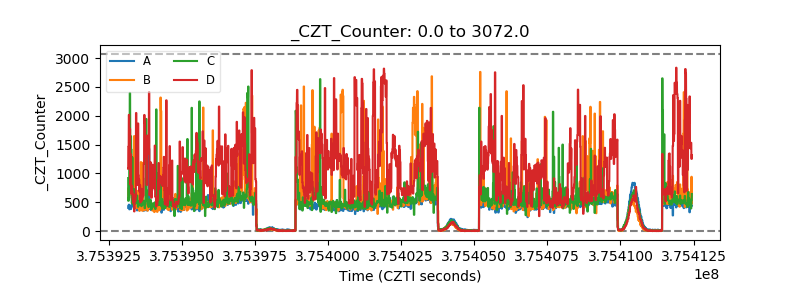 |
| +2.5 Volts monitor |  |
| +5 Volts monitor |  |
| _ROLL_ROT | 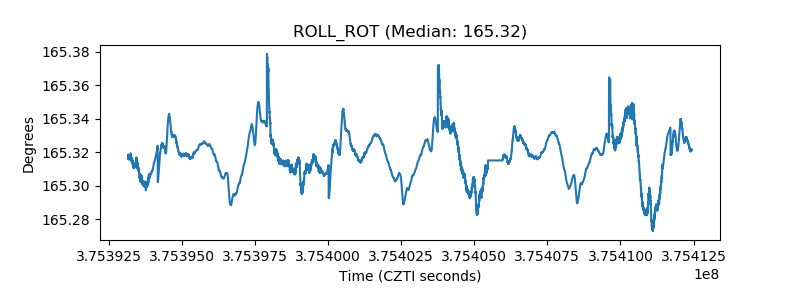 |
| _Roll_DEC | 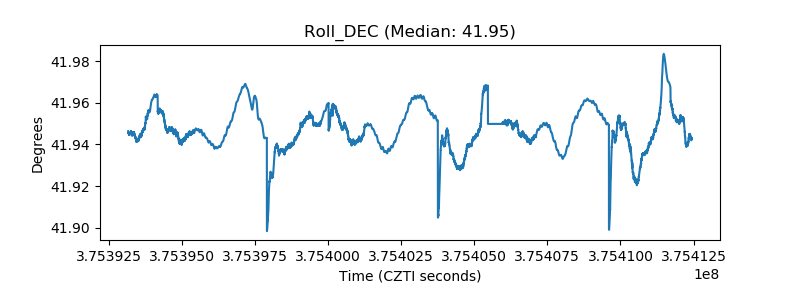 |
| _Roll_RA | 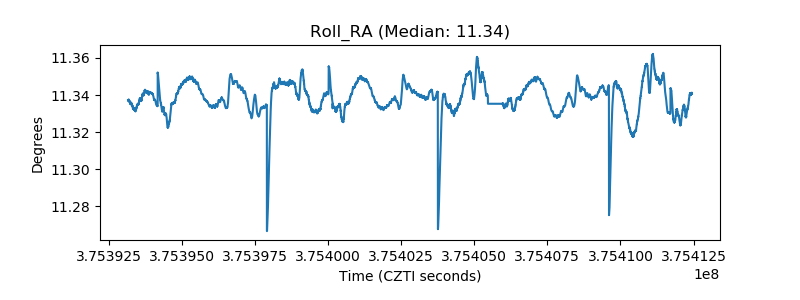 |
| Veto Counter | 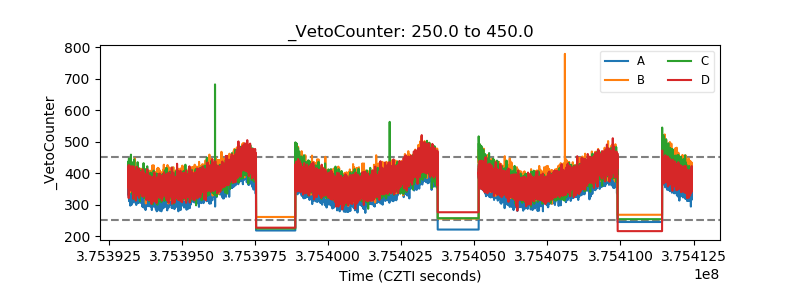 |