| Param | Original file | Final file |
|---|---|---|
| Filename | modeM0/AS1T04_072T01_9000004780_33291cztM0_level2.evt | modeM0/AS1T04_072T01_9000004780_33291cztM0_level2_quad_clean.evt |
| Size (bytes) | 588,124,800 | 56,053,440 |
| Size | 560.9 MB | 53.5 MB |
| Events in quadrant A | 2,711,316 | 365,351 |
| Events in quadrant B | 5,355,873 | 284,532 |
| Events in quadrant C | 3,397,248 | 354,846 |
| Events in quadrant D | 5,986,531 | 318,391 |
| Mode SS | |||
|---|---|---|---|
| Quadrant | BADHDUFLAG | Total packets | Discarded packets |
| A | 0 | 106 | 0 |
| B | 0 | 106 | 0 |
| C | 0 | 106 | 0 |
| D | 0 | 106 | 0 |
| Mode M0 | |||
|---|---|---|---|
| Quadrant | BADHDUFLAG | Total packets | Discarded packets |
| A | 0 | 11093 | 3 |
| B | 0 | 19347 | 2 |
| C | 0 | 13301 | 2 |
| D | 0 | 21796 | 2 |
| Mode M9 | |||
|---|---|---|---|
| Quadrant | BADHDUFLAG | Total packets | Discarded packets |
| A | 0 | 29 | 0 |
| B | 0 | 29 | 0 |
| C | 0 | 29 | 0 |
| D | 0 | 30 | 0 |
| Quadrant | Total seconds | Saturated seconds | Saturation percentage |
|---|---|---|---|
| A | 5340 | 7 | 0.131086% |
| B | 5340 | 1141 | 21.367041% |
| C | 5340 | 67 | 1.254682% |
| D | 5340 | 503 | 9.419476% |
Noise dominated data is calculated using 1-second bins in cleaned event files. If a bin has >2000 counts, and if more than 50% of those come from <1% of pixels, then it is considered to be noise-dominated and hence unusable.
| Quadrant | # 1 sec bins | Bins with >0 counts | Bins with >2000 counts | High rate bins dominated by noise | Noise dominated (total time) | Noise dominated (detector-on time) | Marked lightcurve |
|---|---|---|---|---|---|---|---|
| A | 7253 | 5341 | 0 | 0 | 0.00% | 0.00% |  |
| B | 7253 | 5341 | 867 | 867 | 11.95% | 16.23% |  |
| C | 7253 | 5341 | 57 | 57 | 0.79% | 1.07% |  |
| D | 7253 | 5341 | 417 | 417 | 5.75% | 7.81% |  |
Top three noisy pixels from each quadrant. If the there are fewer than three noisy pixels in the level2.evt file, extra rows are filled as -1
| Pixel properties | Quadrant properties | ||||||
|---|---|---|---|---|---|---|---|
| Quadrant | DetID | PixID | Counts | Sigma | Mean | Median | Sigma |
| A | 15 | 169 | 24462 | 171.46 | 692 | 680 | 138.7 |
| A | 13 | 6 | 11911 | 80.97 | 692 | 680 | 138.7 |
| A | 13 | 254 | 8463 | 56.11 | 692 | 680 | 138.7 |
| B | 5 | 172 | 2243252 | 19314.54 | 620 | 606 | 116.1 |
| B | 0 | 219 | 619667 | 5331.59 | 620 | 606 | 116.1 |
| B | 0 | 230 | 16326 | 135.39 | 620 | 606 | 116.1 |
| C | 10 | 49 | 272770 | 1823.95 | 656 | 663 | 149.2 |
| C | 15 | 214 | 234792 | 1569.38 | 656 | 663 | 149.2 |
| C | 1 | 23 | 166090 | 1108.87 | 656 | 663 | 149.2 |
| D | 8 | 195 | 1952782 | 12400.26 | 638 | 620 | 157.4 |
| D | 7 | 223 | 510970 | 3241.78 | 638 | 620 | 157.4 |
| D | 12 | 218 | 499958 | 3171.83 | 638 | 620 | 157.4 |
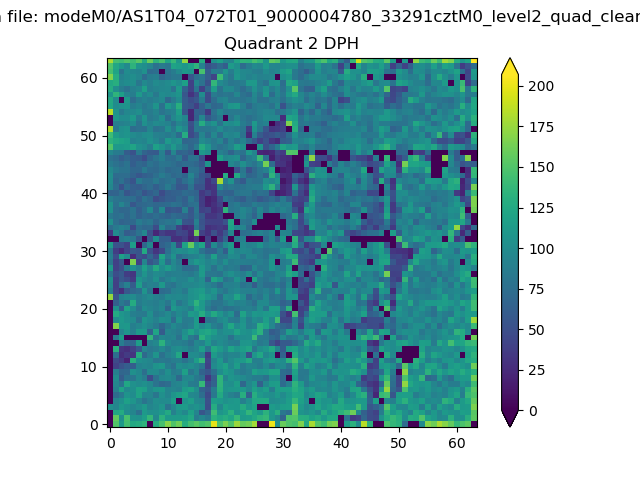
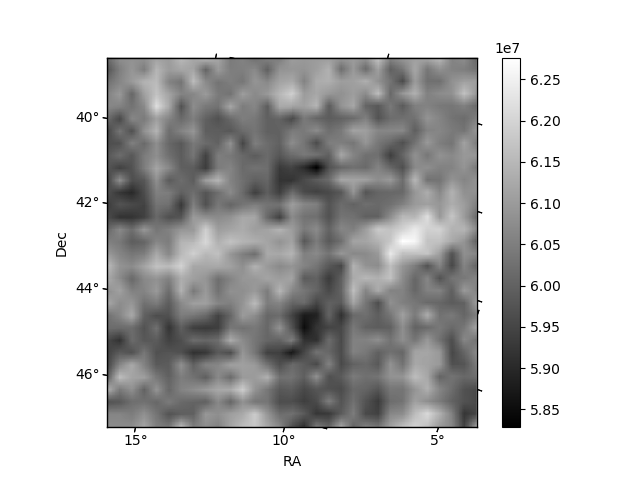
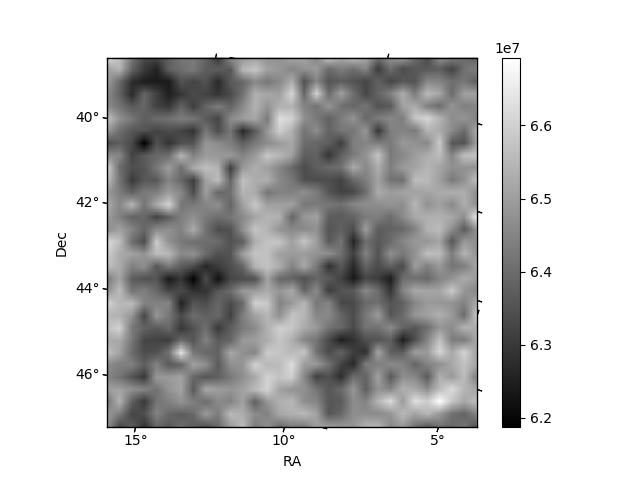
Histogram calculated using DETX and DETY for each event in the final _common_clean file
| Quadrant A | 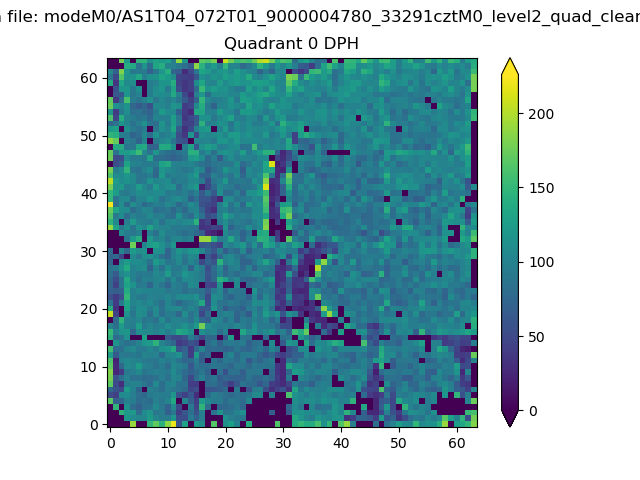 |
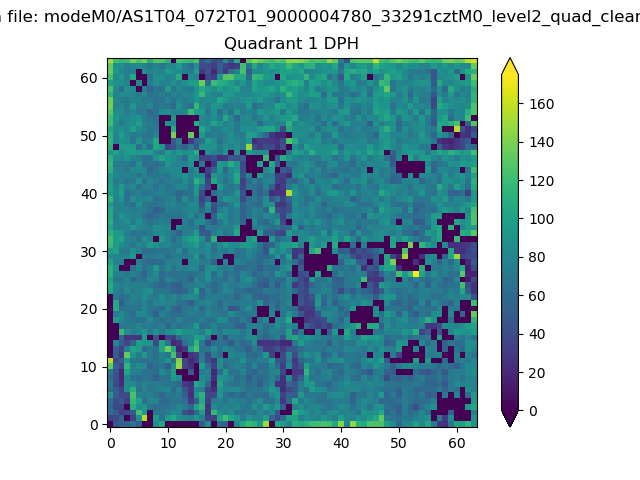 |
Quadrant B |
|---|---|---|---|
| Quadrant D | 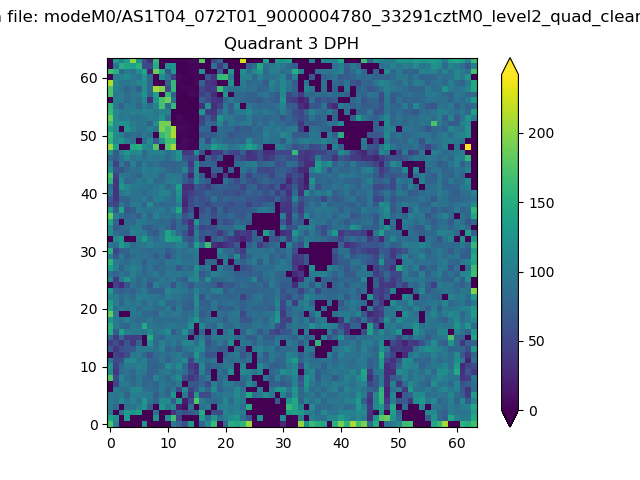 |
 |
Quadrant C |
| Plot type | Count rate plots | Images |
|---|---|---|
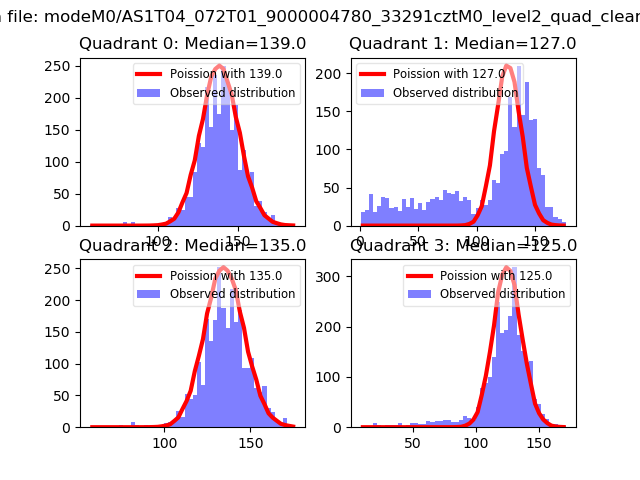
| Comparison with Poisson distribution Blue bars denote a histogram of data divided into 1 sec bins. Red curve is a Poisson curve with rate = median count rate of data. |
 |
 |
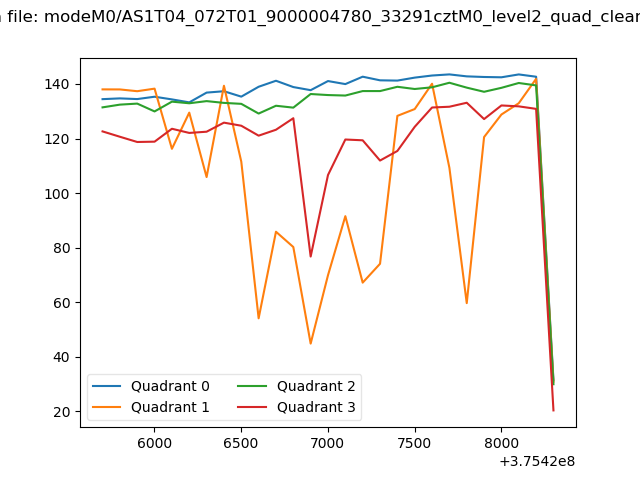
| Quadrant-wise count rates Data is divided into 100 sec bins |
 |
|
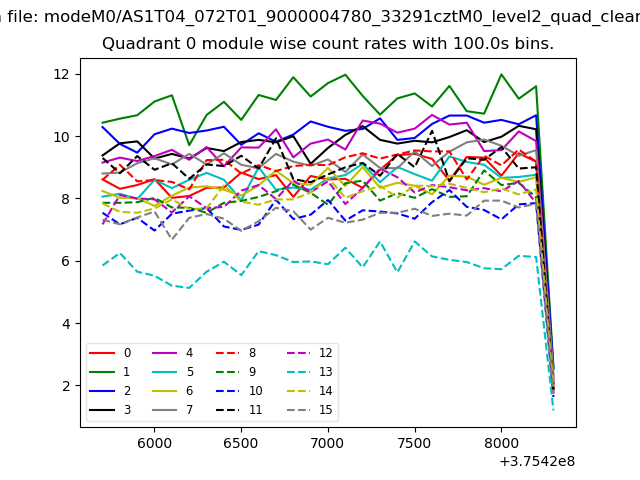
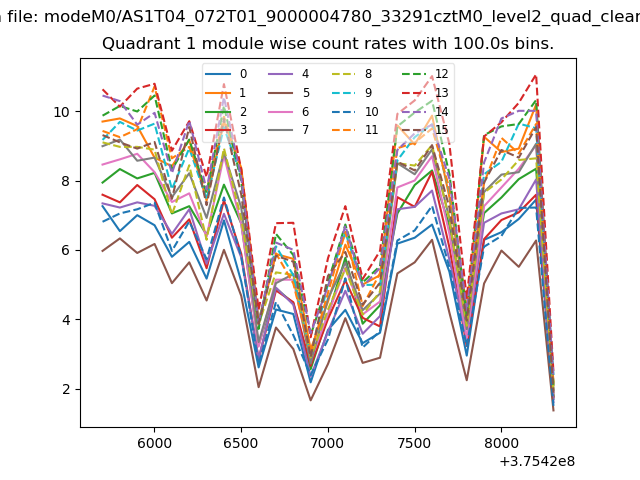
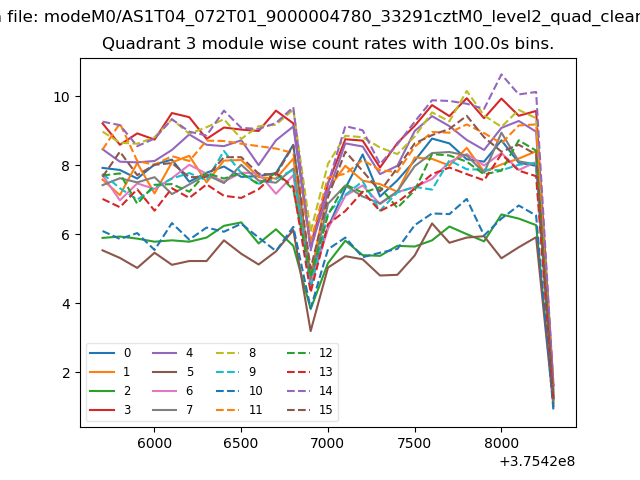
| Module-wise count rates for Quadrant A Data is divided into 100 sec bins |
 |
 |
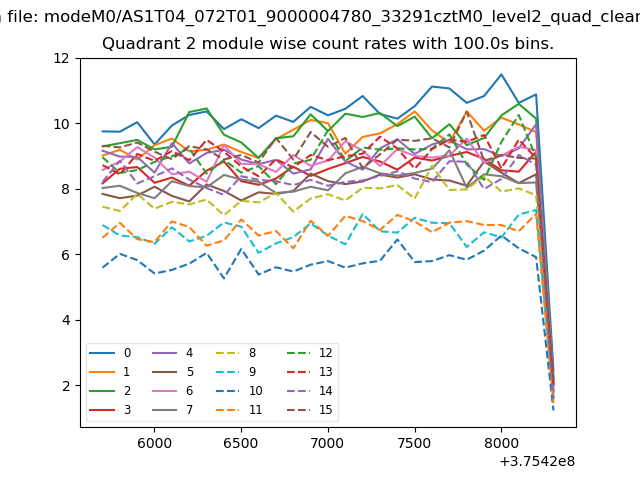
| Module-wise count rates for Quadrant B Data is divided into 100 sec bins |
 |
 |
| Module-wise count rates for Quadrant C Data is divided into 100 sec bins |
 |
 |
| Module-wise count rates for Quadrant D Data is divided into 100 sec bins |
 |
 |
| Parameter | Plot |
|---|---|
| CZT HV Monitor | 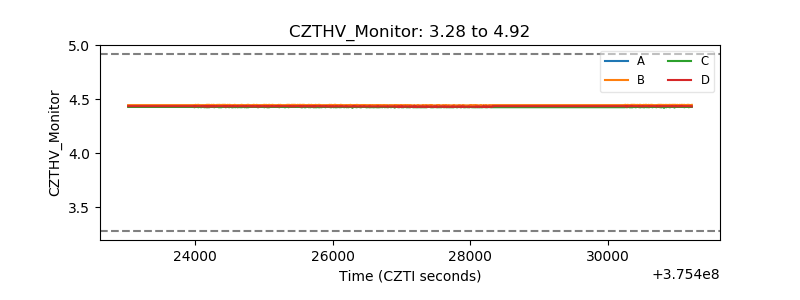 |
| D_VDD | 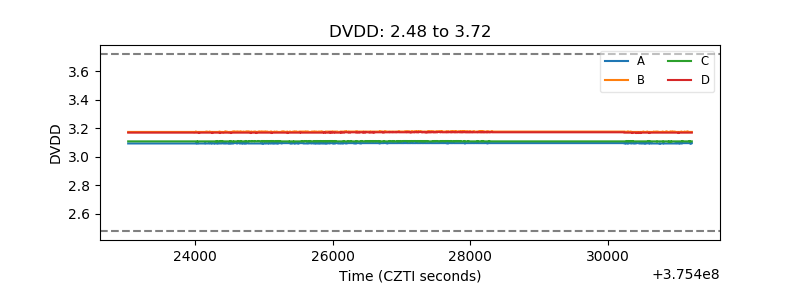 |
| Temperature 1 |  |
| Veto HV Monitor | 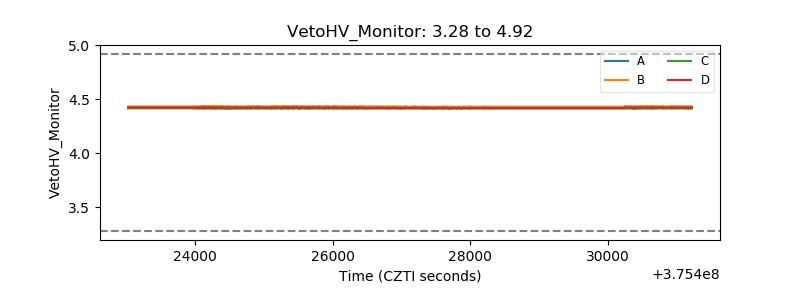 |
| Veto LLD | 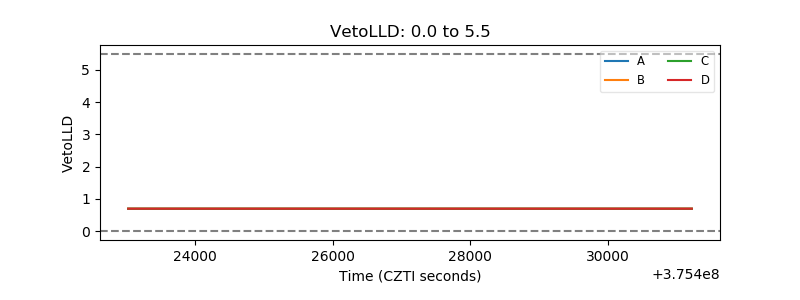 |
| Alpha Counter | 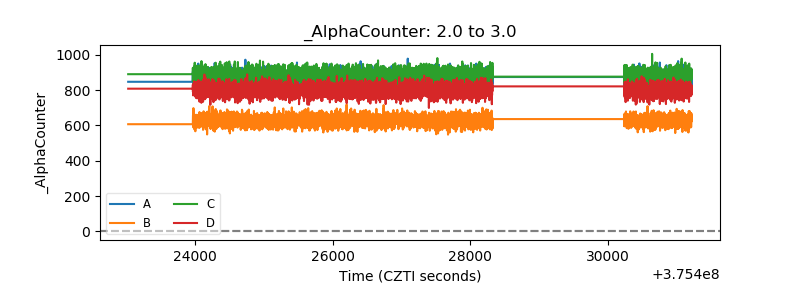 |
| _CPM_Rate | 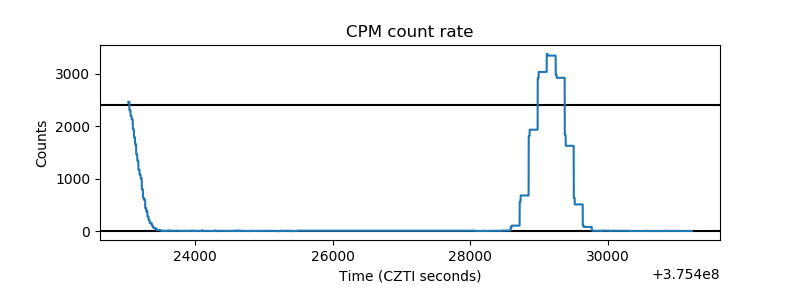 |
| CZT Counter | 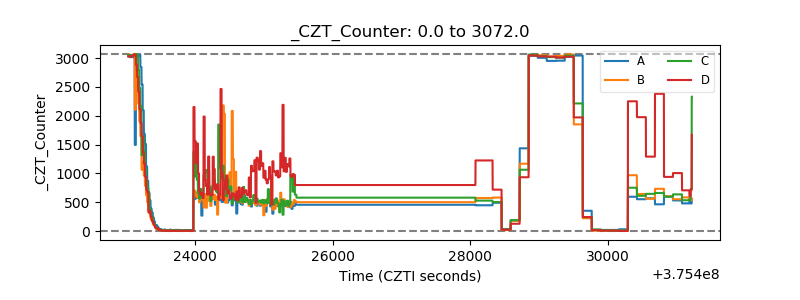 |
| +2.5 Volts monitor | 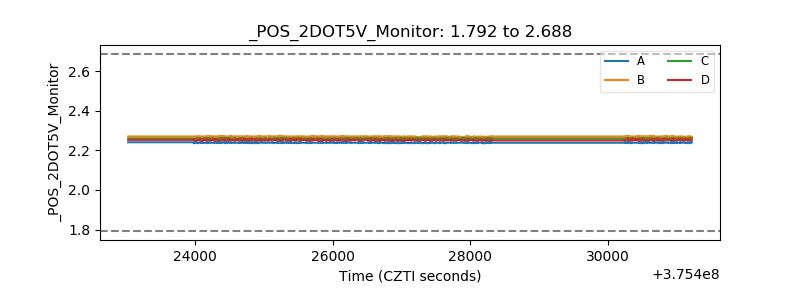 |
| +5 Volts monitor | 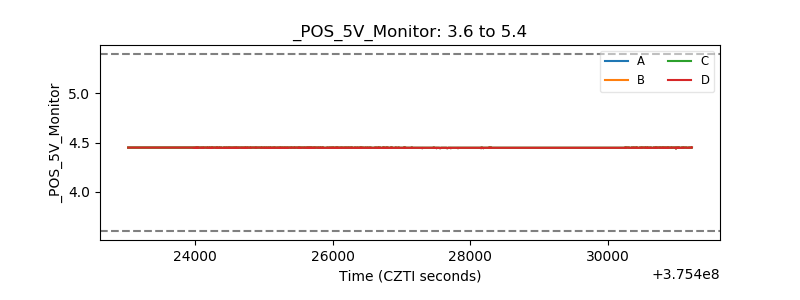 |
| _ROLL_ROT | 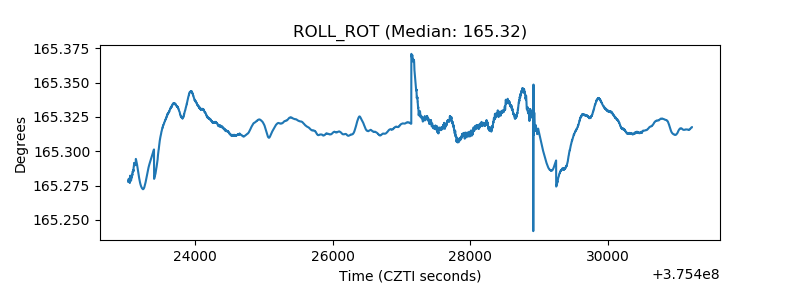 |
| _Roll_DEC | 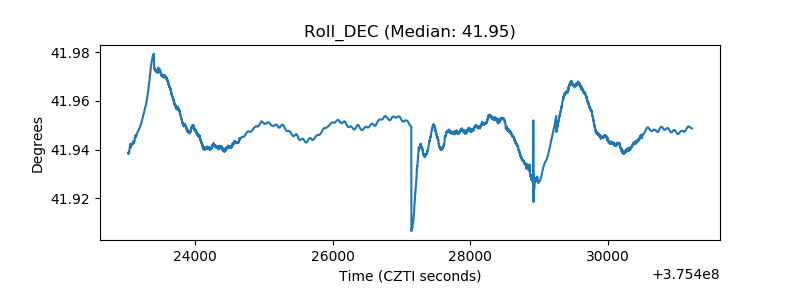 |
| _Roll_RA | 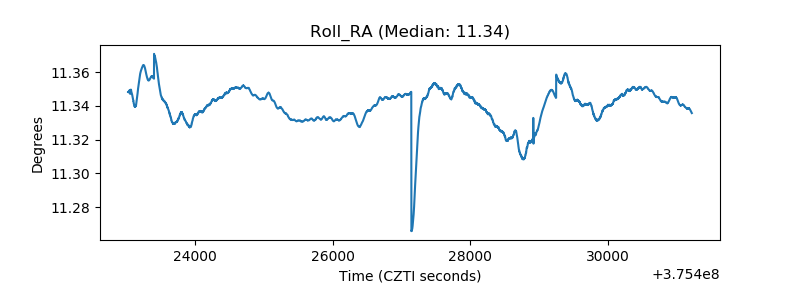 |
| Veto Counter | 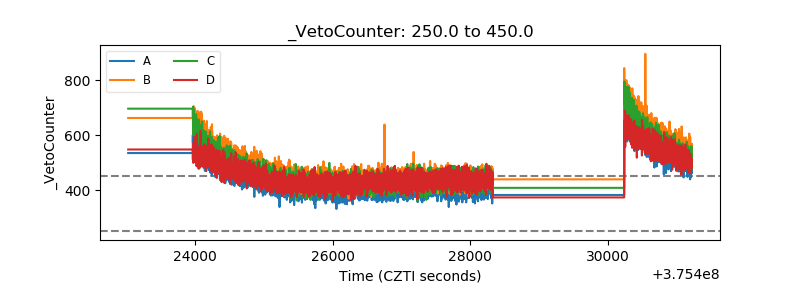 |