| Param | Original file | Final file |
|---|---|---|
| Filename | modeM0/AS1T04_072T01_9000004780_33292cztM0_level2.evt | modeM0/AS1T04_072T01_9000004780_33292cztM0_level2_quad_clean.evt |
| Size (bytes) | 578,998,080 | 66,320,640 |
| Size | 552.2 MB | 63.2 MB |
| Events in quadrant A | 2,717,173 | 435,972 |
| Events in quadrant B | 3,985,237 | 427,514 |
| Events in quadrant C | 4,782,919 | 407,070 |
| Events in quadrant D | 5,706,579 | 381,127 |
| Mode SS | |||
|---|---|---|---|
| Quadrant | BADHDUFLAG | Total packets | Discarded packets |
| A | 0 | 104 | 0 |
| B | 0 | 104 | 0 |
| C | 0 | 104 | 0 |
| D | 0 | 104 | 0 |
| Mode M0 | |||
|---|---|---|---|
| Quadrant | BADHDUFLAG | Total packets | Discarded packets |
| A | 0 | 10953 | 3 |
| B | 0 | 15121 | 2 |
| C | 0 | 17979 | 2 |
| D | 0 | 20667 | 2 |
| Mode M9 | |||
|---|---|---|---|
| Quadrant | BADHDUFLAG | Total packets | Discarded packets |
| A | 0 | 24 | 0 |
| B | 0 | 24 | 0 |
| C | 0 | 24 | 0 |
| D | 0 | 25 | 0 |
| Quadrant | Total seconds | Saturated seconds | Saturation percentage |
|---|---|---|---|
| A | 5080 | 8 | 0.157480% |
| B | 5080 | 353 | 6.948819% |
| C | 5080 | 439 | 8.641732% |
| D | 5080 | 457 | 8.996063% |
Noise dominated data is calculated using 1-second bins in cleaned event files. If a bin has >2000 counts, and if more than 50% of those come from <1% of pixels, then it is considered to be noise-dominated and hence unusable.
| Quadrant | # 1 sec bins | Bins with >0 counts | Bins with >2000 counts | High rate bins dominated by noise | Noise dominated (total time) | Noise dominated (detector-on time) | Marked lightcurve |
|---|---|---|---|---|---|---|---|
| A | 7113 | 5081 | 0 | 0 | 0.00% | 0.00% | 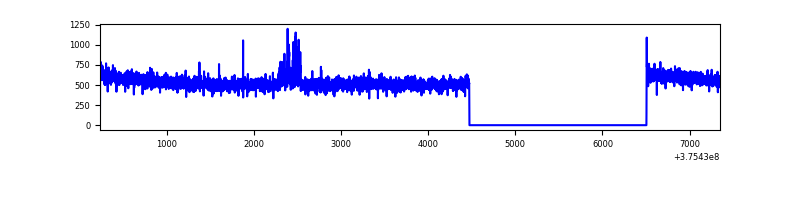 |
| B | 7113 | 5081 | 195 | 195 | 2.74% | 3.84% | 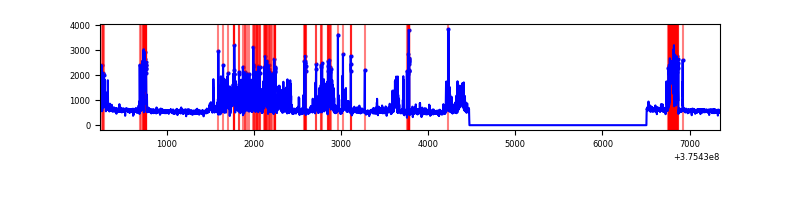 |
| C | 7113 | 5081 | 372 | 372 | 5.23% | 7.32% | 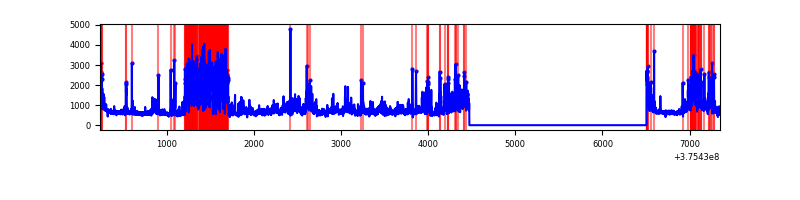 |
| D | 7113 | 5081 | 357 | 357 | 5.02% | 7.03% | 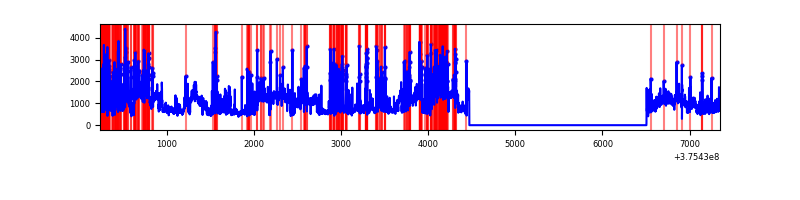 |
Top three noisy pixels from each quadrant. If the there are fewer than three noisy pixels in the level2.evt file, extra rows are filled as -1
| Pixel properties | Quadrant properties | ||||||
|---|---|---|---|---|---|---|---|
| Quadrant | DetID | PixID | Counts | Sigma | Mean | Median | Sigma |
| A | 15 | 169 | 32827 | 236.83 | 691 | 681 | 135.7 |
| A | 13 | 6 | 8206 | 55.44 | 691 | 681 | 135.7 |
| A | 13 | 254 | 8135 | 54.92 | 691 | 681 | 135.7 |
| B | 0 | 219 | 790911 | 6361.17 | 668 | 653 | 124.2 |
| B | 5 | 172 | 506907 | 4075.09 | 668 | 653 | 124.2 |
| B | 12 | 111 | 13950 | 107.03 | 668 | 653 | 124.2 |
| C | 10 | 49 | 1844790 | 12876.27 | 633 | 641 | 143.2 |
| C | 15 | 214 | 216720 | 1508.71 | 633 | 641 | 143.2 |
| C | 0 | 10 | 119853 | 832.37 | 633 | 641 | 143.2 |
| D | 8 | 195 | 1677733 | 10703.92 | 638 | 622 | 156.7 |
| D | 12 | 218 | 835209 | 5326.63 | 638 | 622 | 156.7 |
| D | 7 | 223 | 179052 | 1138.8 | 638 | 622 | 156.7 |
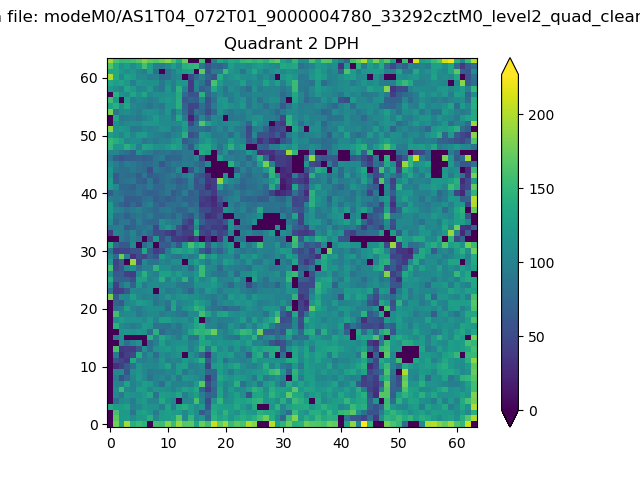
Histogram calculated using DETX and DETY for each event in the final _common_clean file
| Quadrant A | 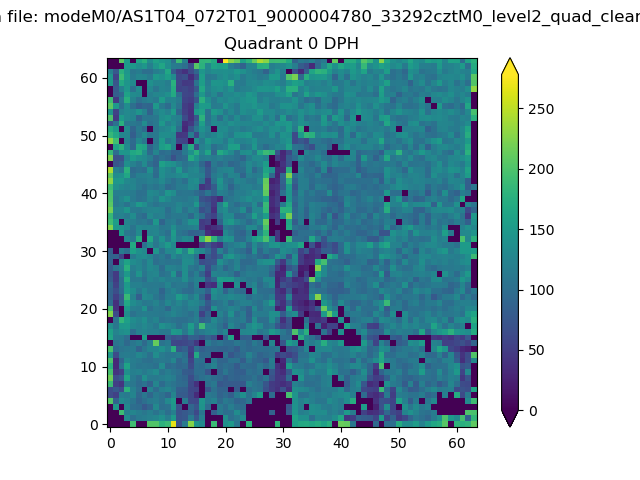 |
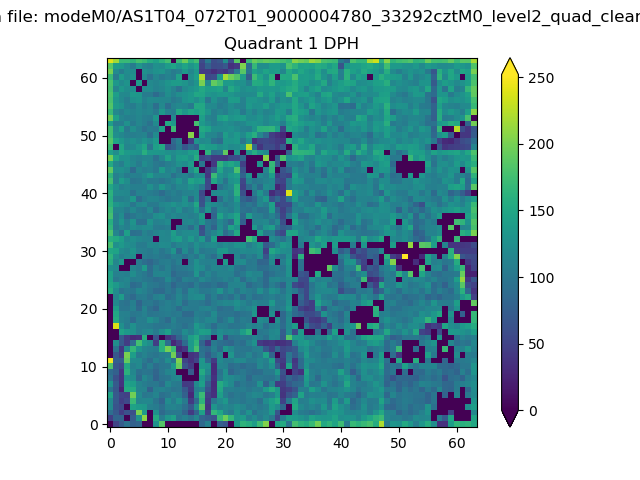 |
Quadrant B |
|---|---|---|---|
| Quadrant D | 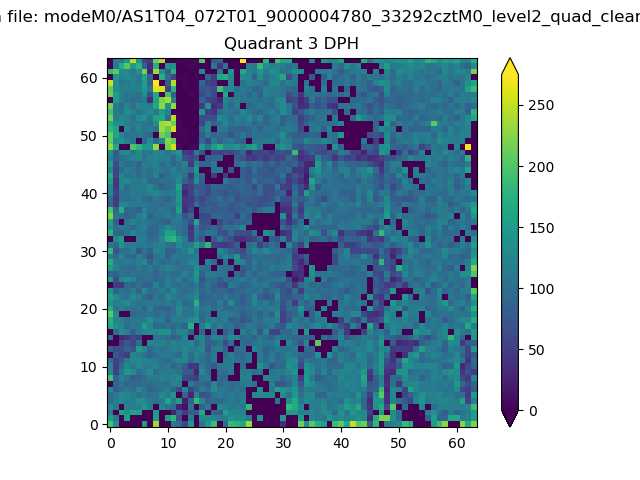 |
 |
Quadrant C |
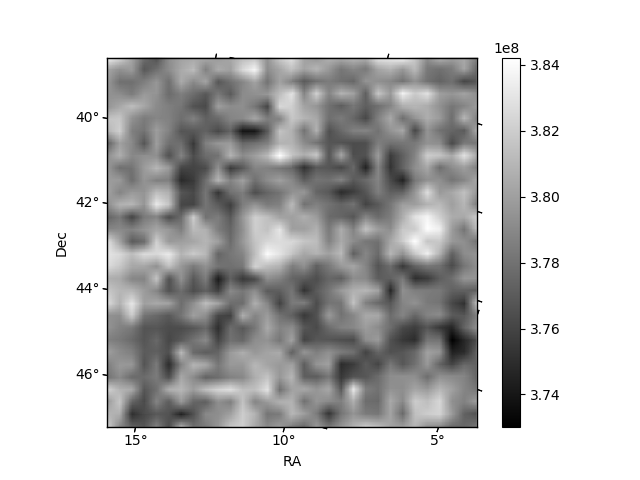
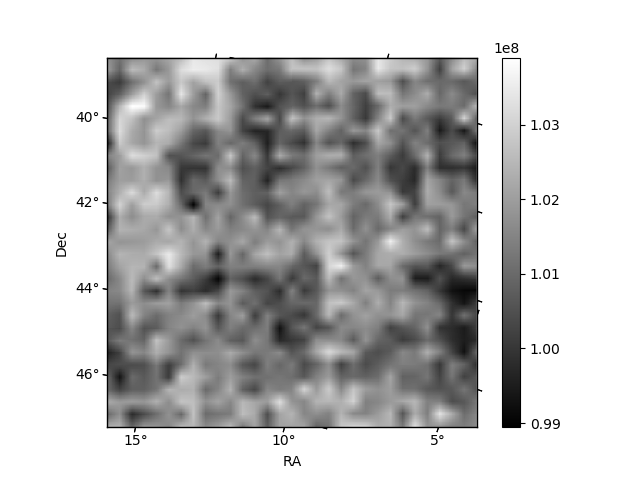
| Plot type | Count rate plots | Images |
|---|---|---|
| Comparison with Poisson distribution Blue bars denote a histogram of data divided into 1 sec bins. Red curve is a Poisson curve with rate = median count rate of data. |
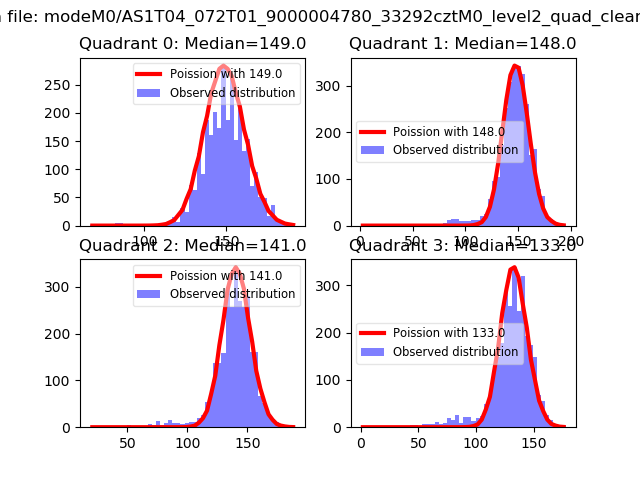 |
 |
| Quadrant-wise count rates Data is divided into 100 sec bins |
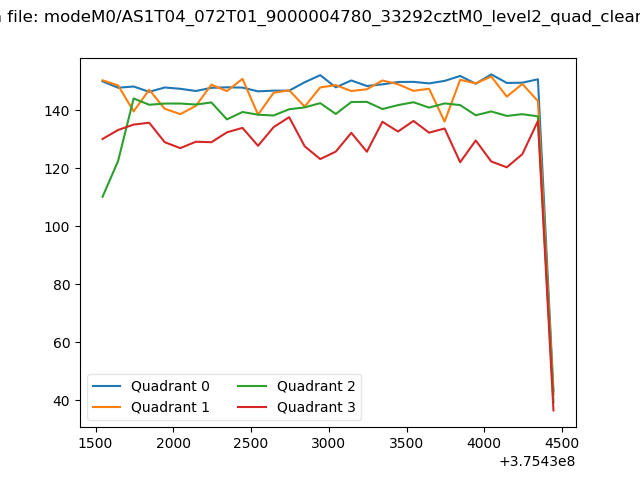 |
|
| Module-wise count rates for Quadrant A Data is divided into 100 sec bins |
 |
 |
| Module-wise count rates for Quadrant B Data is divided into 100 sec bins |
 |
 |
| Module-wise count rates for Quadrant C Data is divided into 100 sec bins |
 |
 |
| Module-wise count rates for Quadrant D Data is divided into 100 sec bins |
 |
 |
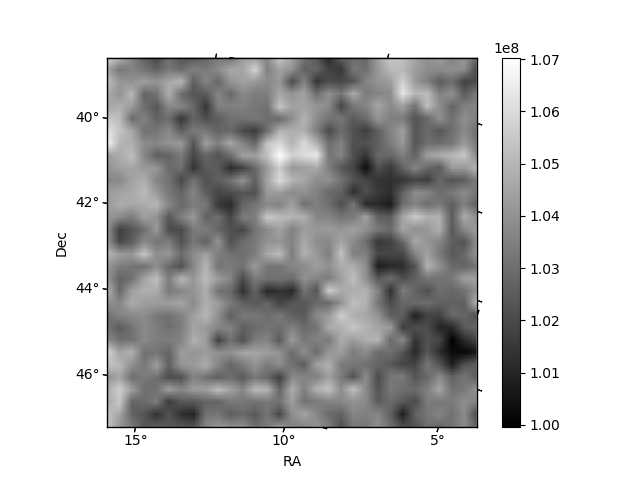
| Parameter | Plot |
|---|---|
| CZT HV Monitor |  |
| D_VDD | 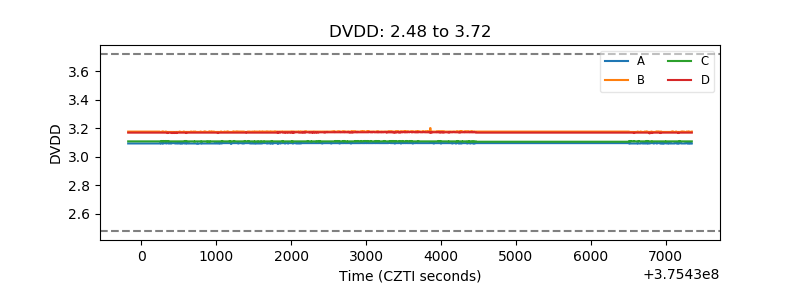 |
| Temperature 1 | 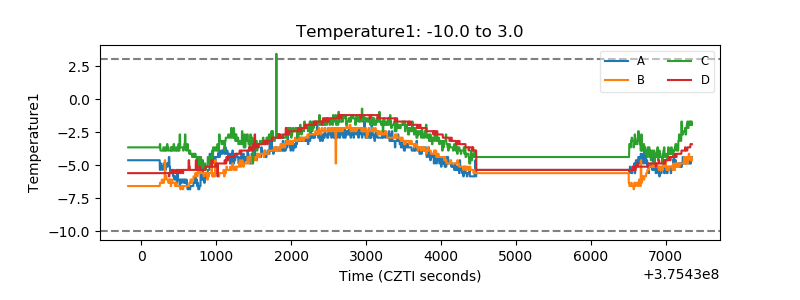 |
| Veto HV Monitor | 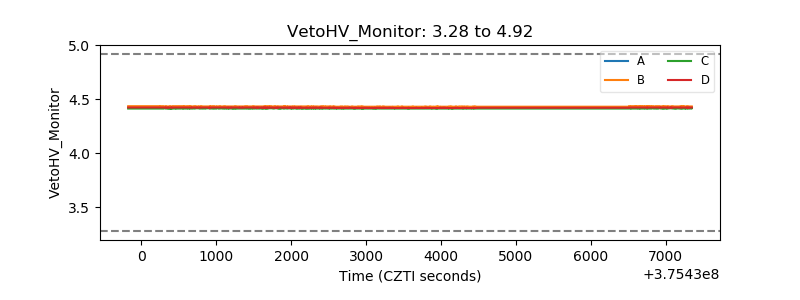 |
| Veto LLD | 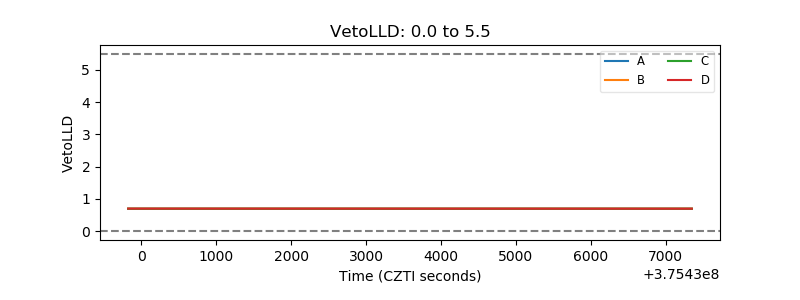 |
| Alpha Counter | 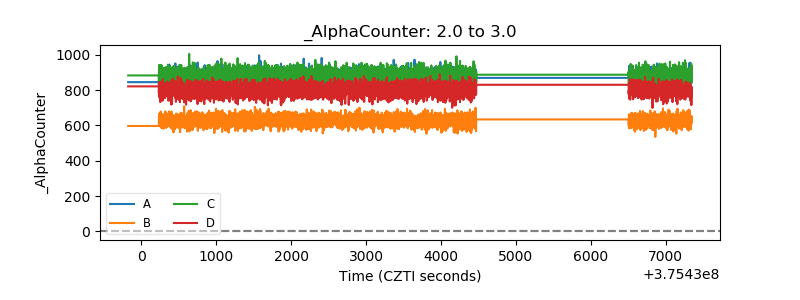 |
| _CPM_Rate | 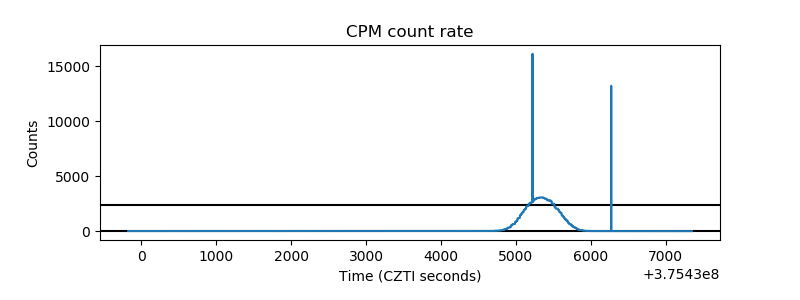 |
| CZT Counter | 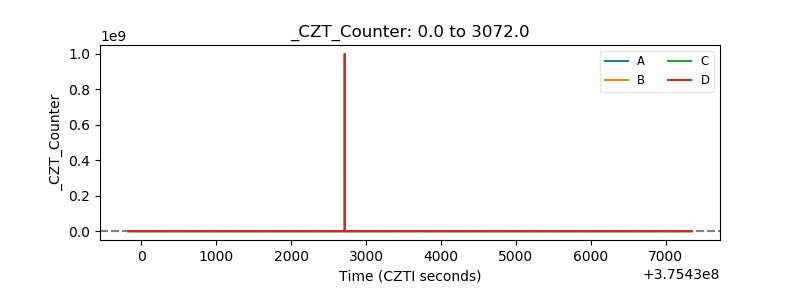 |
| +2.5 Volts monitor |  |
| +5 Volts monitor |  |
| _ROLL_ROT |  |
| _Roll_DEC | 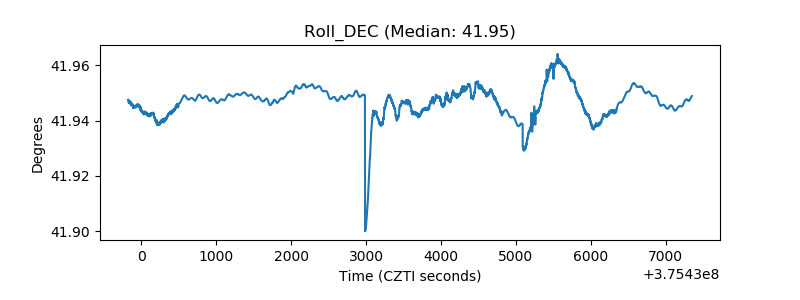 |
| _Roll_RA | 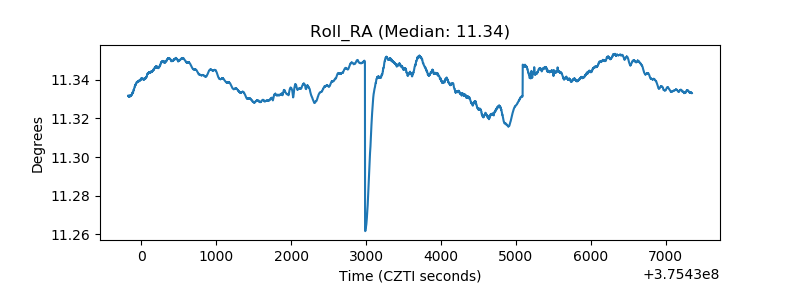 |
| Veto Counter |  |