| Param | Original file | Final file |
|---|---|---|
| Filename | modeM0/AS1T04_072T01_9000004780_33293cztM0_level2.evt | modeM0/AS1T04_072T01_9000004780_33293cztM0_level2_quad_clean.evt |
| Size (bytes) | 573,134,400 | 80,706,240 |
| Size | 546.6 MB | 77.0 MB |
| Events in quadrant A | 2,643,687 | 559,305 |
| Events in quadrant B | 4,030,820 | 534,884 |
| Events in quadrant C | 4,131,714 | 528,290 |
| Events in quadrant D | 6,218,271 | 475,358 |
| Mode SS | |||
|---|---|---|---|
| Quadrant | BADHDUFLAG | Total packets | Discarded packets |
| A | 0 | 102 | 0 |
| B | 0 | 102 | 0 |
| C | 0 | 102 | 0 |
| D | 0 | 102 | 0 |
| Mode M0 | |||
|---|---|---|---|
| Quadrant | BADHDUFLAG | Total packets | Discarded packets |
| A | 0 | 10627 | 3 |
| B | 0 | 15138 | 2 |
| C | 0 | 15525 | 2 |
| D | 0 | 22066 | 2 |
| Mode M9 | |||
|---|---|---|---|
| Quadrant | BADHDUFLAG | Total packets | Discarded packets |
| A | 0 | 31 | 0 |
| B | 0 | 31 | 0 |
| C | 0 | 31 | 0 |
| D | 0 | 32 | 0 |
| Quadrant | Total seconds | Saturated seconds | Saturation percentage |
|---|---|---|---|
| A | 4925 | 6 | 0.121827% |
| B | 4925 | 444 | 9.015228% |
| C | 4925 | 165 | 3.350254% |
| D | 4925 | 712 | 14.456853% |
Noise dominated data is calculated using 1-second bins in cleaned event files. If a bin has >2000 counts, and if more than 50% of those come from <1% of pixels, then it is considered to be noise-dominated and hence unusable.
| Quadrant | # 1 sec bins | Bins with >0 counts | Bins with >2000 counts | High rate bins dominated by noise | Noise dominated (total time) | Noise dominated (detector-on time) | Marked lightcurve |
|---|---|---|---|---|---|---|---|
| A | 7048 | 4926 | 0 | 0 | 0.00% | 0.00% | 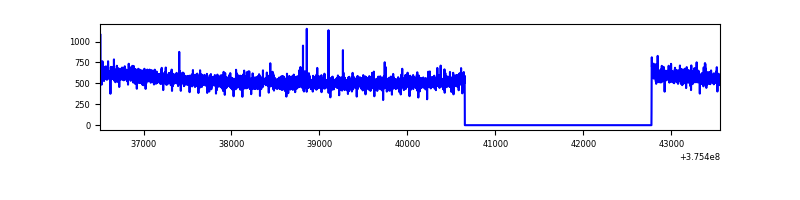 |
| B | 7048 | 4926 | 328 | 328 | 4.65% | 6.66% | 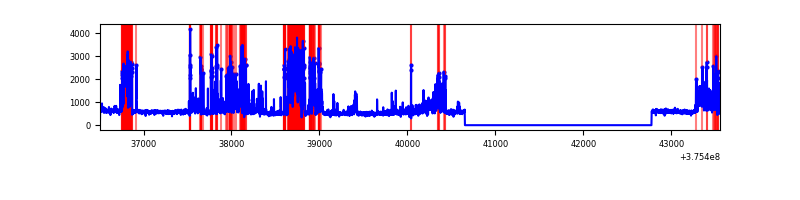 |
| C | 7048 | 4926 | 122 | 122 | 1.73% | 2.48% | 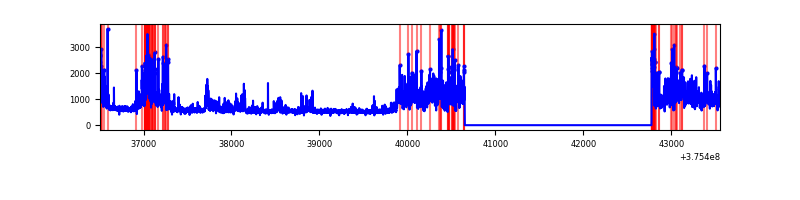 |
| D | 7048 | 4926 | 620 | 620 | 8.80% | 12.59% | 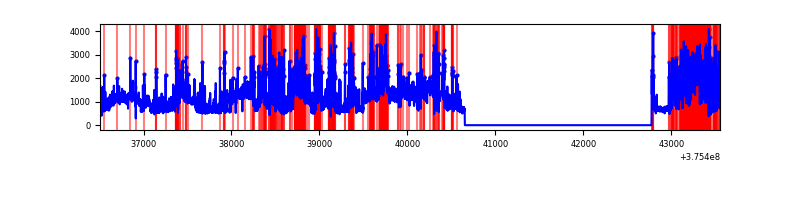 |
Top three noisy pixels from each quadrant. If the there are fewer than three noisy pixels in the level2.evt file, extra rows are filled as -1
| Pixel properties | Quadrant properties | ||||||
|---|---|---|---|---|---|---|---|
| Quadrant | DetID | PixID | Counts | Sigma | Mean | Median | Sigma |
| A | 13 | 6 | 9184 | 63.49 | 679 | 668 | 134.1 |
| A | 15 | 169 | 8528 | 58.6 | 679 | 668 | 134.1 |
| A | 13 | 254 | 7628 | 51.89 | 679 | 668 | 134.1 |
| B | 5 | 172 | 1092608 | 9166.47 | 643 | 629 | 119.1 |
| B | 0 | 219 | 322374 | 2700.84 | 643 | 629 | 119.1 |
| B | 15 | 85 | 21002 | 171.02 | 643 | 629 | 119.1 |
| C | 10 | 49 | 1063278 | 7460.56 | 629 | 637 | 142.4 |
| C | 15 | 214 | 217380 | 1521.7 | 629 | 637 | 142.4 |
| C | 0 | 10 | 147993 | 1034.55 | 629 | 637 | 142.4 |
| D | 8 | 195 | 1666878 | 11032.3 | 615 | 598 | 151.0 |
| D | 12 | 218 | 949861 | 6284.99 | 615 | 598 | 151.0 |
| D | 7 | 223 | 519903 | 3438.27 | 615 | 598 | 151.0 |
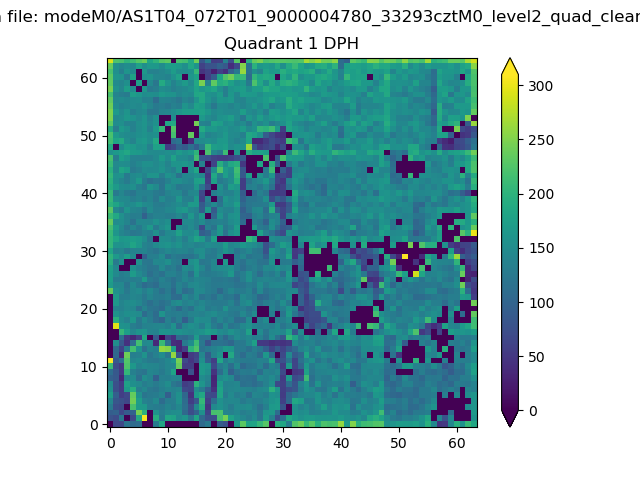
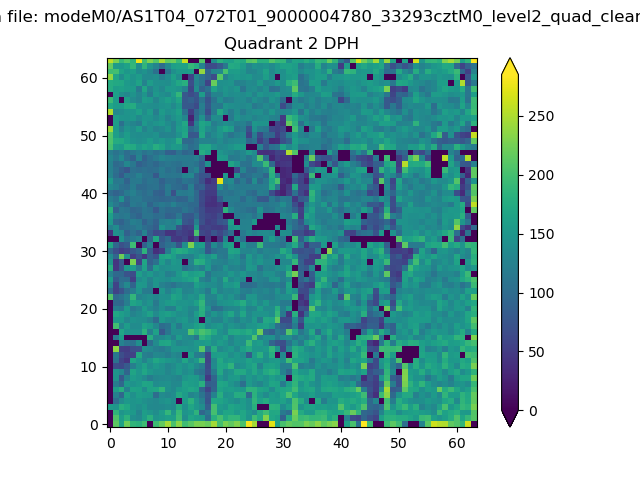
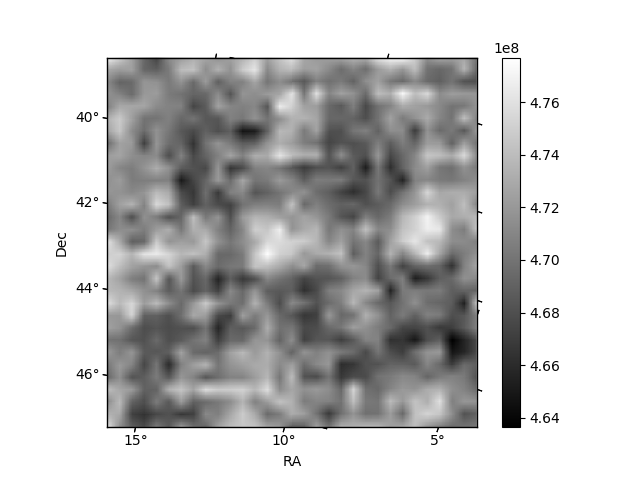
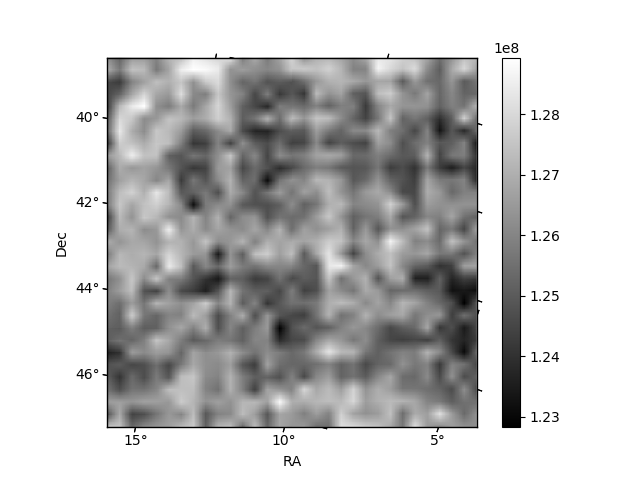
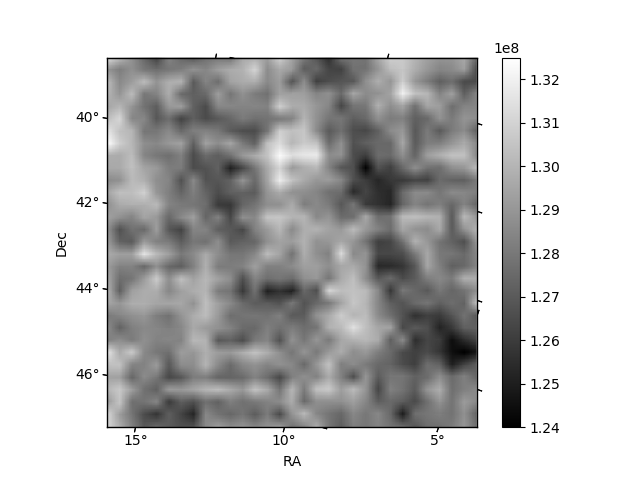
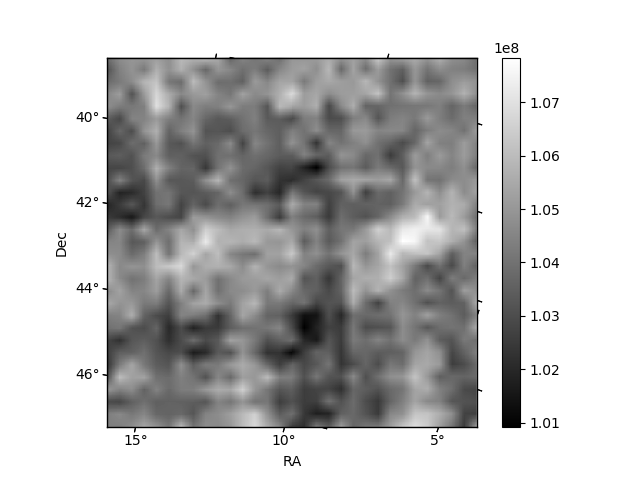
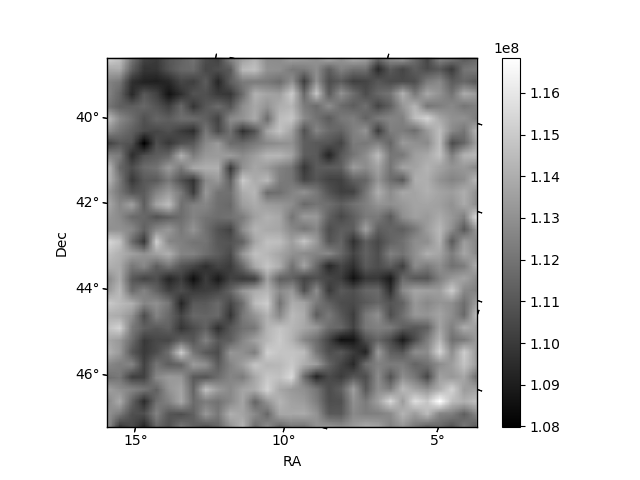
Histogram calculated using DETX and DETY for each event in the final _common_clean file
| Quadrant A |  |
 |
Quadrant B |
|---|---|---|---|
| Quadrant D | 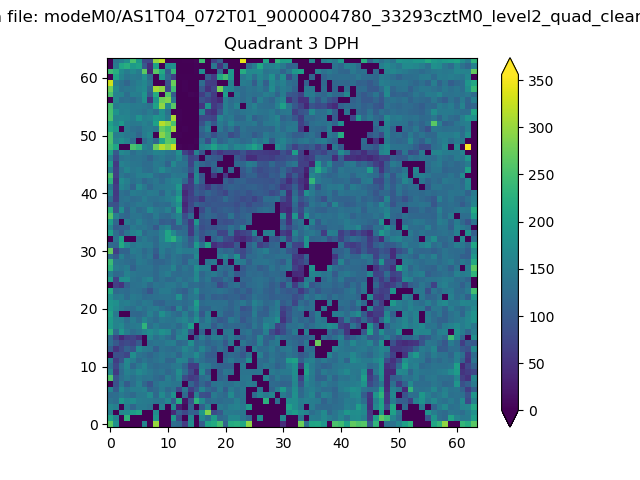 |
 |
Quadrant C |
| Plot type | Count rate plots | Images |
|---|---|---|
| Comparison with Poisson distribution Blue bars denote a histogram of data divided into 1 sec bins. Red curve is a Poisson curve with rate = median count rate of data. |
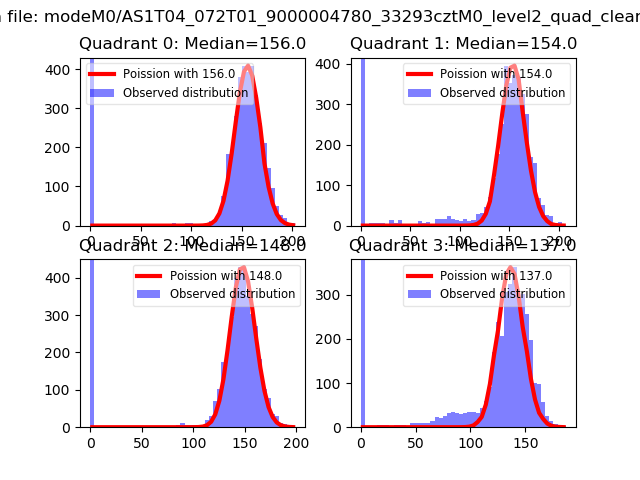 |
 |
| Quadrant-wise count rates Data is divided into 100 sec bins |
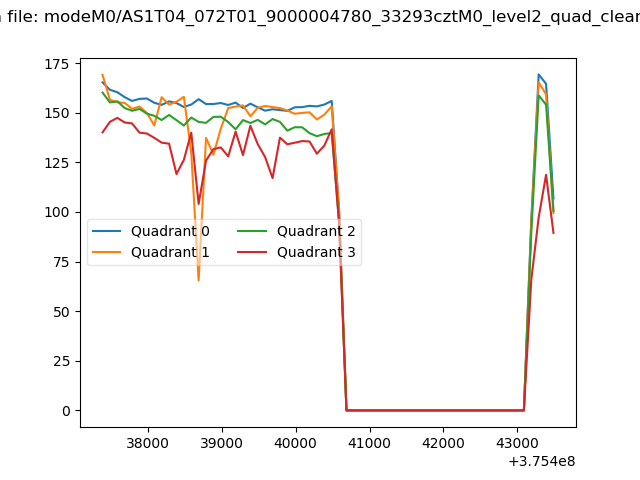 |
|
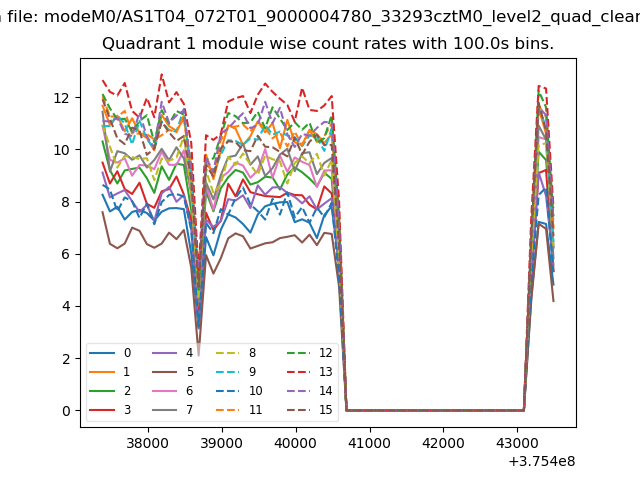
| Module-wise count rates for Quadrant A Data is divided into 100 sec bins |
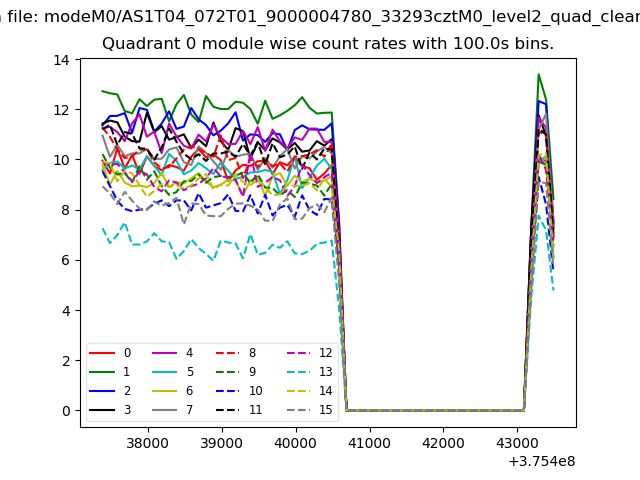 |
 |
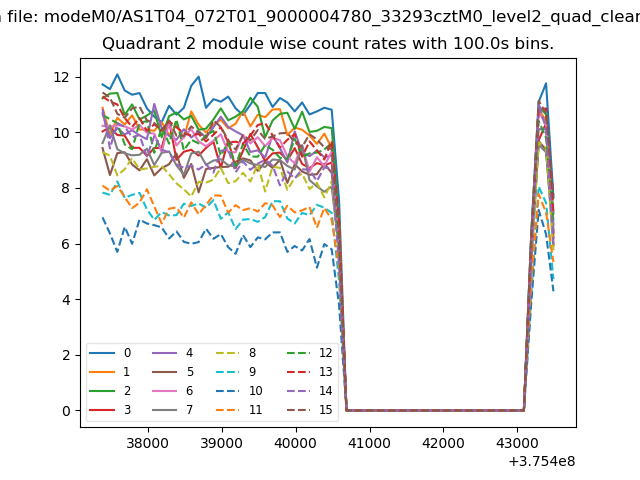
| Module-wise count rates for Quadrant B Data is divided into 100 sec bins |
 |
 |
| Module-wise count rates for Quadrant C Data is divided into 100 sec bins |
 |
 |
| Module-wise count rates for Quadrant D Data is divided into 100 sec bins |
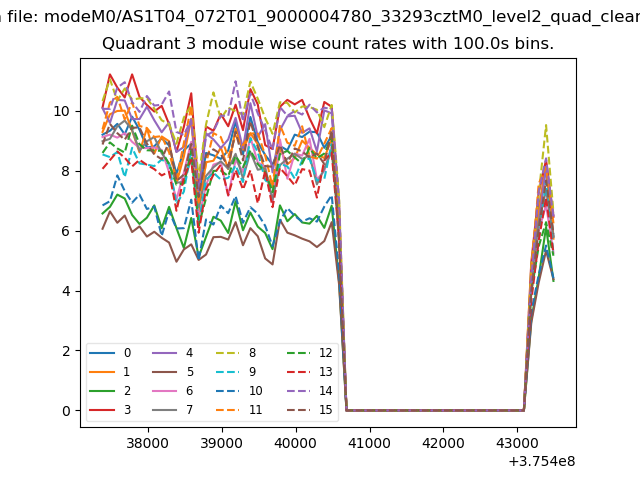 |
 |
| Parameter | Plot |
|---|---|
| CZT HV Monitor | 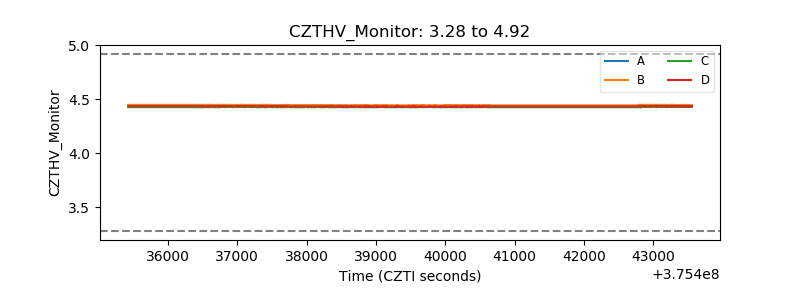 |
| D_VDD | 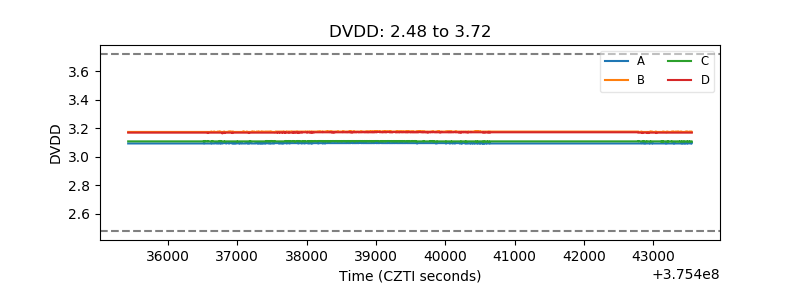 |
| Temperature 1 | 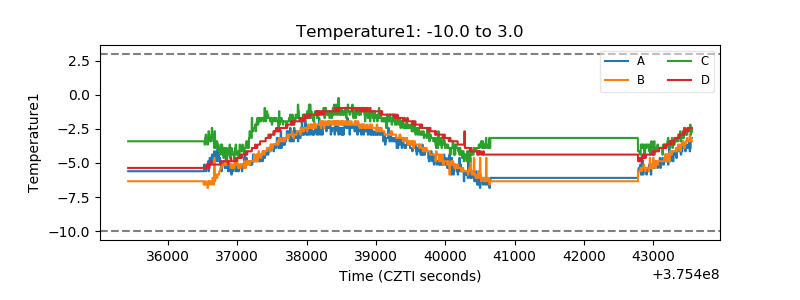 |
| Veto HV Monitor | 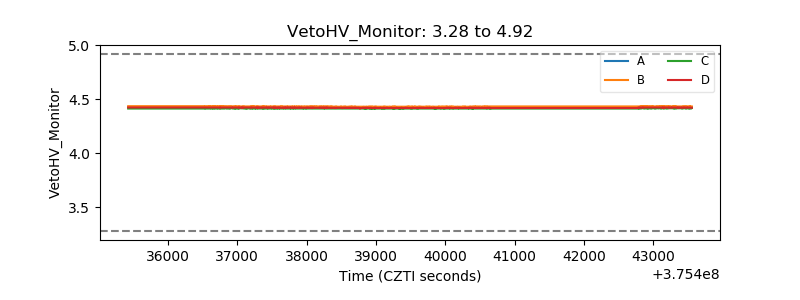 |
| Veto LLD | 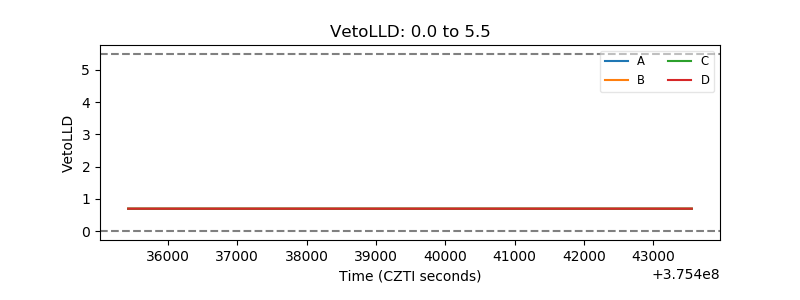 |
| Alpha Counter |  |
| _CPM_Rate | 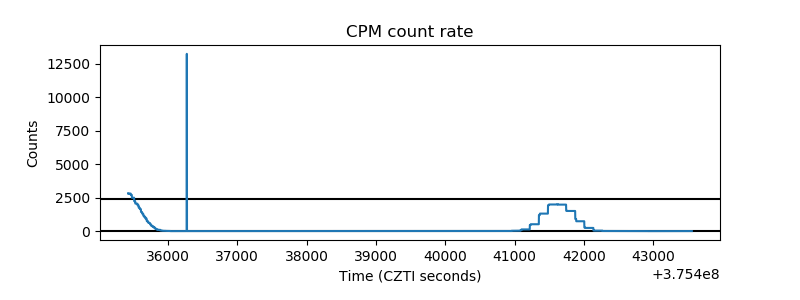 |
| CZT Counter | 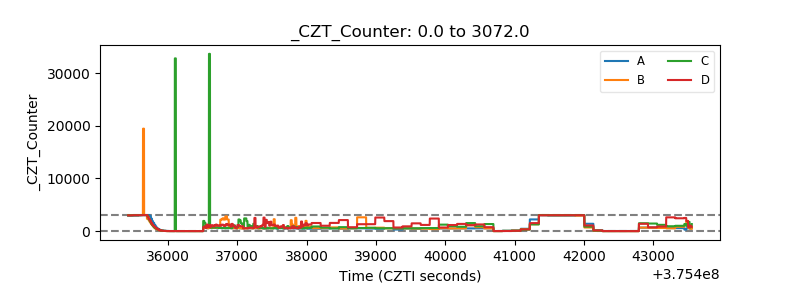 |
| +2.5 Volts monitor |  |
| +5 Volts monitor |  |
| _ROLL_ROT | 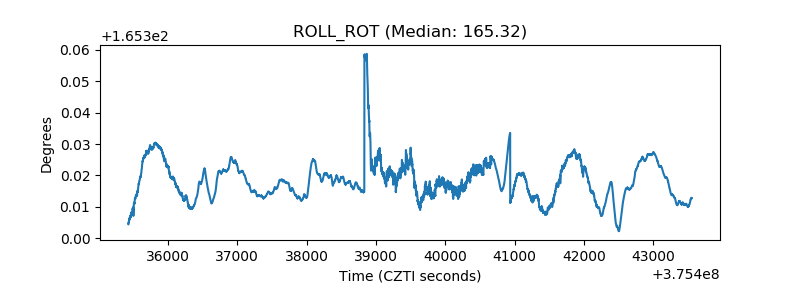 |
| _Roll_DEC | 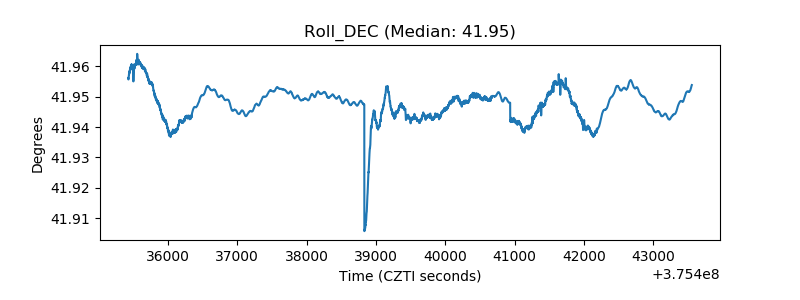 |
| _Roll_RA | 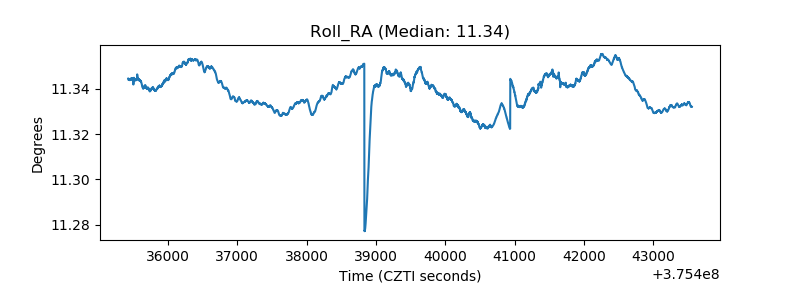 |
| Veto Counter | 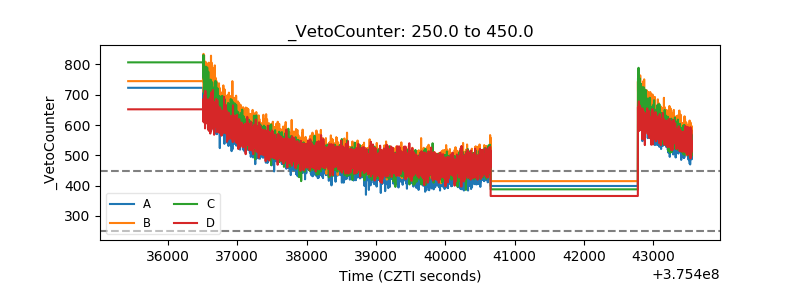 |