| Param | Original file | Final file |
|---|---|---|
| Filename | modeM0/AS1T04_072T01_9000004780_33297cztM0_level2.evt | modeM0/AS1T04_072T01_9000004780_33297cztM0_level2_quad_clean.evt |
| Size (bytes) | 544,239,360 | 75,764,160 |
| Size | 519.0 MB | 72.3 MB |
| Events in quadrant A | 2,664,325 | 502,815 |
| Events in quadrant B | 3,569,463 | 486,678 |
| Events in quadrant C | 3,325,726 | 481,929 |
| Events in quadrant D | 6,538,733 | 425,681 |
| Mode SS | |||
|---|---|---|---|
| Quadrant | BADHDUFLAG | Total packets | Discarded packets |
| A | 0 | 116 | 0 |
| B | 0 | 116 | 0 |
| C | 0 | 116 | 0 |
| D | 0 | 116 | 0 |
| Mode M0 | |||
|---|---|---|---|
| Quadrant | BADHDUFLAG | Total packets | Discarded packets |
| A | 0 | 11454 | 3 |
| B | 0 | 14139 | 2 |
| C | 0 | 13245 | 2 |
| D | 0 | 23423 | 2 |
| Mode M9 | |||
|---|---|---|---|
| Quadrant | BADHDUFLAG | Total packets | Discarded packets |
| A | 0 | 19 | 0 |
| B | 0 | 19 | 0 |
| C | 0 | 19 | 0 |
| D | 0 | 20 | 0 |
| Quadrant | Total seconds | Saturated seconds | Saturation percentage |
|---|---|---|---|
| A | 5671 | 10 | 0.176336% |
| B | 5671 | 183 | 3.226944% |
| C | 5671 | 72 | 1.269617% |
| D | 5671 | 706 | 12.449303% |
Noise dominated data is calculated using 1-second bins in cleaned event files. If a bin has >2000 counts, and if more than 50% of those come from <1% of pixels, then it is considered to be noise-dominated and hence unusable.
| Quadrant | # 1 sec bins | Bins with >0 counts | Bins with >2000 counts | High rate bins dominated by noise | Noise dominated (total time) | Noise dominated (detector-on time) | Marked lightcurve |
|---|---|---|---|---|---|---|---|
| A | 7163 | 5672 | 0 | 0 | 0.00% | 0.00% | 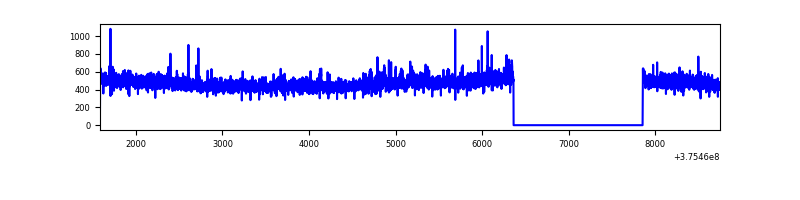 |
| B | 7163 | 5672 | 124 | 124 | 1.73% | 2.19% | 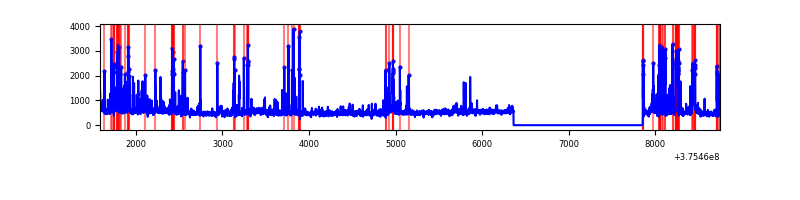 |
| C | 7163 | 5672 | 58 | 58 | 0.81% | 1.02% | 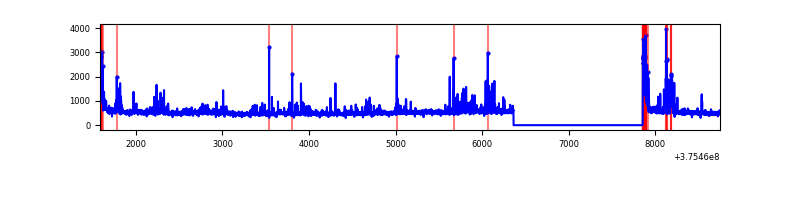 |
| D | 7163 | 5672 | 653 | 653 | 9.12% | 11.51% | 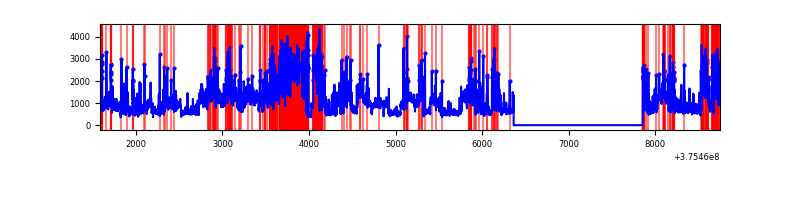 |
Top three noisy pixels from each quadrant. If the there are fewer than three noisy pixels in the level2.evt file, extra rows are filled as -1
| Pixel properties | Quadrant properties | ||||||
|---|---|---|---|---|---|---|---|
| Quadrant | DetID | PixID | Counts | Sigma | Mean | Median | Sigma |
| A | 15 | 47 | 52445 | 389.05 | 666 | 653 | 133.1 |
| A | 15 | 169 | 28812 | 211.52 | 666 | 653 | 133.1 |
| A | 13 | 254 | 8030 | 55.41 | 666 | 653 | 133.1 |
| B | 5 | 172 | 687907 | 5548.31 | 656 | 639 | 123.9 |
| B | 0 | 219 | 99617 | 799.05 | 656 | 639 | 123.9 |
| B | 0 | 230 | 63404 | 506.7 | 656 | 639 | 123.9 |
| C | 1 | 23 | 273716 | 1836.26 | 642 | 647 | 148.7 |
| C | 15 | 214 | 257475 | 1727.05 | 642 | 647 | 148.7 |
| C | 0 | 10 | 168711 | 1130.15 | 642 | 647 | 148.7 |
| D | 8 | 195 | 1809846 | 11130.56 | 613 | 599 | 162.5 |
| D | 7 | 223 | 1367781 | 8410.96 | 613 | 599 | 162.5 |
| D | 2 | 249 | 224465 | 1377.23 | 613 | 599 | 162.5 |
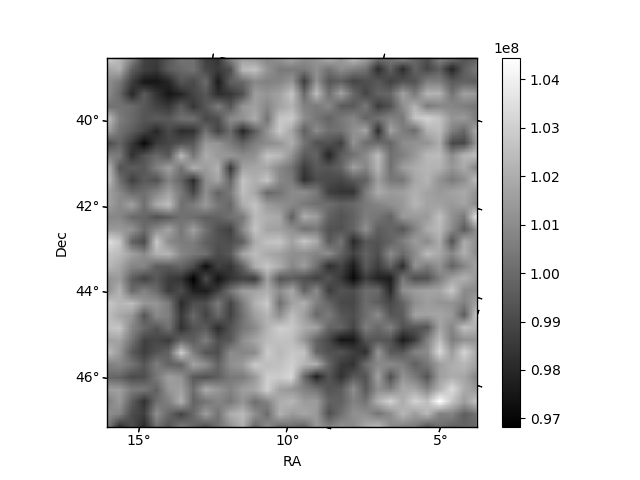
Histogram calculated using DETX and DETY for each event in the final _common_clean file
| Quadrant A | 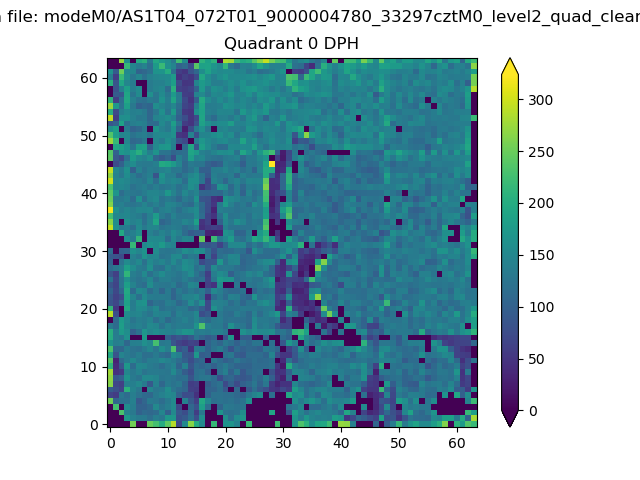 |
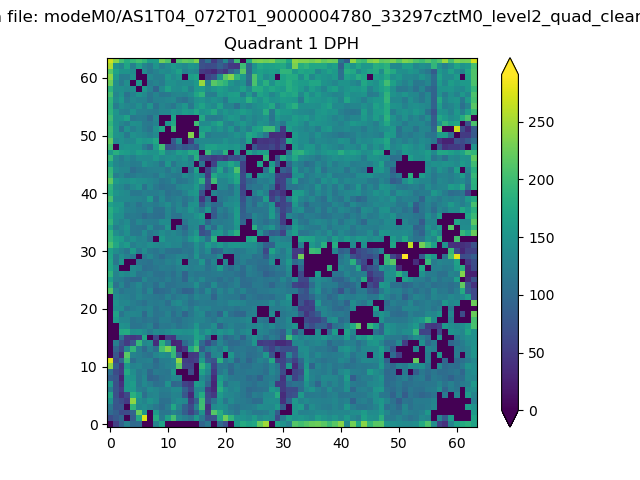 |
Quadrant B |
|---|---|---|---|
| Quadrant D | 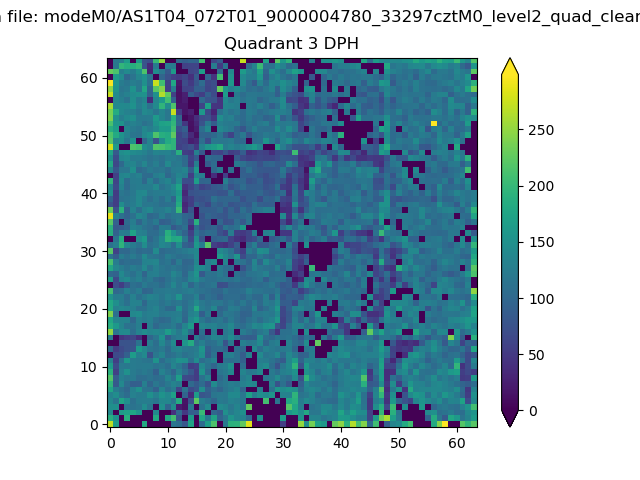 |
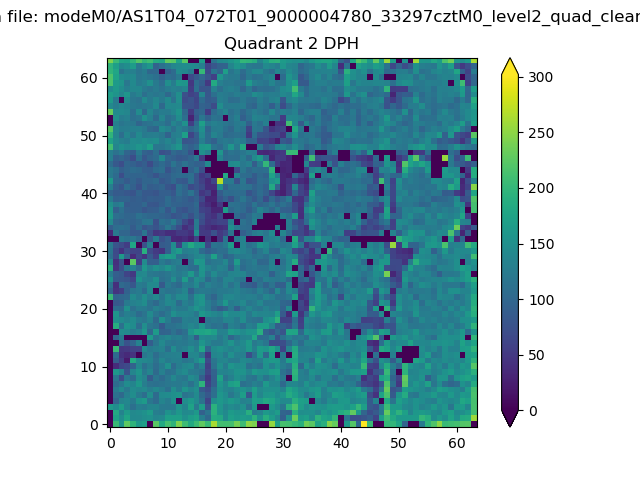 |
Quadrant C |
| Plot type | Count rate plots | Images |
|---|---|---|
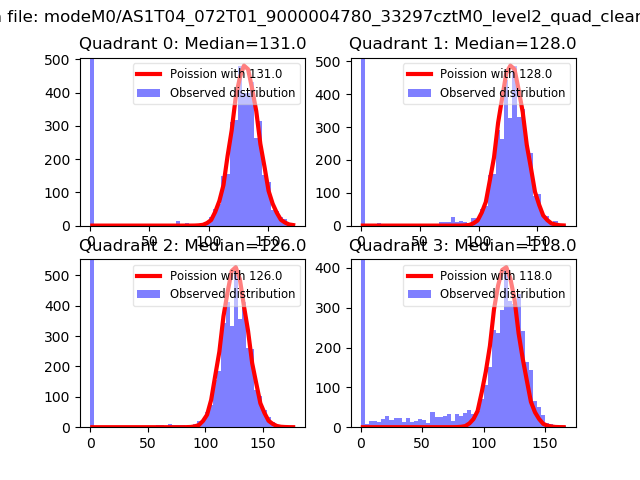
| Comparison with Poisson distribution Blue bars denote a histogram of data divided into 1 sec bins. Red curve is a Poisson curve with rate = median count rate of data. |
 |
 |
| Quadrant-wise count rates Data is divided into 100 sec bins |
 |
|
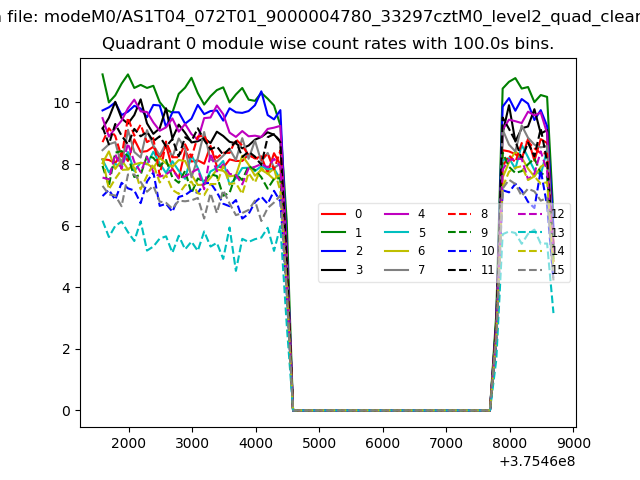
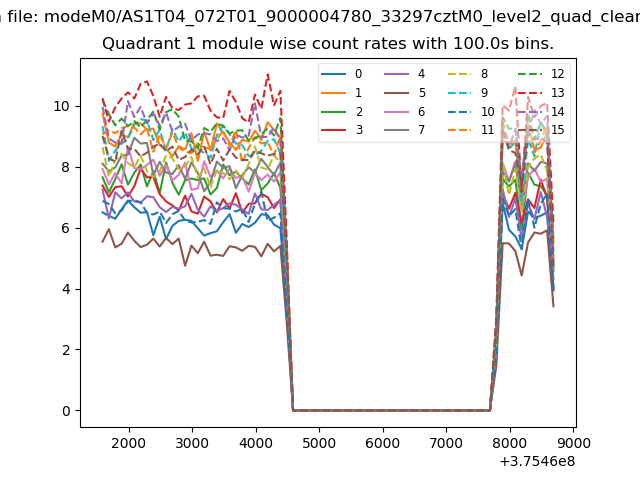
| Module-wise count rates for Quadrant A Data is divided into 100 sec bins |
 |
 |
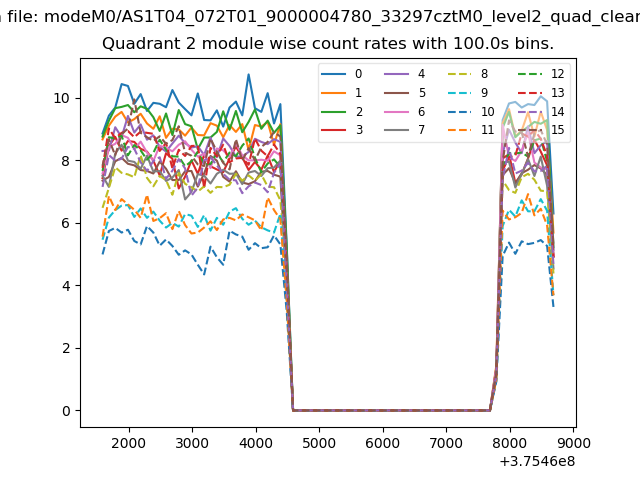
| Module-wise count rates for Quadrant B Data is divided into 100 sec bins |
 |
 |
| Module-wise count rates for Quadrant C Data is divided into 100 sec bins |
 |
 |
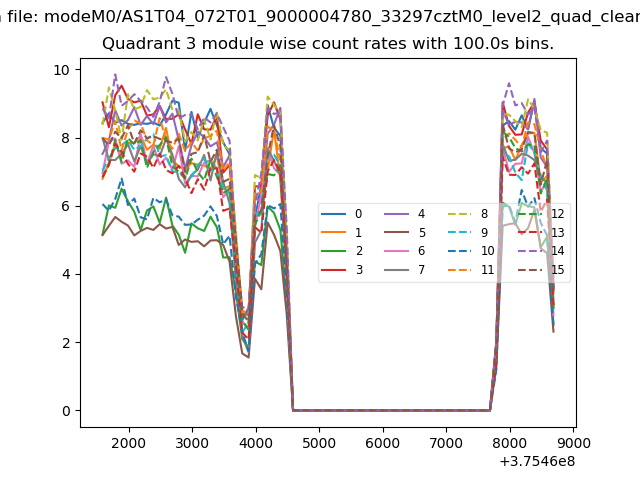
| Module-wise count rates for Quadrant D Data is divided into 100 sec bins |
 |
 |
| Parameter | Plot |
|---|---|
| CZT HV Monitor | 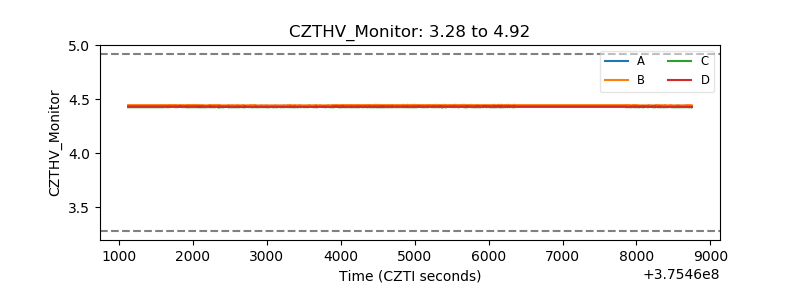 |
| D_VDD | 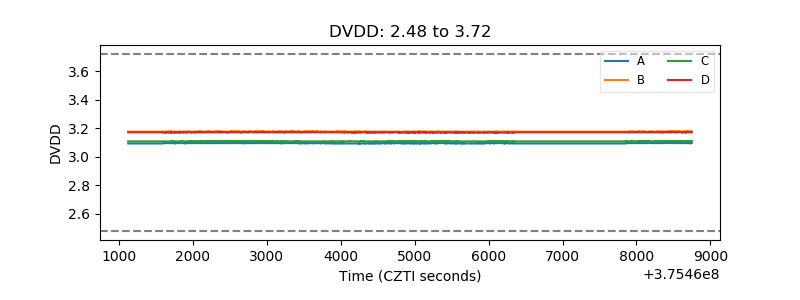 |
| Temperature 1 | 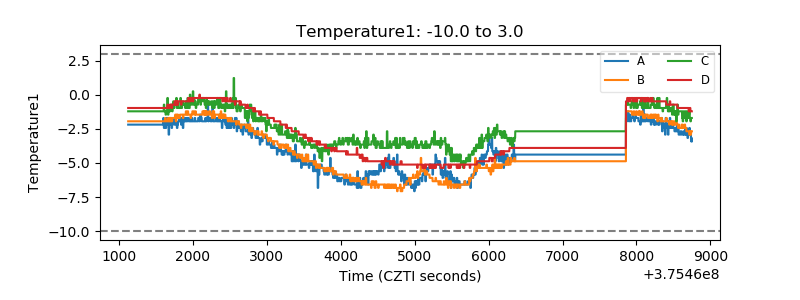 |
| Veto HV Monitor |  |
| Veto LLD |  |
| Alpha Counter | 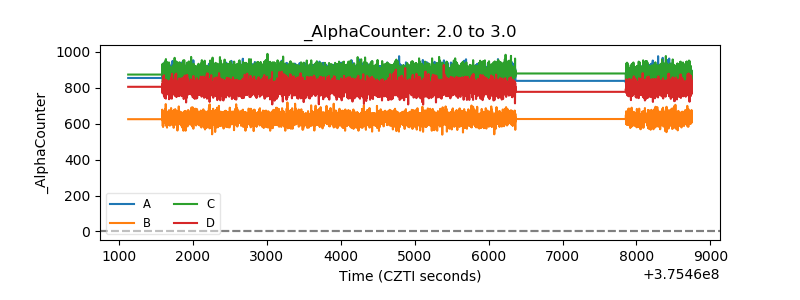 |
| _CPM_Rate |  |
| CZT Counter | 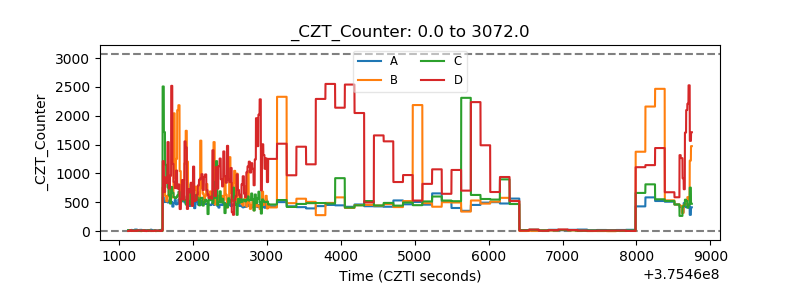 |
| +2.5 Volts monitor |  |
| +5 Volts monitor |  |
| _ROLL_ROT | 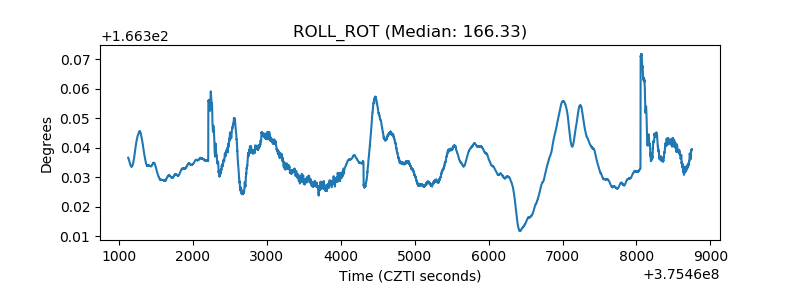 |
| _Roll_DEC | 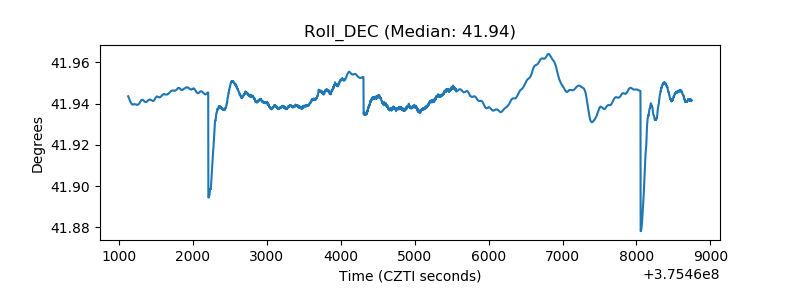 |
| _Roll_RA | 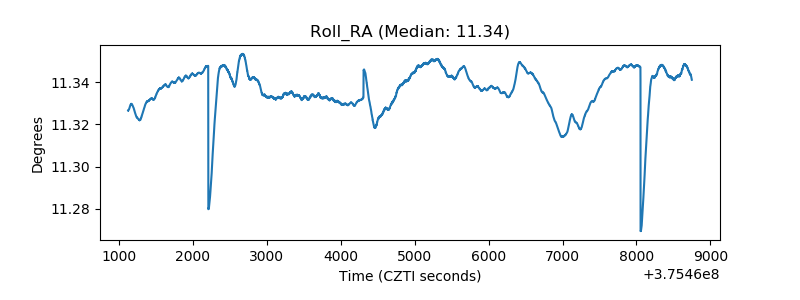 |
| Veto Counter | 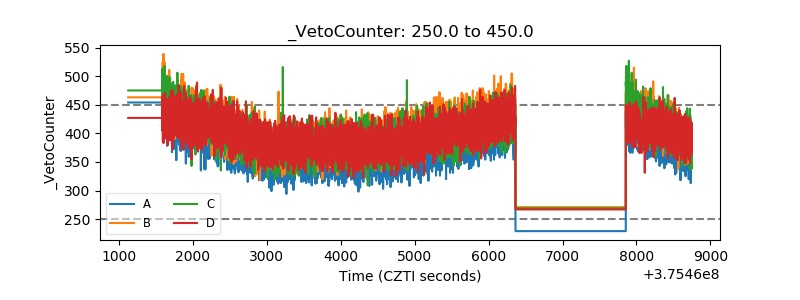 |