| Param | Original file | Final file |
|---|---|---|
| Filename | modeM0/AS1T04_072T01_9000004780_33298cztM0_level2.evt | modeM0/AS1T04_072T01_9000004780_33298cztM0_level2_quad_clean.evt |
| Size (bytes) | 590,071,680 | 74,770,560 |
| Size | 562.7 MB | 71.3 MB |
| Events in quadrant A | 2,735,062 | 495,171 |
| Events in quadrant B | 3,622,725 | 478,207 |
| Events in quadrant C | 3,502,279 | 474,579 |
| Events in quadrant D | 7,611,435 | 403,810 |
| Mode SS | |||
|---|---|---|---|
| Quadrant | BADHDUFLAG | Total packets | Discarded packets |
| A | 0 | 118 | 0 |
| B | 0 | 118 | 0 |
| C | 0 | 118 | 0 |
| D | 0 | 118 | 0 |
| Mode M0 | |||
|---|---|---|---|
| Quadrant | BADHDUFLAG | Total packets | Discarded packets |
| A | 0 | 11909 | 2 |
| B | 0 | 14470 | 1 |
| C | 0 | 13955 | 1 |
| D | 0 | 26786 | 1 |
| Mode M9 | |||
|---|---|---|---|
| Quadrant | BADHDUFLAG | Total packets | Discarded packets |
| A | 0 | 20 | 0 |
| B | 0 | 20 | 0 |
| C | 0 | 20 | 0 |
| D | 0 | 21 | 0 |
| Quadrant | Total seconds | Saturated seconds | Saturation percentage |
|---|---|---|---|
| A | 5900 | 6 | 0.101695% |
| B | 5900 | 210 | 3.559322% |
| C | 5900 | 107 | 1.813559% |
| D | 5900 | 1163 | 19.711864% |
Noise dominated data is calculated using 1-second bins in cleaned event files. If a bin has >2000 counts, and if more than 50% of those come from <1% of pixels, then it is considered to be noise-dominated and hence unusable.
| Quadrant | # 1 sec bins | Bins with >0 counts | Bins with >2000 counts | High rate bins dominated by noise | Noise dominated (total time) | Noise dominated (detector-on time) | Marked lightcurve |
|---|---|---|---|---|---|---|---|
| A | 7213 | 5901 | 1 | 1 | 0.01% | 0.02% | 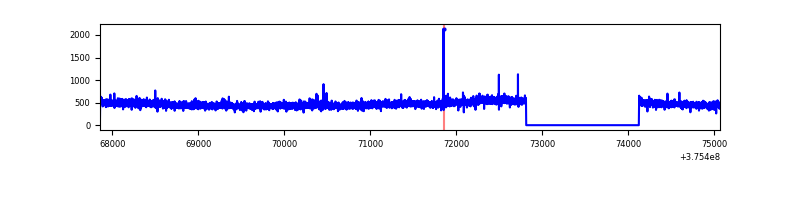 |
| B | 7213 | 5901 | 147 | 147 | 2.04% | 2.49% | 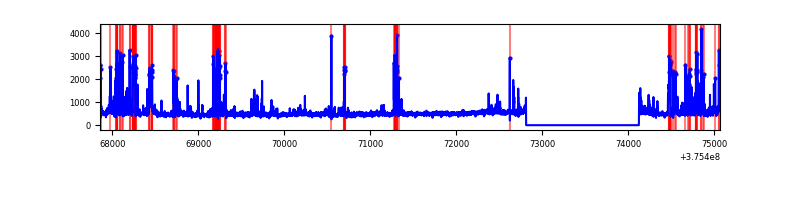 |
| C | 7213 | 5901 | 92 | 92 | 1.28% | 1.56% | 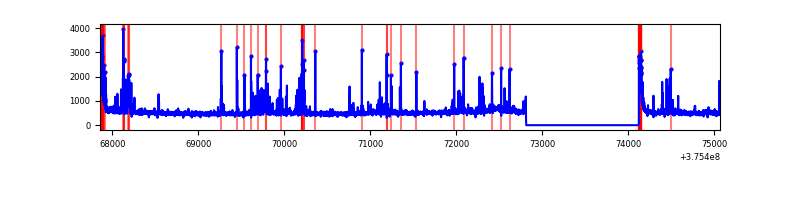 |
| D | 7213 | 5901 | 979 | 979 | 13.57% | 16.59% | 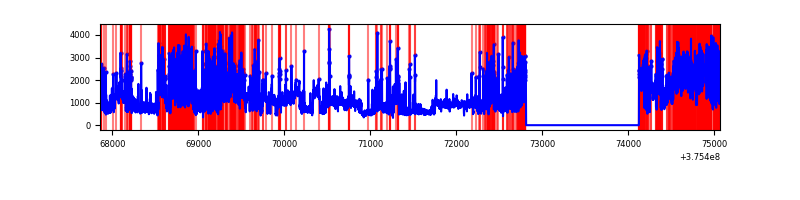 |
Top three noisy pixels from each quadrant. If the there are fewer than three noisy pixels in the level2.evt file, extra rows are filled as -1
| Pixel properties | Quadrant properties | ||||||
|---|---|---|---|---|---|---|---|
| Quadrant | DetID | PixID | Counts | Sigma | Mean | Median | Sigma |
| A | 15 | 47 | 58893 | 419.29 | 689 | 674 | 138.8 |
| A | 13 | 254 | 8750 | 58.16 | 689 | 674 | 138.8 |
| A | 15 | 169 | 8087 | 53.39 | 689 | 674 | 138.8 |
| B | 5 | 172 | 718795 | 5583.07 | 676 | 656 | 128.6 |
| B | 0 | 219 | 83171 | 641.5 | 676 | 656 | 128.6 |
| B | 4 | 170 | 26846 | 203.61 | 676 | 656 | 128.6 |
| C | 1 | 23 | 334987 | 2184.61 | 664 | 670 | 153.0 |
| C | 15 | 214 | 272299 | 1774.97 | 664 | 670 | 153.0 |
| C | 0 | 10 | 173650 | 1130.35 | 664 | 670 | 153.0 |
| D | 8 | 195 | 2245940 | 14160.53 | 621 | 607 | 158.6 |
| D | 12 | 17 | 1557146 | 9816.54 | 621 | 607 | 158.6 |
| D | 2 | 249 | 553702 | 3488.18 | 621 | 607 | 158.6 |
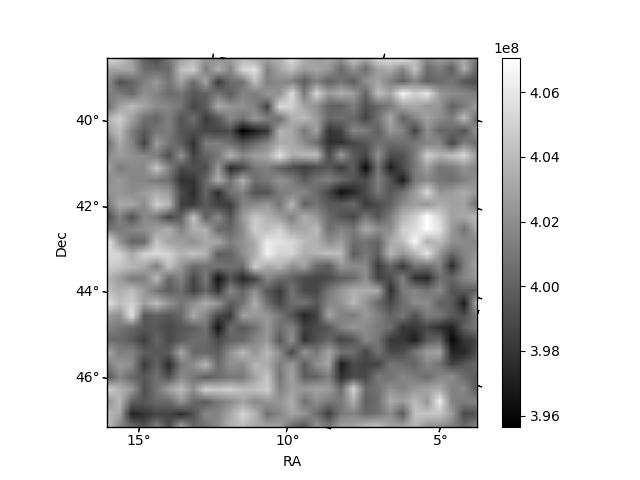
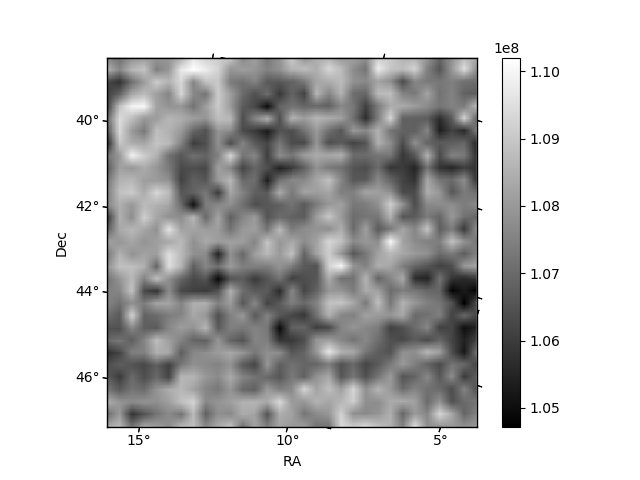
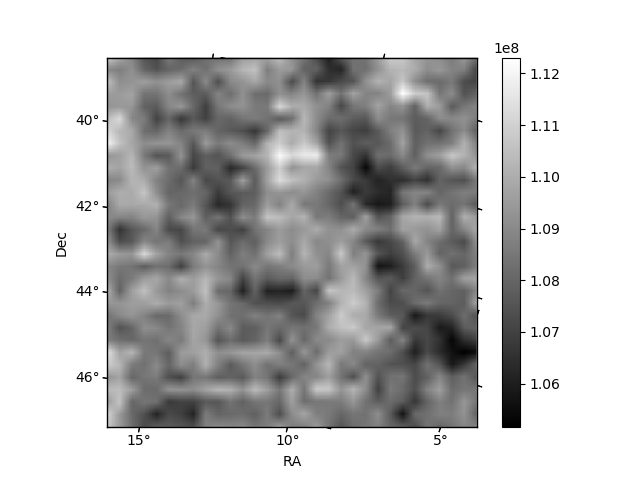
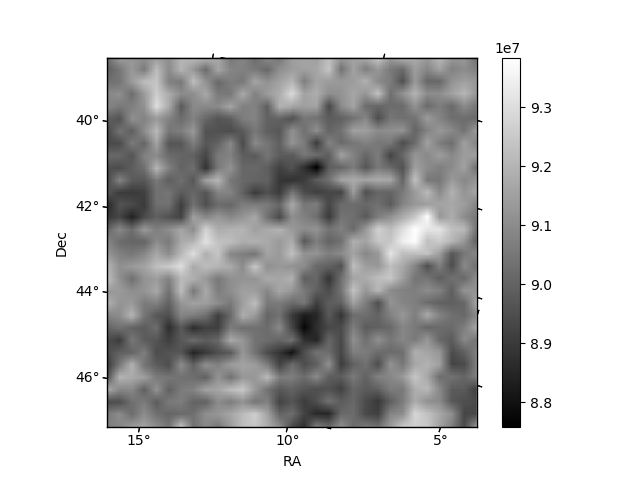
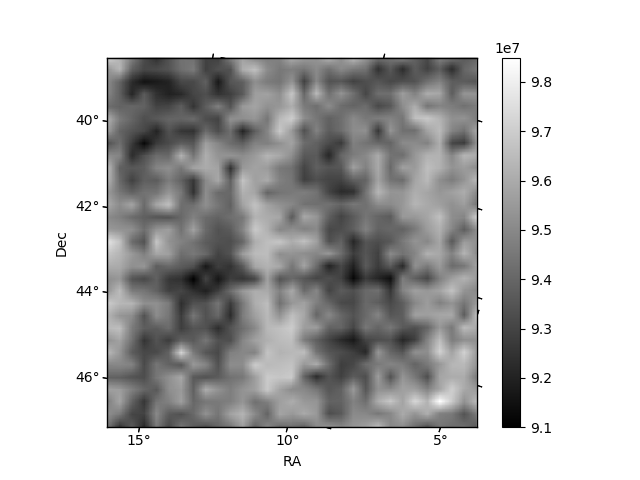
Histogram calculated using DETX and DETY for each event in the final _common_clean file
| Quadrant A | 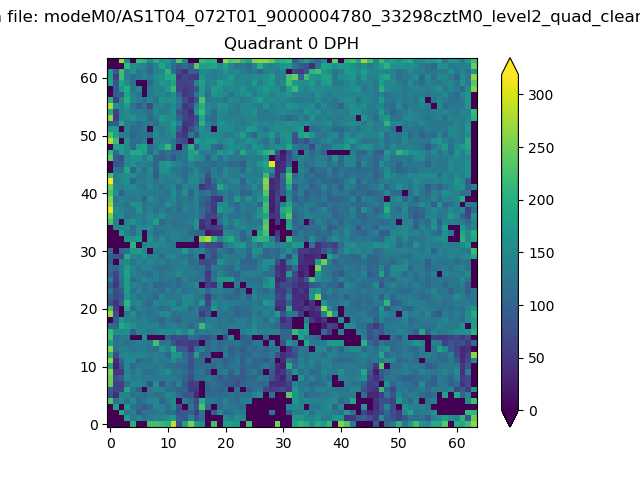 |
 |
Quadrant B |
|---|---|---|---|
| Quadrant D | 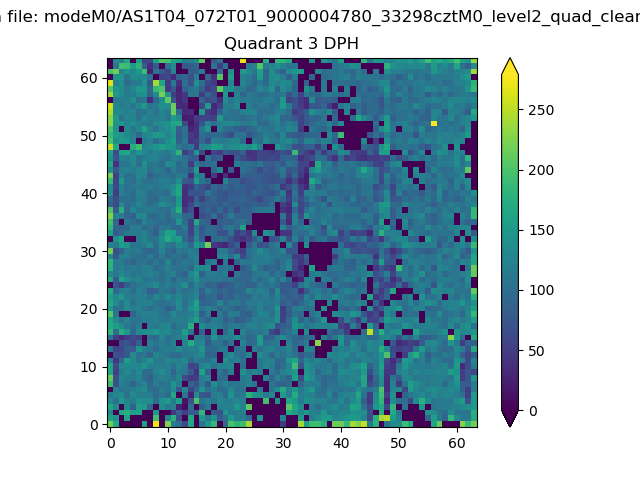 |
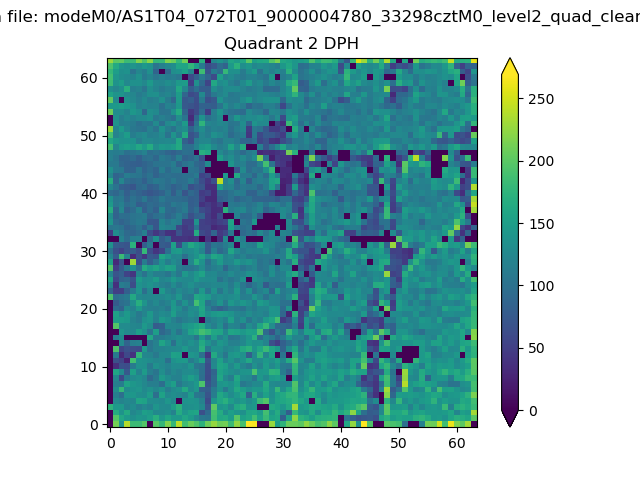 |
Quadrant C |
| Plot type | Count rate plots | Images |
|---|---|---|
| Comparison with Poisson distribution Blue bars denote a histogram of data divided into 1 sec bins. Red curve is a Poisson curve with rate = median count rate of data. |
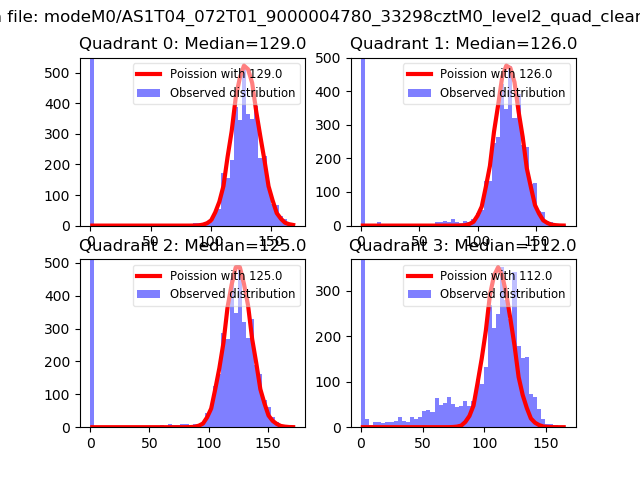 |
 |
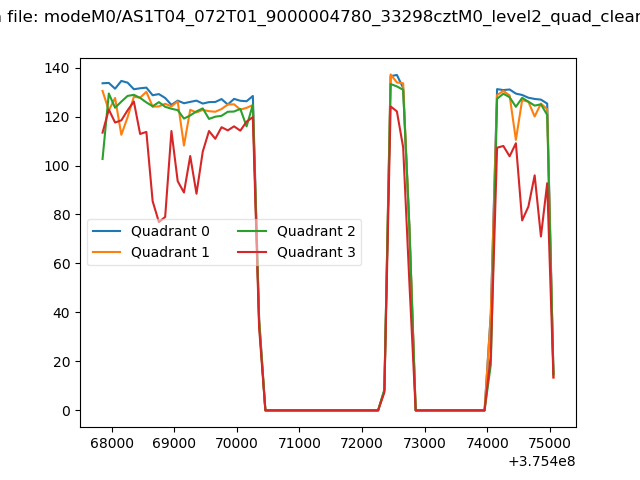
| Quadrant-wise count rates Data is divided into 100 sec bins |
 |
|
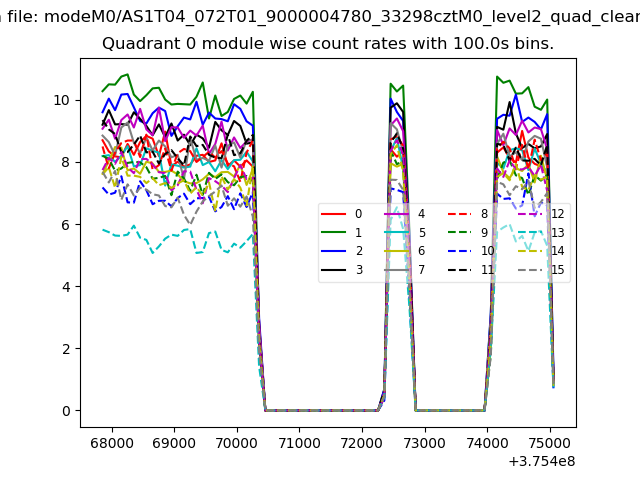
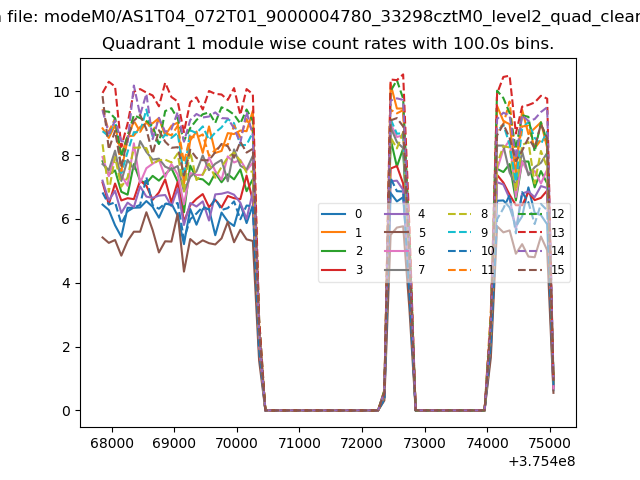
| Module-wise count rates for Quadrant A Data is divided into 100 sec bins |
 |
 |
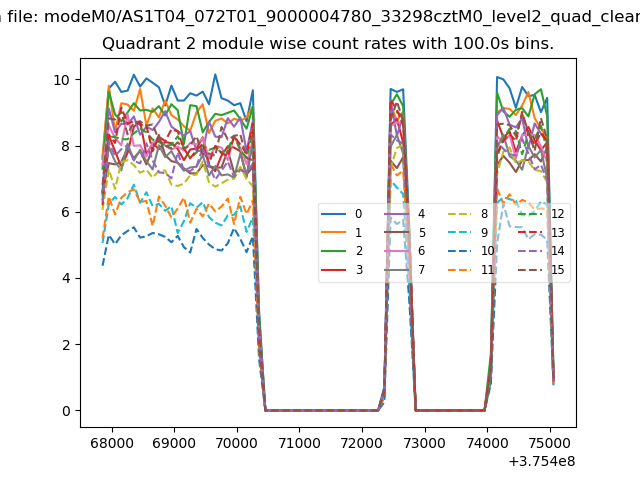
| Module-wise count rates for Quadrant B Data is divided into 100 sec bins |
 |
 |
| Module-wise count rates for Quadrant C Data is divided into 100 sec bins |
 |
 |
| Module-wise count rates for Quadrant D Data is divided into 100 sec bins |
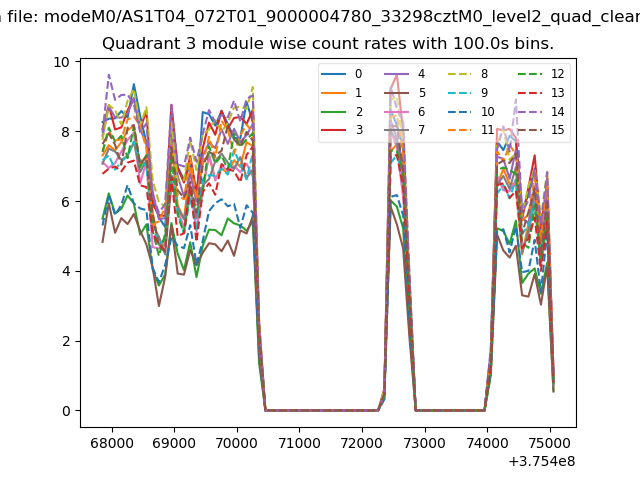 |
 |
| Parameter | Plot |
|---|---|
| CZT HV Monitor | 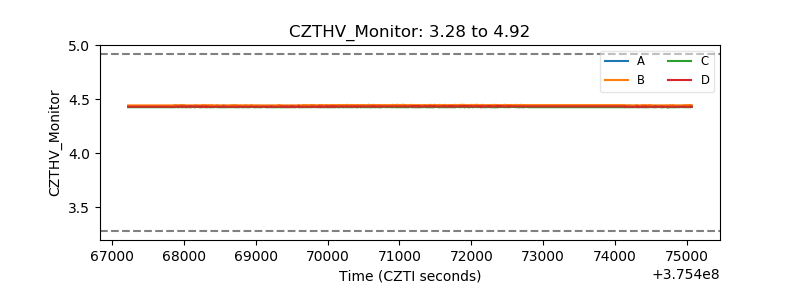 |
| D_VDD | 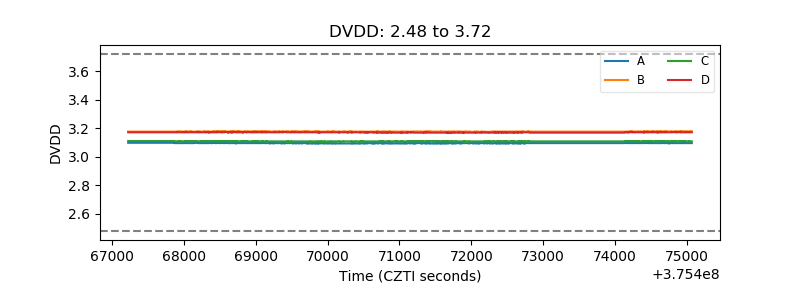 |
| Temperature 1 | 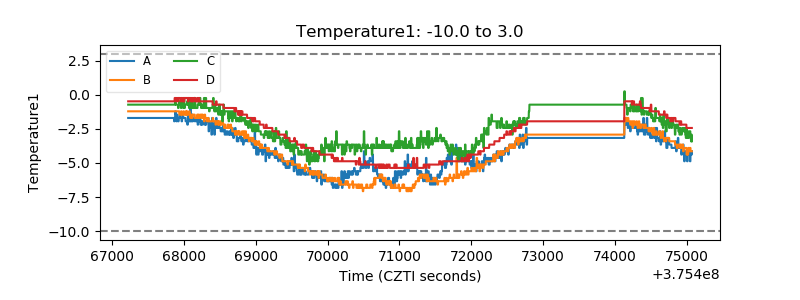 |
| Veto HV Monitor | 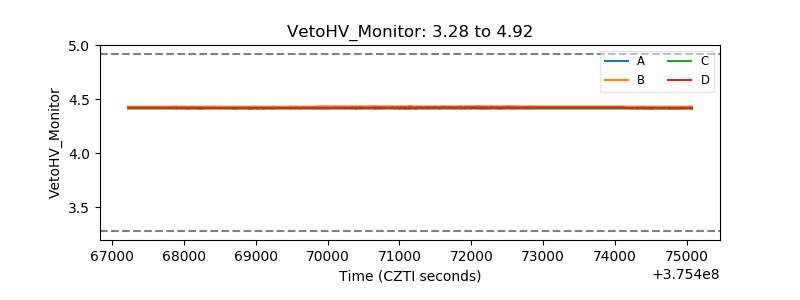 |
| Veto LLD | 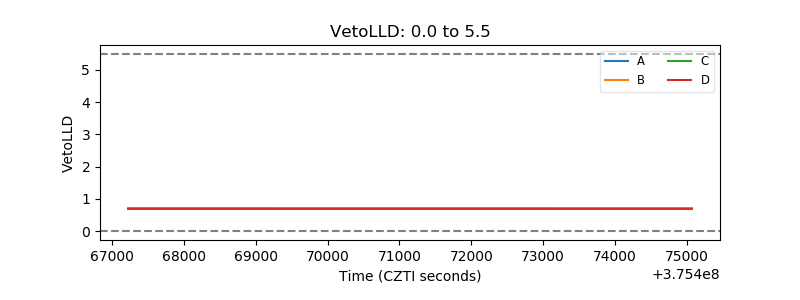 |
| Alpha Counter |  |
| _CPM_Rate | 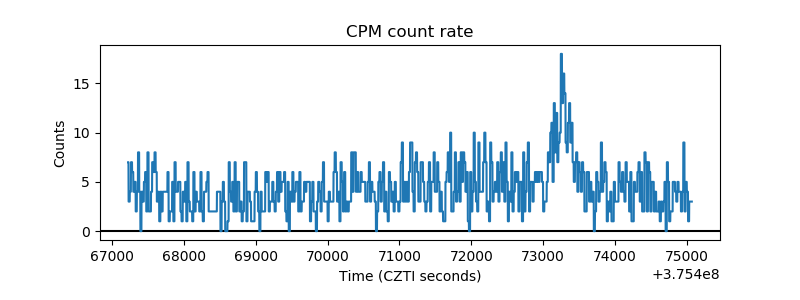 |
| CZT Counter | 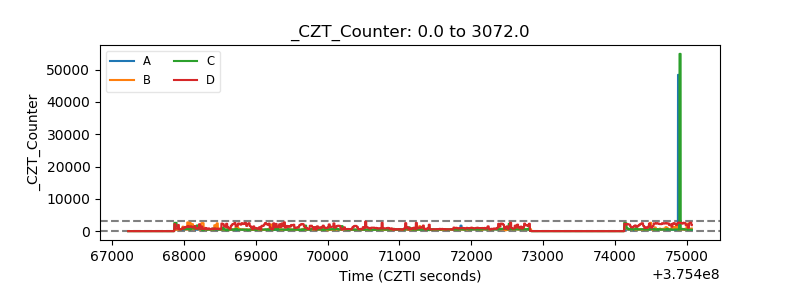 |
| +2.5 Volts monitor |  |
| +5 Volts monitor |  |
| _ROLL_ROT | 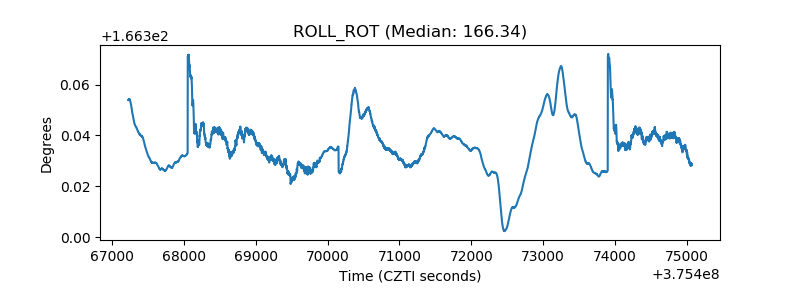 |
| _Roll_DEC | 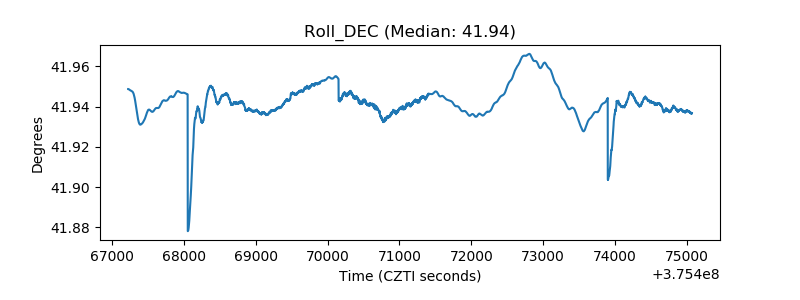 |
| _Roll_RA |  |
| Veto Counter | 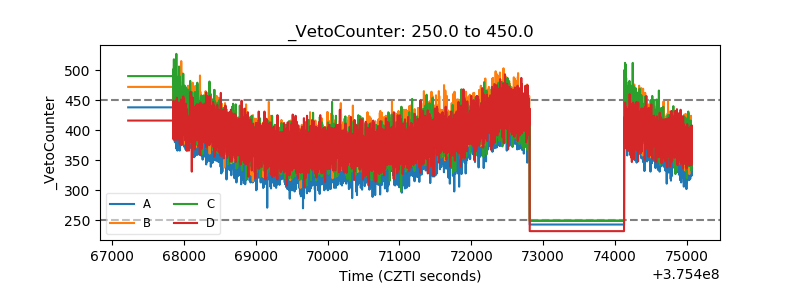 |