| Param | Original file | Final file |
|---|---|---|
| Filename | modeM0/AS1T04_072T01_9000004780_33301cztM0_level2.evt | modeM0/AS1T04_072T01_9000004780_33301cztM0_level2_quad_clean.evt |
| Size (bytes) | 1,025,605,440 | 129,931,200 |
| Size | 978.1 MB | 123.9 MB |
| Events in quadrant A | 6,234,074 | 819,480 |
| Events in quadrant B | 6,713,338 | 810,387 |
| Events in quadrant C | 6,759,025 | 805,006 |
| Events in quadrant D | 10,630,076 | 755,598 |
| Mode SS | |||
|---|---|---|---|
| Quadrant | BADHDUFLAG | Total packets | Discarded packets |
| A | 0 | 220 | 0 |
| B | 0 | 220 | 0 |
| C | 0 | 220 | 0 |
| D | 0 | 220 | 0 |
| Mode M0 | |||
|---|---|---|---|
| Quadrant | BADHDUFLAG | Total packets | Discarded packets |
| A | 0 | 25792 | 4 |
| B | 0 | 27099 | 3 |
| C | 0 | 26705 | 3 |
| D | 0 | 38989 | 3 |
| Mode M9 | |||
|---|---|---|---|
| Quadrant | BADHDUFLAG | Total packets | Discarded packets |
| A | 0 | 42 | 0 |
| B | 0 | 42 | 0 |
| C | 0 | 42 | 0 |
| D | 0 | 42 | 0 |
| Quadrant | Total seconds | Saturated seconds | Saturation percentage |
|---|---|---|---|
| A | 10747 | 313 | 2.912441% |
| B | 10747 | 481 | 4.475668% |
| C | 10747 | 311 | 2.893831% |
| D | 10747 | 536 | 4.987438% |
Noise dominated data is calculated using 1-second bins in cleaned event files. If a bin has >2000 counts, and if more than 50% of those come from <1% of pixels, then it is considered to be noise-dominated and hence unusable.
| Quadrant | # 1 sec bins | Bins with >0 counts | Bins with >2000 counts | High rate bins dominated by noise | Noise dominated (total time) | Noise dominated (detector-on time) | Marked lightcurve |
|---|---|---|---|---|---|---|---|
| A | 14927 | 10751 | 210 | 210 | 1.41% | 1.95% | 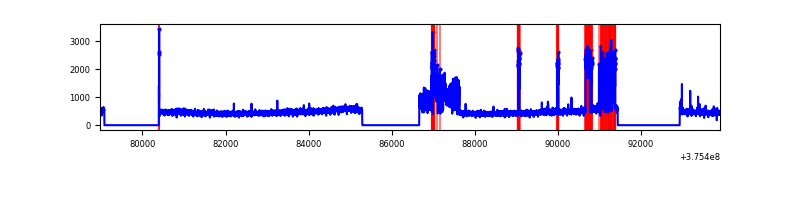 |
| B | 14927 | 10751 | 319 | 319 | 2.14% | 2.97% | 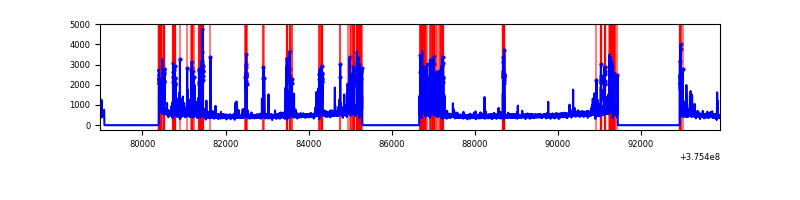 |
| C | 14927 | 10751 | 254 | 254 | 1.70% | 2.36% | 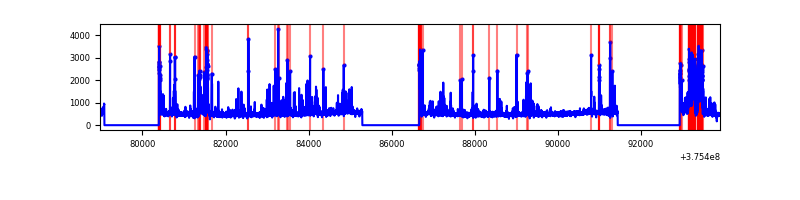 |
| D | 14927 | 10751 | 469 | 469 | 3.14% | 4.36% | 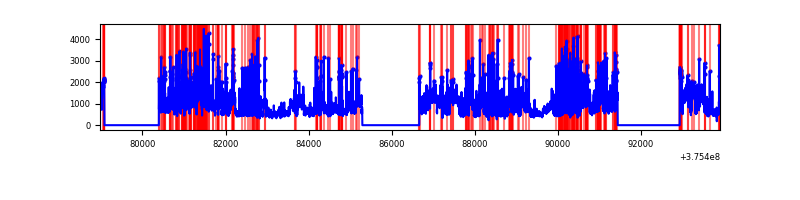 |
Top three noisy pixels from each quadrant. If the there are fewer than three noisy pixels in the level2.evt file, extra rows are filled as -1
| Pixel properties | Quadrant properties | ||||||
|---|---|---|---|---|---|---|---|
| Quadrant | DetID | PixID | Counts | Sigma | Mean | Median | Sigma |
| A | 15 | 169 | 1329946 | 5335.31 | 1244 | 1220 | 249.0 |
| A | 15 | 47 | 72956 | 288.05 | 1244 | 1220 | 249.0 |
| A | 13 | 254 | 16035 | 59.49 | 1244 | 1220 | 249.0 |
| B | 5 | 172 | 1424047 | 6092.62 | 1229 | 1198 | 233.5 |
| B | 0 | 189 | 57028 | 239.06 | 1229 | 1198 | 233.5 |
| B | 0 | 219 | 52314 | 218.88 | 1229 | 1198 | 233.5 |
| C | 10 | 49 | 520739 | 1874.53 | 1206 | 1215 | 277.1 |
| C | 15 | 214 | 491629 | 1769.5 | 1206 | 1215 | 277.1 |
| C | 1 | 23 | 474726 | 1708.51 | 1206 | 1215 | 277.1 |
| D | 8 | 195 | 3783358 | 11859.61 | 1193 | 1169 | 318.9 |
| D | 12 | 17 | 534633 | 1672.75 | 1193 | 1169 | 318.9 |
| D | 7 | 223 | 364227 | 1138.42 | 1193 | 1169 | 318.9 |
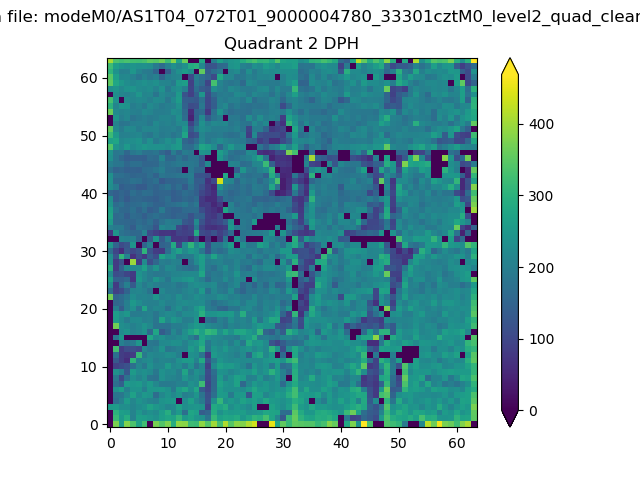
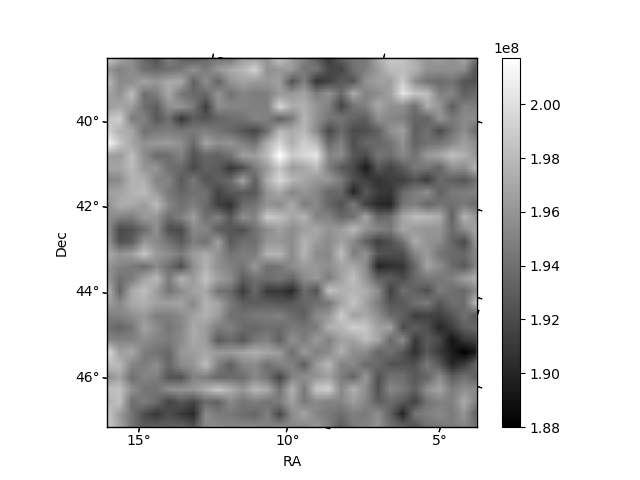
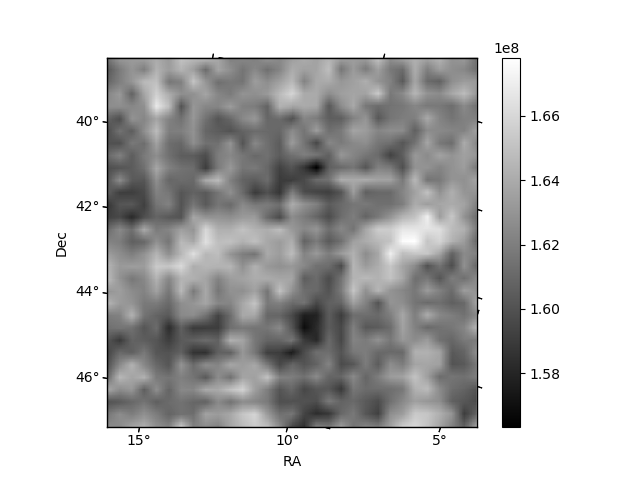
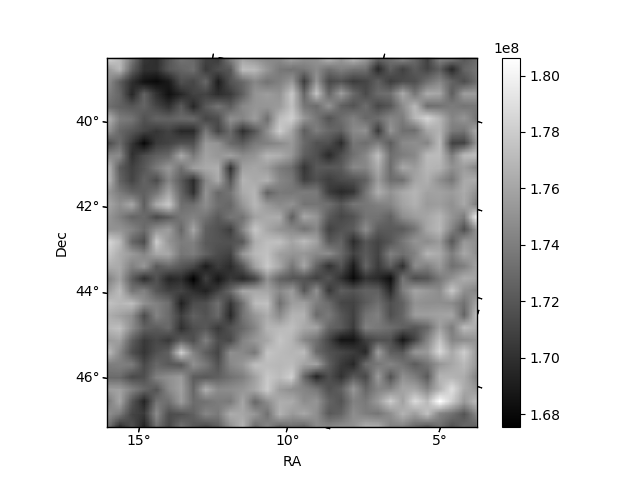
Histogram calculated using DETX and DETY for each event in the final _common_clean file
| Quadrant A |  |
 |
Quadrant B |
|---|---|---|---|
| Quadrant D | 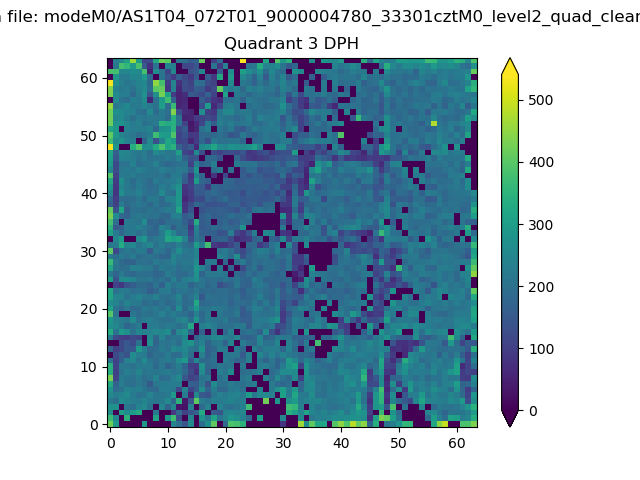 |
 |
Quadrant C |
| Plot type | Count rate plots | Images |
|---|---|---|
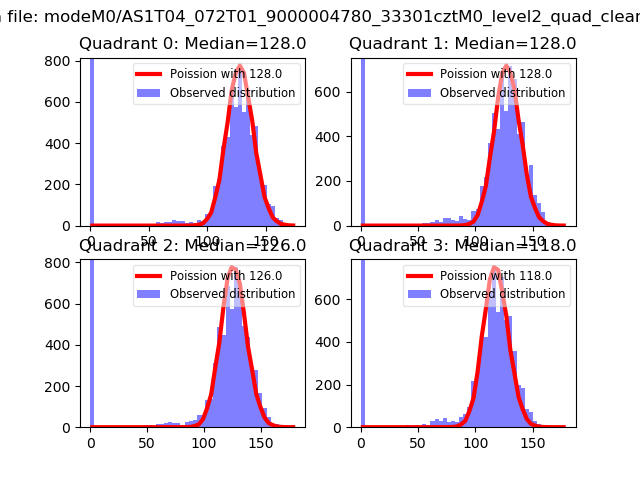
| Comparison with Poisson distribution Blue bars denote a histogram of data divided into 1 sec bins. Red curve is a Poisson curve with rate = median count rate of data. |
 |
 |
| Quadrant-wise count rates Data is divided into 100 sec bins |
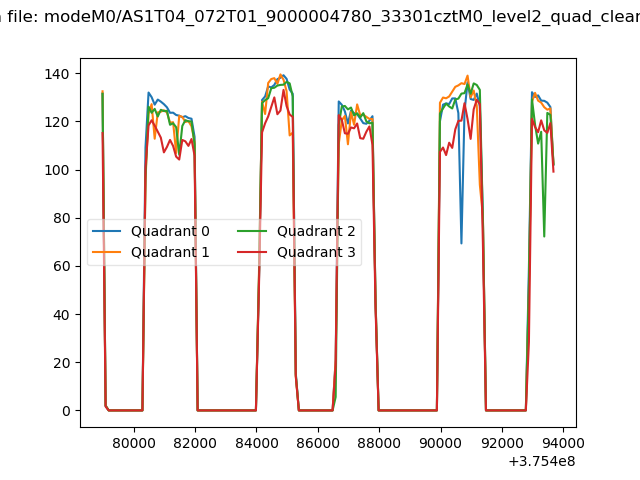 |
|
| Module-wise count rates for Quadrant A Data is divided into 100 sec bins |
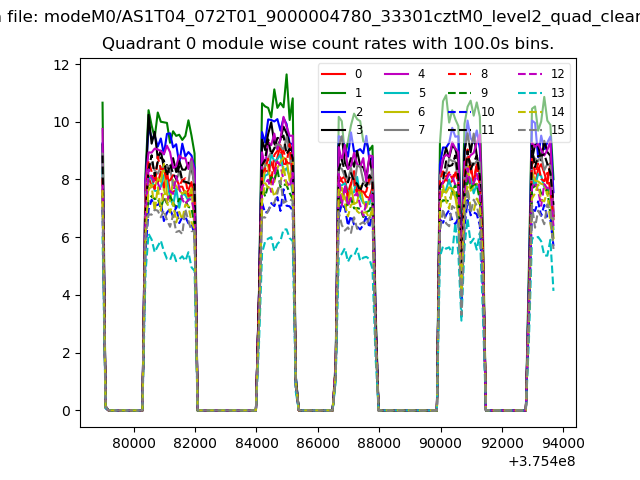 |
 |
| Module-wise count rates for Quadrant B Data is divided into 100 sec bins |
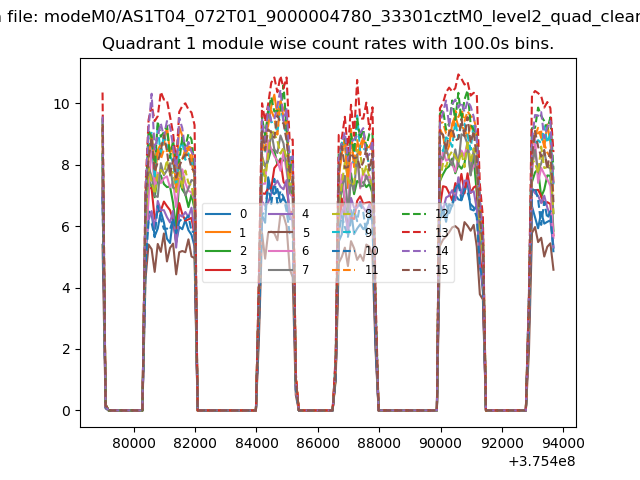 |
 |
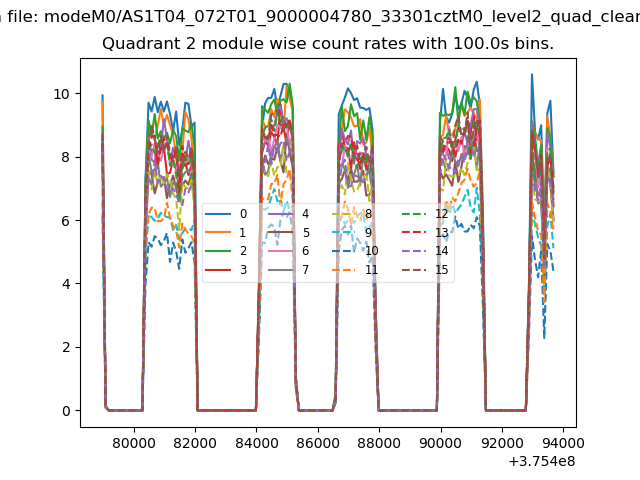
| Module-wise count rates for Quadrant C Data is divided into 100 sec bins |
 |
 |
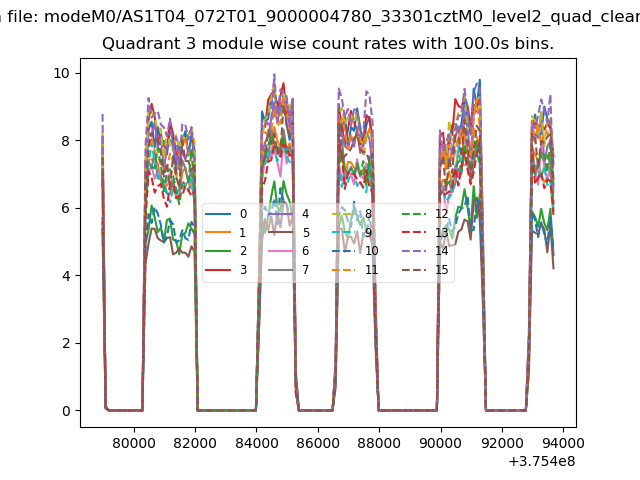
| Module-wise count rates for Quadrant D Data is divided into 100 sec bins |
 |
 |
| Parameter | Plot |
|---|---|
| CZT HV Monitor | 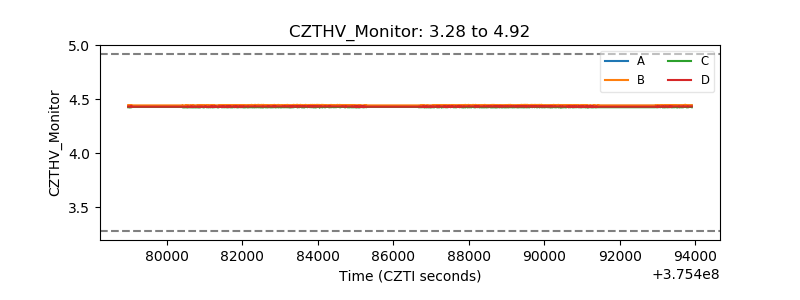 |
| D_VDD | 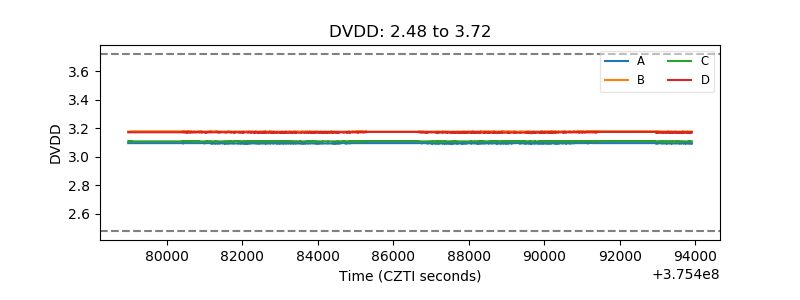 |
| Temperature 1 | 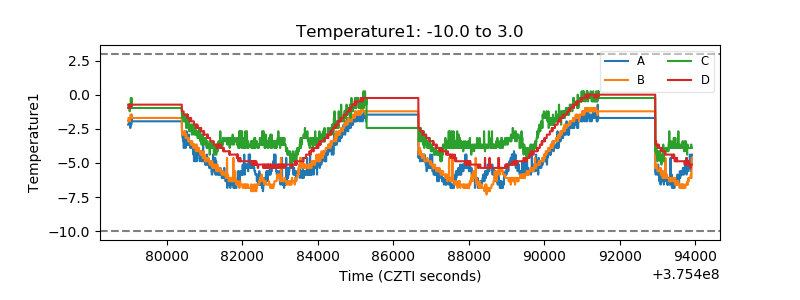 |
| Veto HV Monitor | 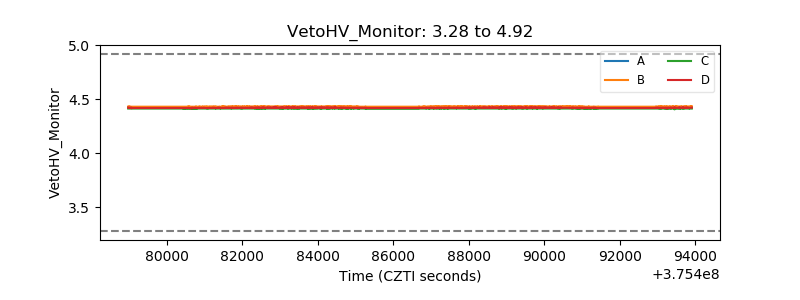 |
| Veto LLD | 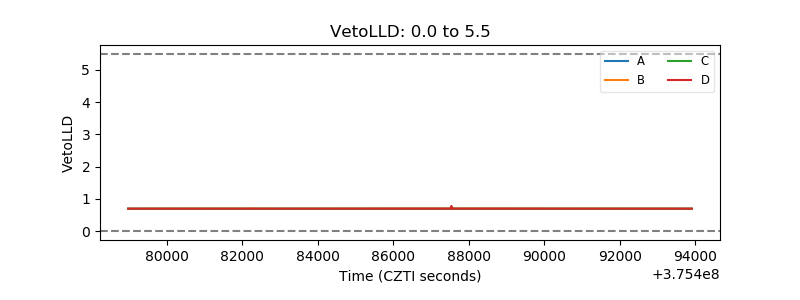 |
| Alpha Counter |  |
| _CPM_Rate | 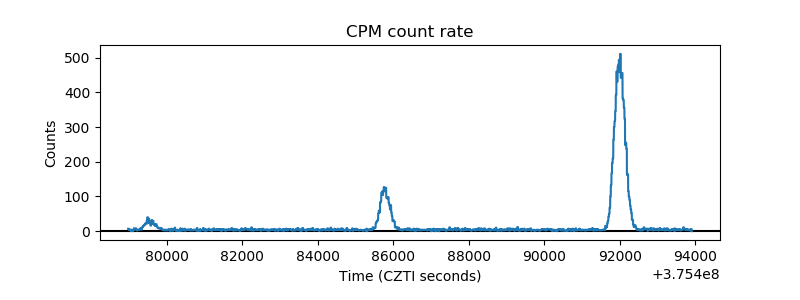 |
| CZT Counter | 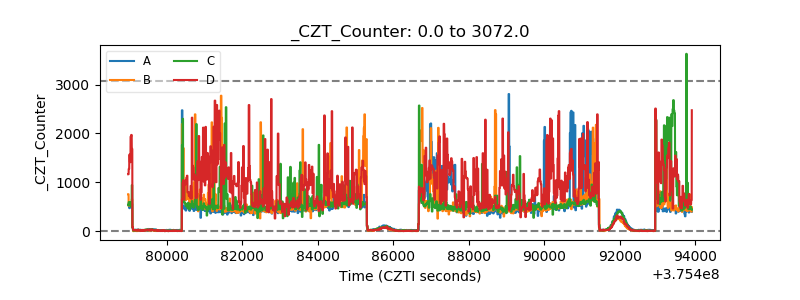 |
| +2.5 Volts monitor |  |
| +5 Volts monitor |  |
| _ROLL_ROT | 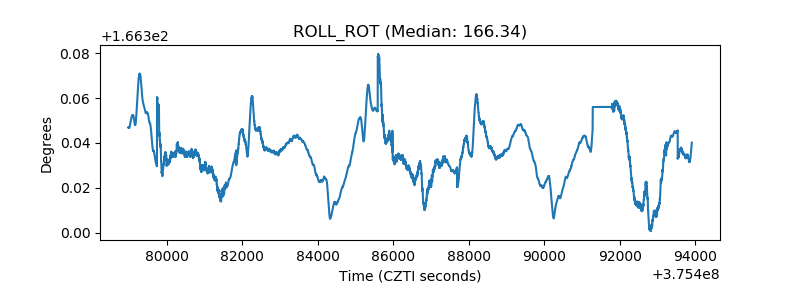 |
| _Roll_DEC | 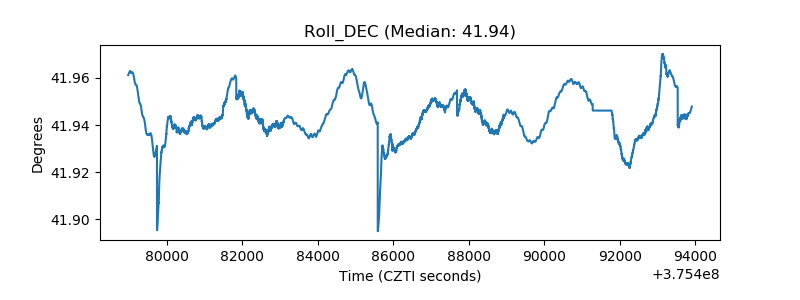 |
| _Roll_RA | 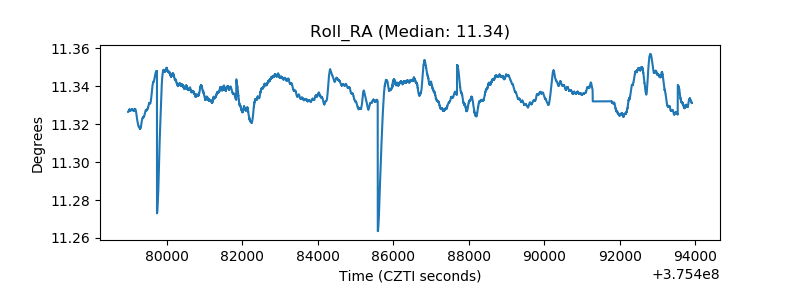 |
| Veto Counter | 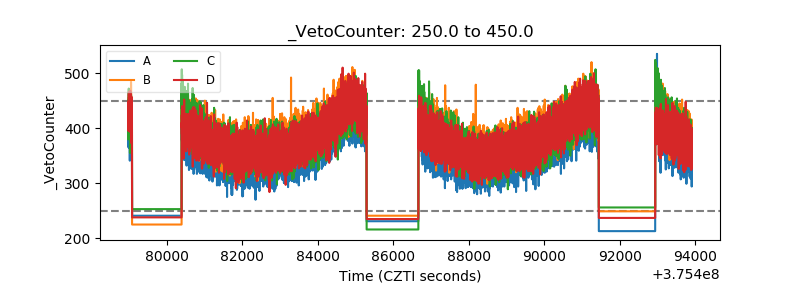 |