| Param | Original file | Final file |
|---|---|---|
| Filename | modeM0/AS1T04_072T01_9000004780_33303cztM0_level2.evt | modeM0/AS1T04_072T01_9000004780_33303cztM0_level2_quad_clean.evt |
| Size (bytes) | 581,454,720 | 53,939,520 |
| Size | 554.5 MB | 51.4 MB |
| Events in quadrant A | 4,728,788 | 313,207 |
| Events in quadrant B | 3,529,683 | 320,661 |
| Events in quadrant C | 3,447,212 | 318,672 |
| Events in quadrant D | 5,531,604 | 294,689 |
| Mode SS | |||
|---|---|---|---|
| Quadrant | BADHDUFLAG | Total packets | Discarded packets |
| A | 0 | 112 | 0 |
| B | 0 | 112 | 0 |
| C | 0 | 112 | 0 |
| D | 0 | 112 | 0 |
| Mode M0 | |||
|---|---|---|---|
| Quadrant | BADHDUFLAG | Total packets | Discarded packets |
| A | 0 | 17738 | 3 |
| B | 0 | 14085 | 2 |
| C | 0 | 13501 | 2 |
| D | 0 | 20413 | 2 |
| Mode M9 | |||
|---|---|---|---|
| Quadrant | BADHDUFLAG | Total packets | Discarded packets |
| A | 0 | 18 | 0 |
| B | 0 | 18 | 0 |
| C | 0 | 18 | 0 |
| D | 0 | 19 | 0 |
| Quadrant | Total seconds | Saturated seconds | Saturation percentage |
|---|---|---|---|
| A | 5508 | 350 | 6.354394% |
| B | 5508 | 238 | 4.320988% |
| C | 5508 | 98 | 1.779230% |
| D | 5508 | 351 | 6.372549% |
Noise dominated data is calculated using 1-second bins in cleaned event files. If a bin has >2000 counts, and if more than 50% of those come from <1% of pixels, then it is considered to be noise-dominated and hence unusable.
| Quadrant | # 1 sec bins | Bins with >0 counts | Bins with >2000 counts | High rate bins dominated by noise | Noise dominated (total time) | Noise dominated (detector-on time) | Marked lightcurve |
|---|---|---|---|---|---|---|---|
| A | 7211 | 5509 | 217 | 217 | 3.01% | 3.94% | 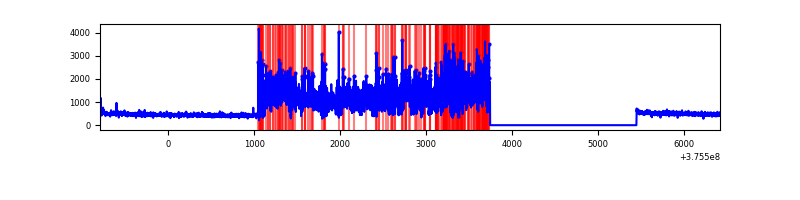 |
| B | 7211 | 5509 | 148 | 148 | 2.05% | 2.69% | 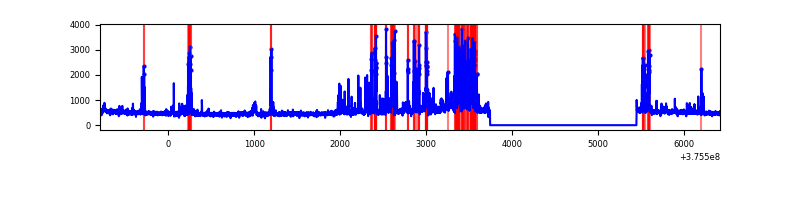 |
| C | 7211 | 5509 | 87 | 87 | 1.21% | 1.58% | 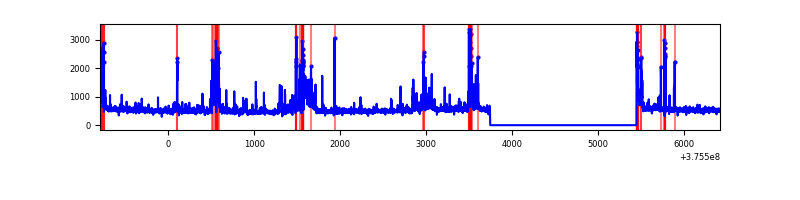 |
| D | 7211 | 5509 | 284 | 284 | 3.94% | 5.16% | 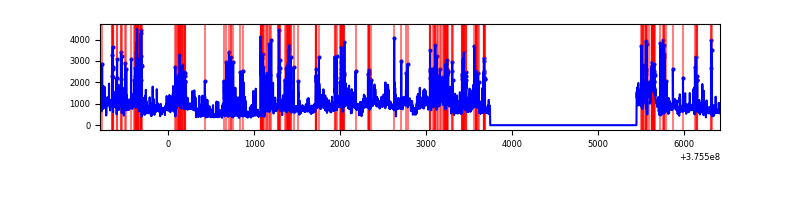 |
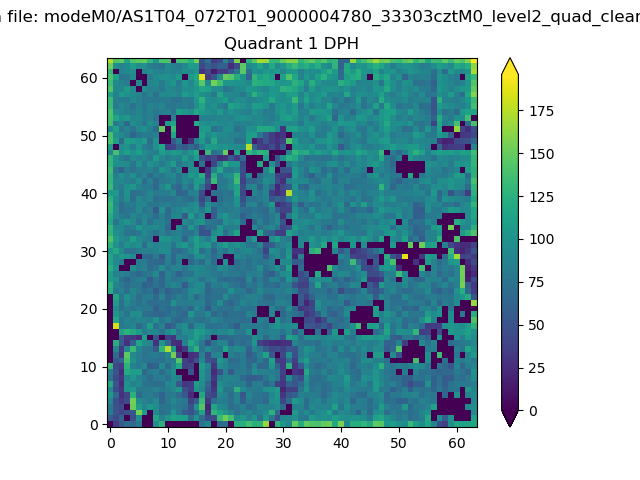
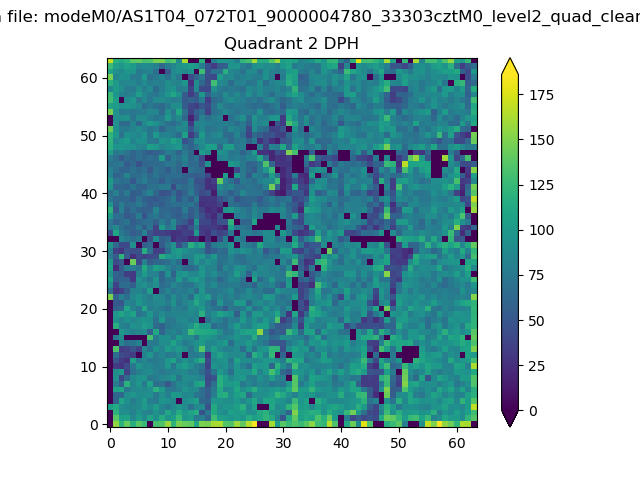
Top three noisy pixels from each quadrant. If the there are fewer than three noisy pixels in the level2.evt file, extra rows are filled as -1
| Pixel properties | Quadrant properties | ||||||
|---|---|---|---|---|---|---|---|
| Quadrant | DetID | PixID | Counts | Sigma | Mean | Median | Sigma |
| A | 15 | 169 | 2140169 | 16421.7 | 650 | 637 | 130.3 |
| A | 14 | 254 | 37124 | 280.05 | 650 | 637 | 130.3 |
| A | 12 | 16 | 17994 | 133.22 | 650 | 637 | 130.3 |
| B | 5 | 172 | 747130 | 6016.55 | 652 | 635 | 124.1 |
| B | 0 | 219 | 108217 | 867.08 | 652 | 635 | 124.1 |
| B | 0 | 190 | 34909 | 276.24 | 652 | 635 | 124.1 |
| C | 15 | 208 | 393990 | 2649.26 | 636 | 641 | 148.5 |
| C | 15 | 214 | 255488 | 1716.43 | 636 | 641 | 148.5 |
| C | 10 | 49 | 124692 | 835.5 | 636 | 641 | 148.5 |
| D | 8 | 195 | 1577615 | 9685.58 | 617 | 603 | 162.8 |
| D | 7 | 223 | 423932 | 2599.97 | 617 | 603 | 162.8 |
| D | 13 | 249 | 371004 | 2274.9 | 617 | 603 | 162.8 |
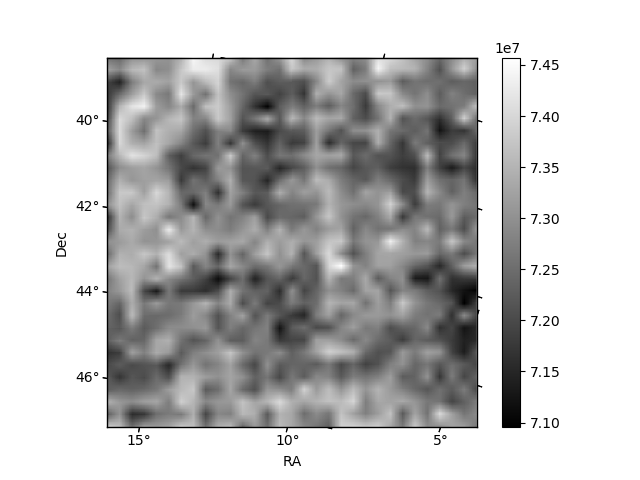
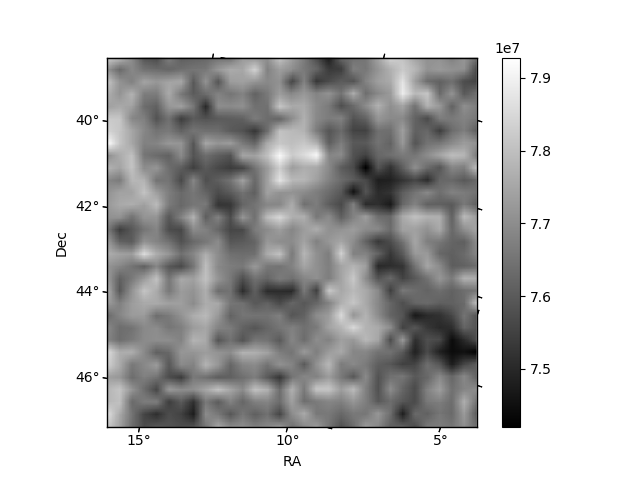
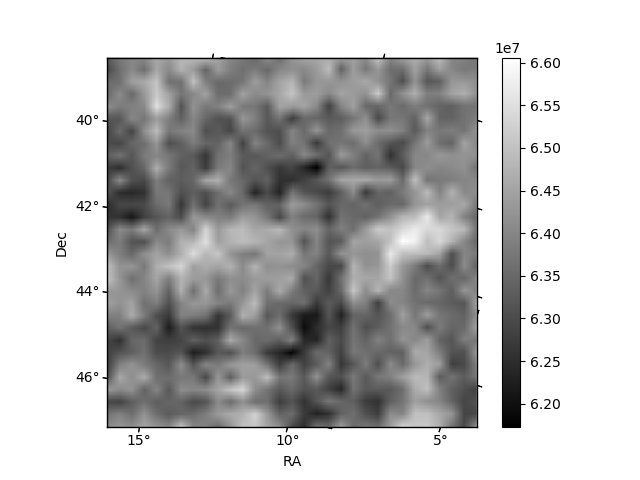
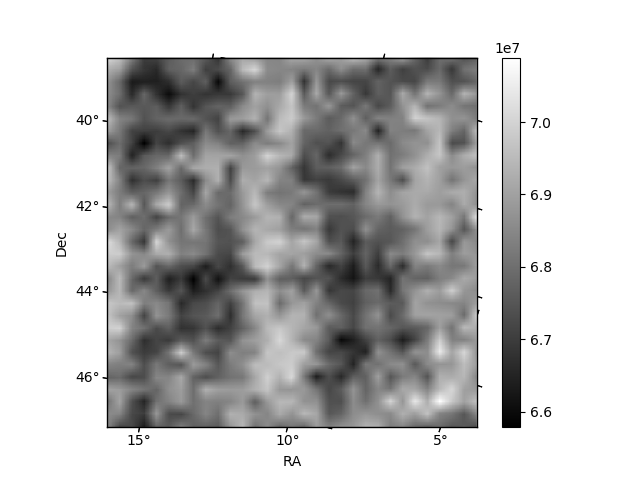
Histogram calculated using DETX and DETY for each event in the final _common_clean file
| Quadrant A | 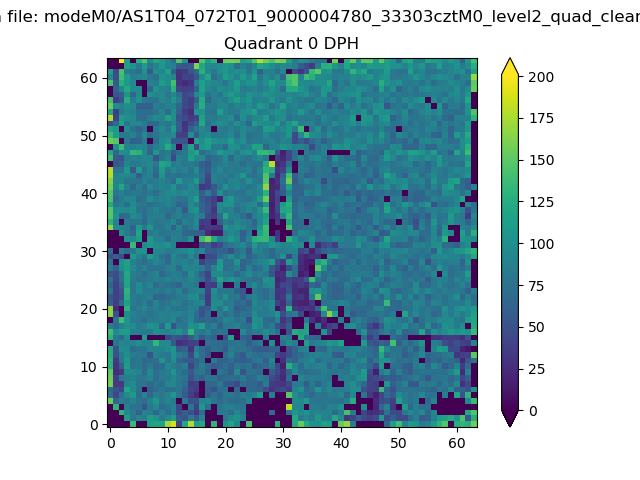 |
 |
Quadrant B |
|---|---|---|---|
| Quadrant D | 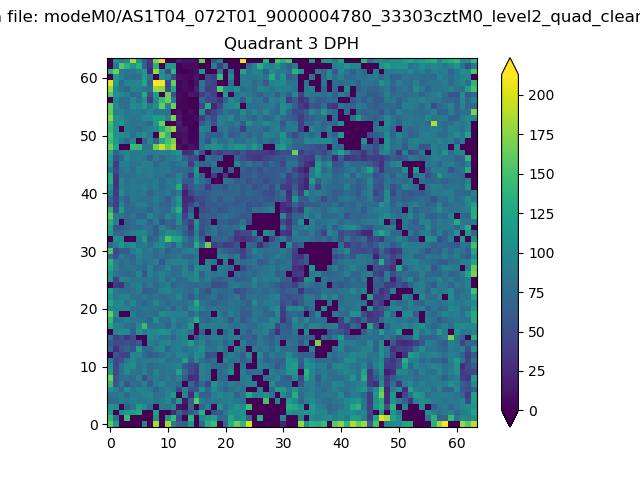 |
 |
Quadrant C |
| Plot type | Count rate plots | Images |
|---|---|---|
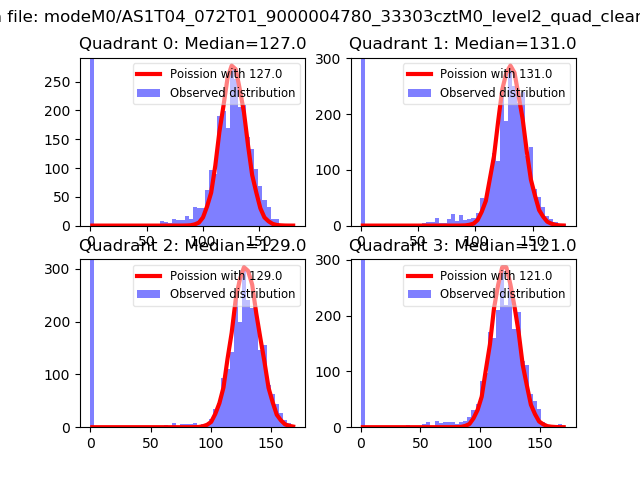
| Comparison with Poisson distribution Blue bars denote a histogram of data divided into 1 sec bins. Red curve is a Poisson curve with rate = median count rate of data. |
 |
 |
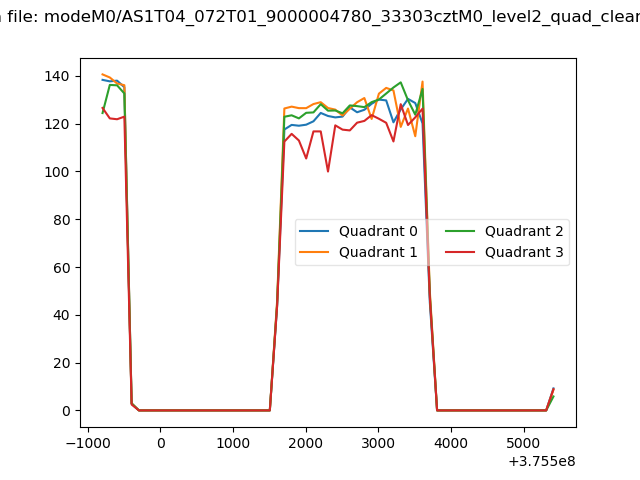
| Quadrant-wise count rates Data is divided into 100 sec bins |
 |
|
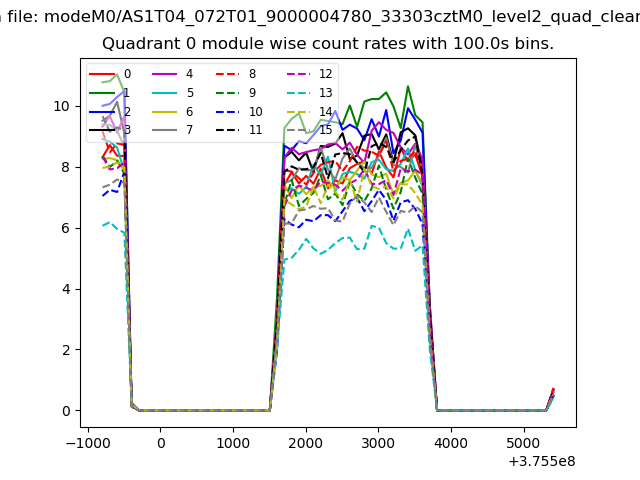
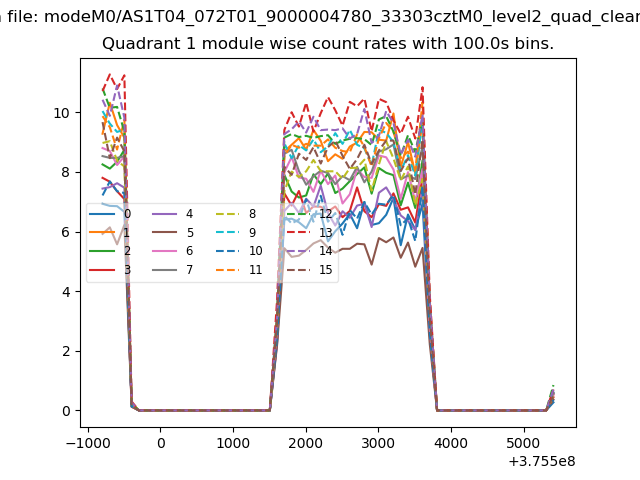
| Module-wise count rates for Quadrant A Data is divided into 100 sec bins |
 |
 |
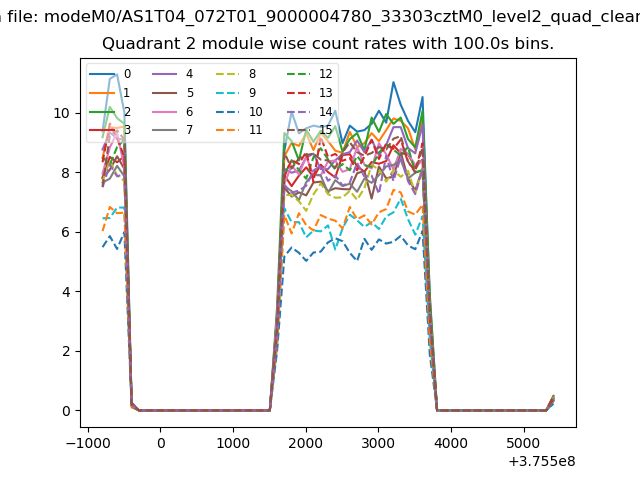
| Module-wise count rates for Quadrant B Data is divided into 100 sec bins |
 |
 |
| Module-wise count rates for Quadrant C Data is divided into 100 sec bins |
 |
 |
| Module-wise count rates for Quadrant D Data is divided into 100 sec bins |
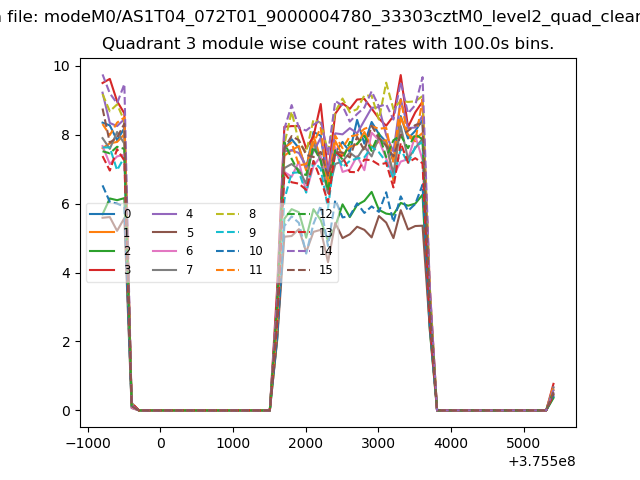 |
 |
| Parameter | Plot |
|---|---|
| CZT HV Monitor | 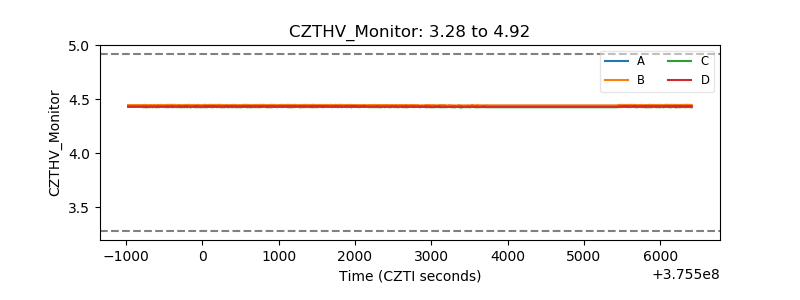 |
| D_VDD | 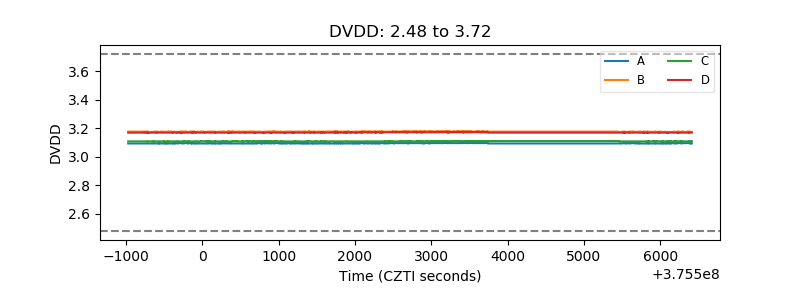 |
| Temperature 1 | 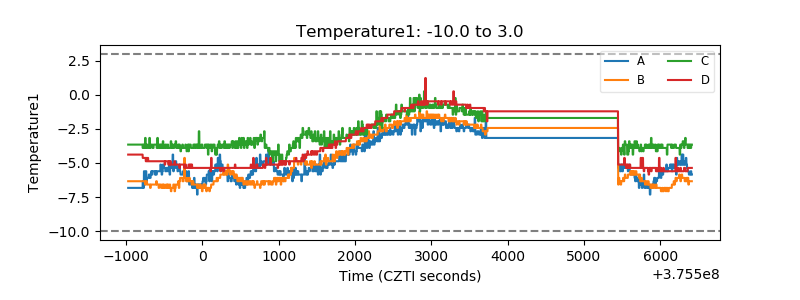 |
| Veto HV Monitor |  |
| Veto LLD | 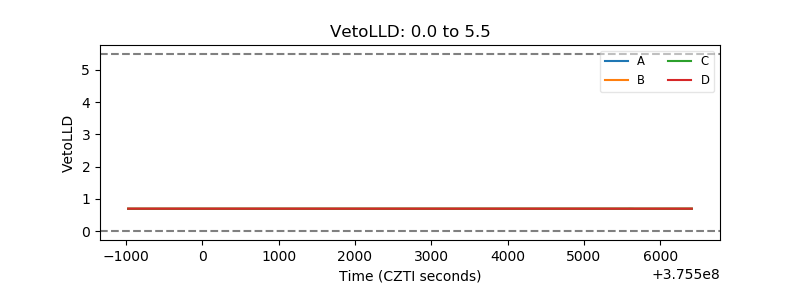 |
| Alpha Counter | 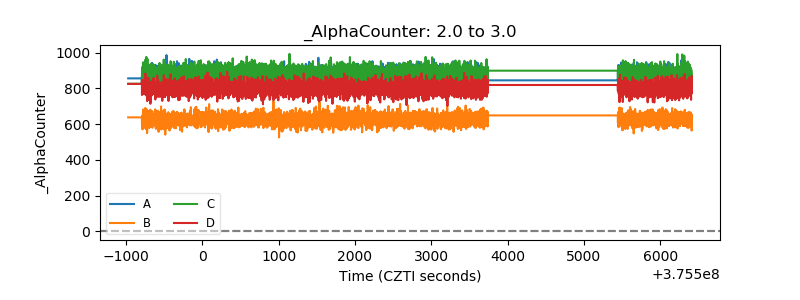 |
| _CPM_Rate | 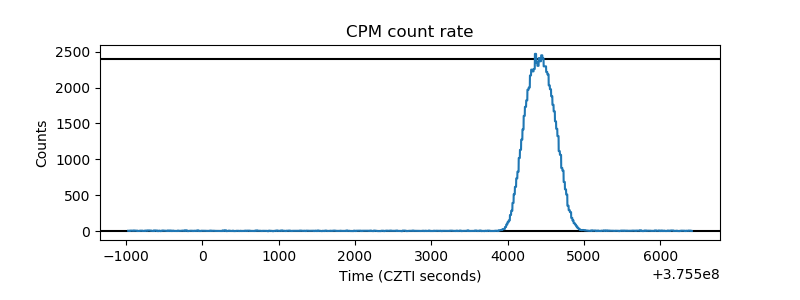 |
| CZT Counter | 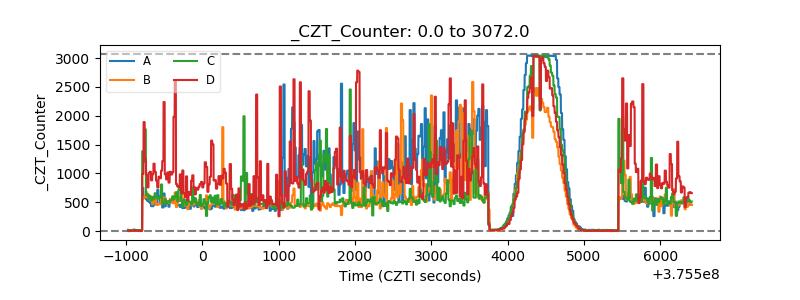 |
| +2.5 Volts monitor | 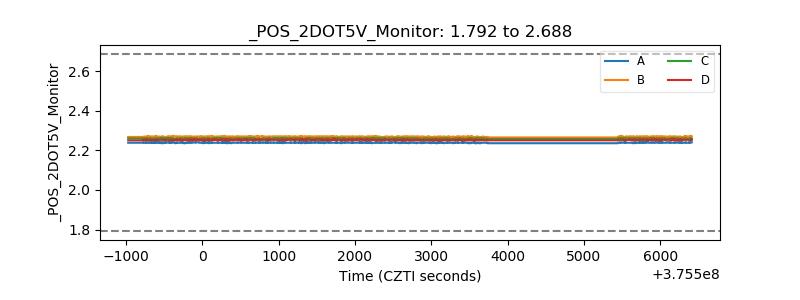 |
| +5 Volts monitor | 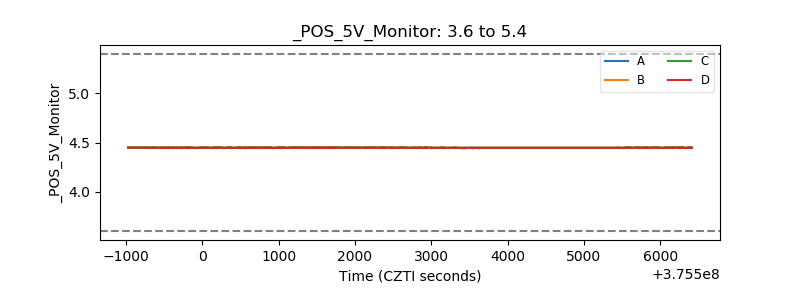 |
| _ROLL_ROT | 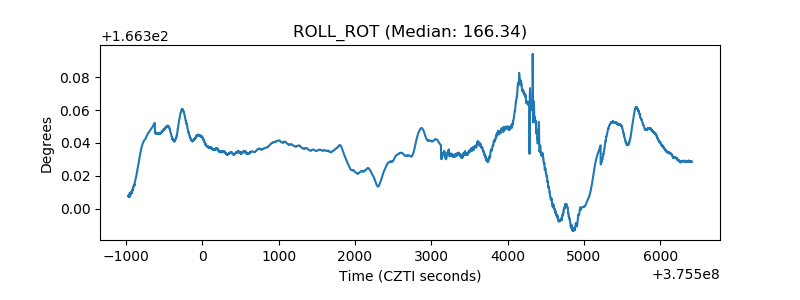 |
| _Roll_DEC | 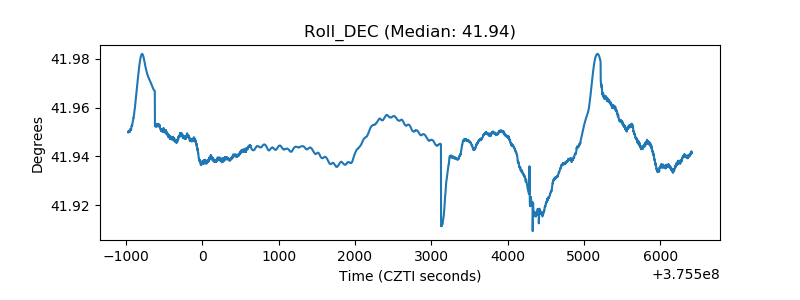 |
| _Roll_RA | 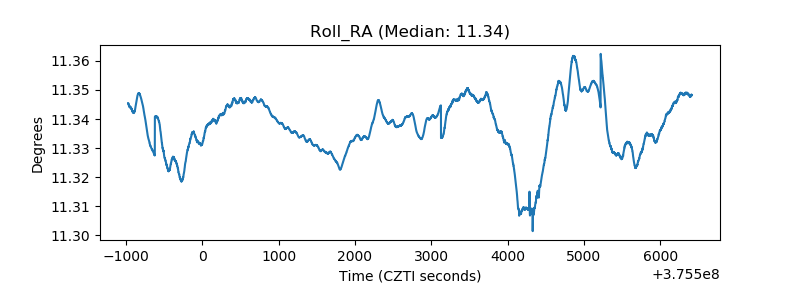 |
| Veto Counter | 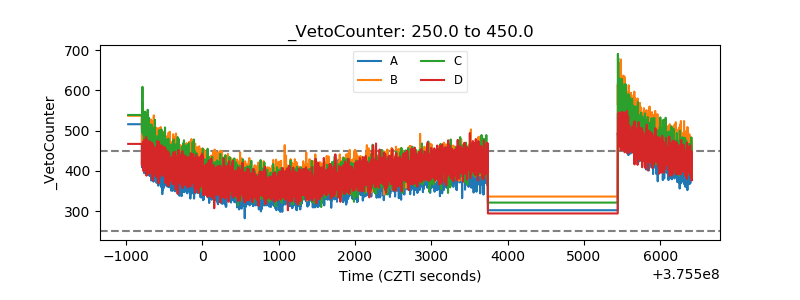 |