| Param | Original file | Final file |
|---|---|---|
| Filename | modeM0/AS1T04_072T01_9000004780_33306cztM0_level2.evt | modeM0/AS1T04_072T01_9000004780_33306cztM0_level2_quad_clean.evt |
| Size (bytes) | 515,828,160 | 60,039,360 |
| Size | 491.9 MB | 57.3 MB |
| Events in quadrant A | 2,756,688 | 383,176 |
| Events in quadrant B | 4,340,524 | 353,896 |
| Events in quadrant C | 3,249,876 | 367,138 |
| Events in quadrant D | 4,919,272 | 345,556 |
| Mode SS | |||
|---|---|---|---|
| Quadrant | BADHDUFLAG | Total packets | Discarded packets |
| A | 0 | 108 | 0 |
| B | 0 | 108 | 0 |
| C | 0 | 108 | 0 |
| D | 0 | 108 | 0 |
| Mode M0 | |||
|---|---|---|---|
| Quadrant | BADHDUFLAG | Total packets | Discarded packets |
| A | 0 | 11163 | 3 |
| B | 0 | 16266 | 2 |
| C | 0 | 13008 | 2 |
| D | 0 | 18371 | 2 |
| Mode M9 | |||
|---|---|---|---|
| Quadrant | BADHDUFLAG | Total packets | Discarded packets |
| A | 0 | 30 | 0 |
| B | 0 | 30 | 0 |
| C | 0 | 30 | 0 |
| D | 0 | 31 | 0 |
| Quadrant | Total seconds | Saturated seconds | Saturation percentage |
|---|---|---|---|
| A | 5248 | 8 | 0.152439% |
| B | 5248 | 512 | 9.756098% |
| C | 5248 | 56 | 1.067073% |
| D | 5248 | 201 | 3.830030% |
Noise dominated data is calculated using 1-second bins in cleaned event files. If a bin has >2000 counts, and if more than 50% of those come from <1% of pixels, then it is considered to be noise-dominated and hence unusable.
| Quadrant | # 1 sec bins | Bins with >0 counts | Bins with >2000 counts | High rate bins dominated by noise | Noise dominated (total time) | Noise dominated (detector-on time) | Marked lightcurve |
|---|---|---|---|---|---|---|---|
| A | 7220 | 5249 | 0 | 0 | 0.00% | 0.00% | 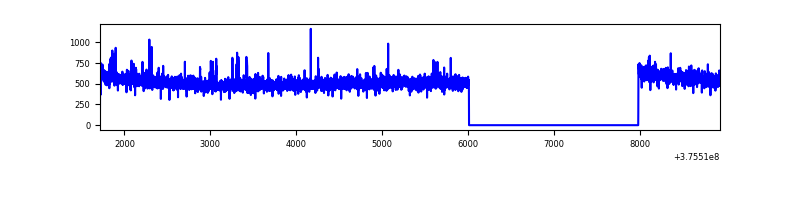 |
| B | 7220 | 5249 | 373 | 373 | 5.17% | 7.11% | 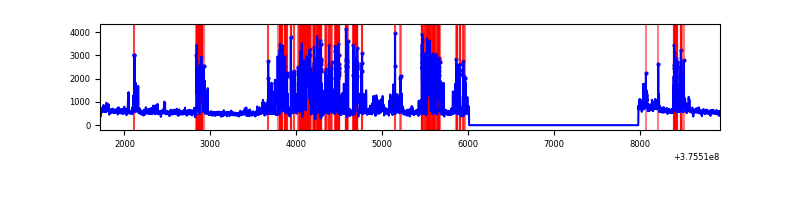 |
| C | 7220 | 5249 | 45 | 45 | 0.62% | 0.86% | 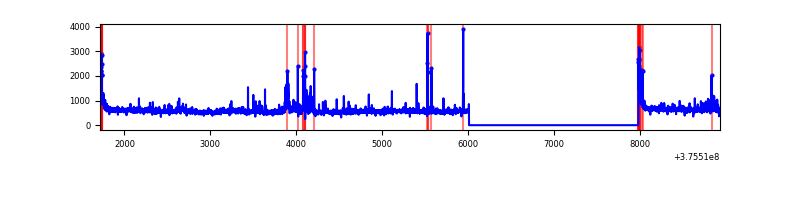 |
| D | 7220 | 5249 | 170 | 170 | 2.35% | 3.24% | 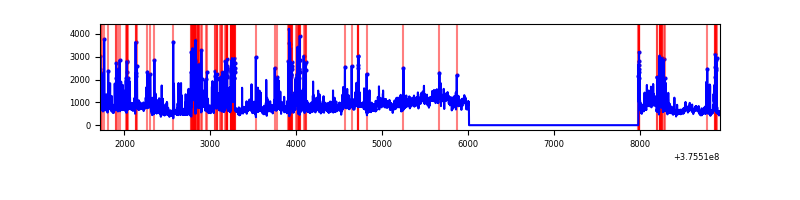 |
Top three noisy pixels from each quadrant. If the there are fewer than three noisy pixels in the level2.evt file, extra rows are filled as -1
| Pixel properties | Quadrant properties | ||||||
|---|---|---|---|---|---|---|---|
| Quadrant | DetID | PixID | Counts | Sigma | Mean | Median | Sigma |
| A | 15 | 169 | 48733 | 347.1 | 699 | 690 | 138.4 |
| A | 13 | 254 | 8298 | 54.97 | 699 | 690 | 138.4 |
| A | 13 | 6 | 7918 | 52.22 | 699 | 690 | 138.4 |
| B | 5 | 172 | 1335460 | 10546.81 | 671 | 658 | 126.6 |
| B | 0 | 190 | 133112 | 1046.57 | 671 | 658 | 126.6 |
| B | 0 | 219 | 118231 | 928.99 | 671 | 658 | 126.6 |
| C | 15 | 214 | 244646 | 1629.56 | 660 | 665 | 149.7 |
| C | 10 | 49 | 138597 | 921.25 | 660 | 665 | 149.7 |
| C | 0 | 10 | 106263 | 705.29 | 660 | 665 | 149.7 |
| D | 8 | 195 | 1031727 | 6446.35 | 658 | 641 | 159.9 |
| D | 2 | 250 | 797257 | 4980.44 | 658 | 641 | 159.9 |
| D | 7 | 222 | 192824 | 1201.53 | 658 | 641 | 159.9 |
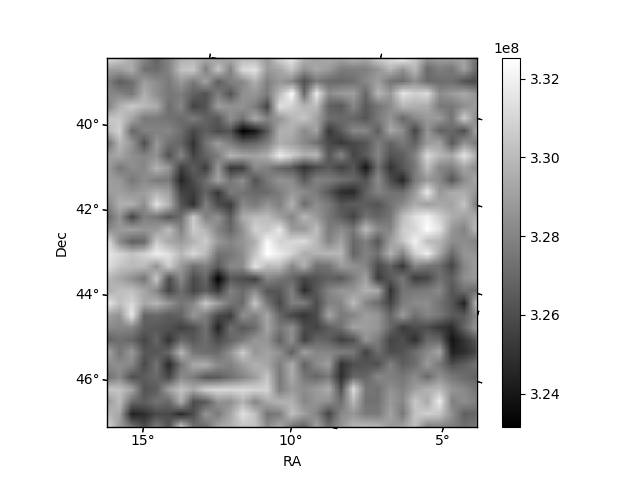
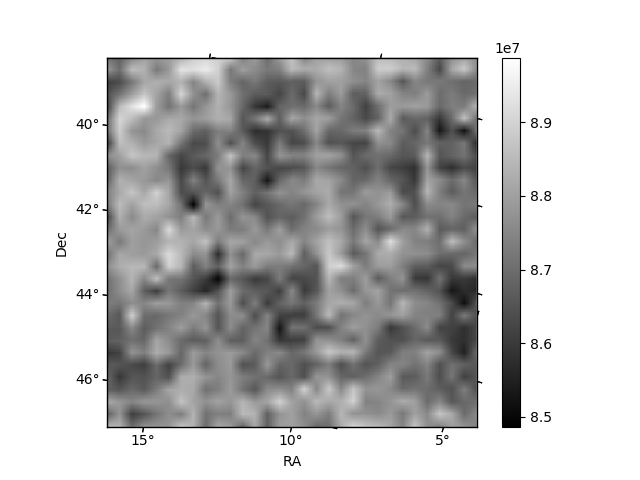
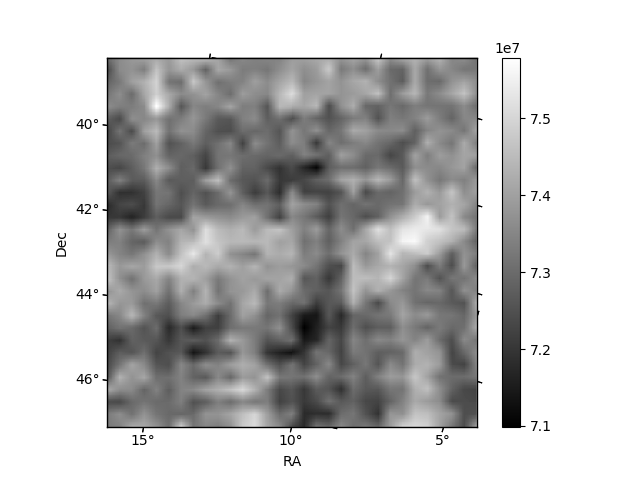
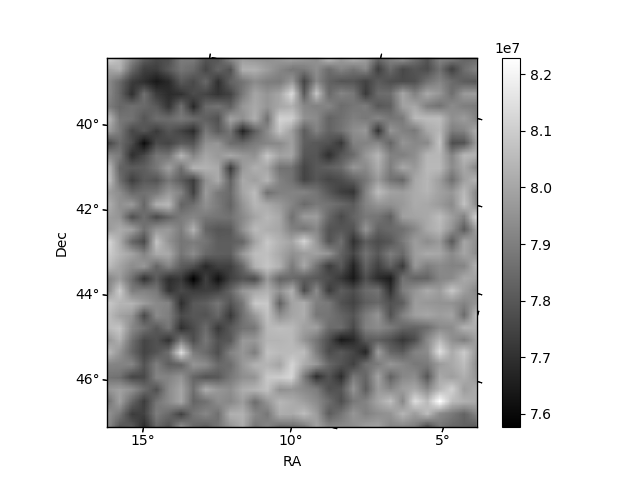
Histogram calculated using DETX and DETY for each event in the final _common_clean file
| Quadrant A | 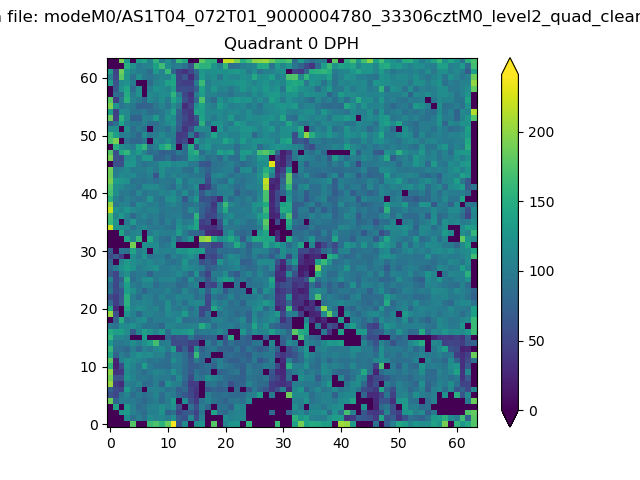 |
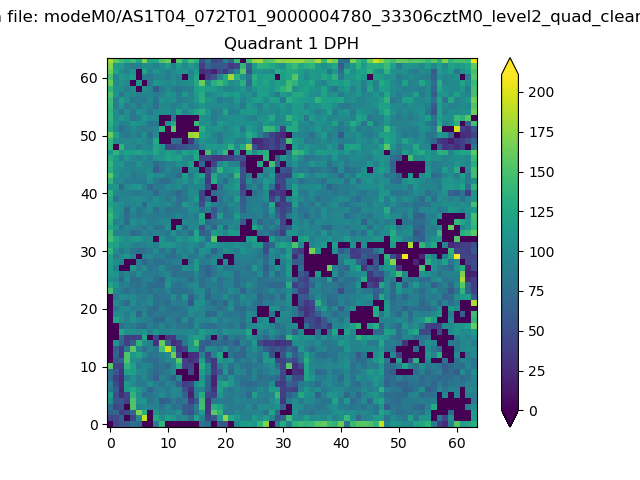 |
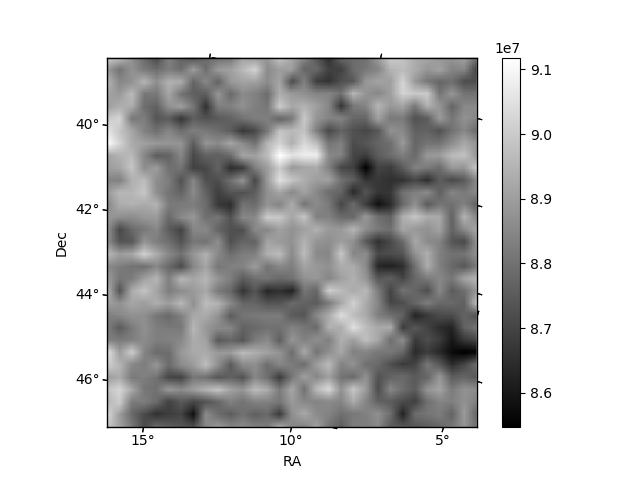
Quadrant B |
|---|---|---|---|
| Quadrant D | 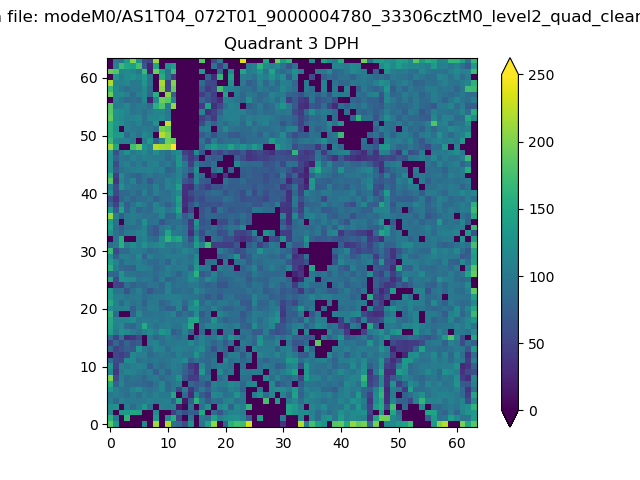 |
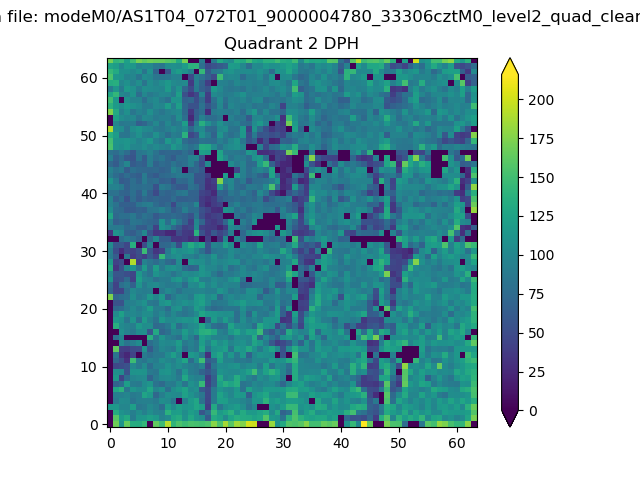 |
Quadrant C |
| Plot type | Count rate plots | Images |
|---|---|---|
| Comparison with Poisson distribution Blue bars denote a histogram of data divided into 1 sec bins. Red curve is a Poisson curve with rate = median count rate of data. |
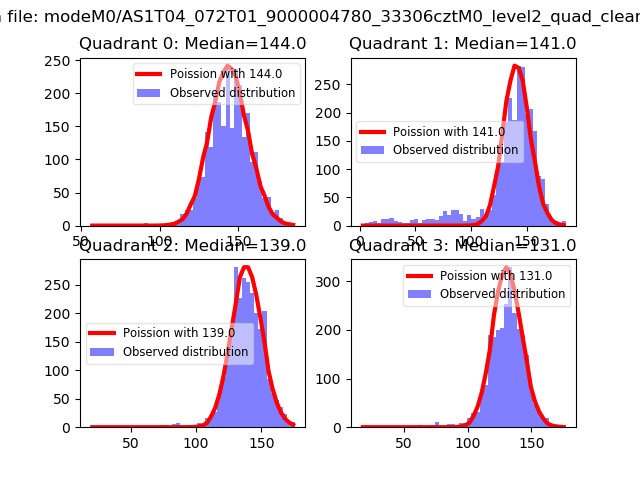 |
 |
| Quadrant-wise count rates Data is divided into 100 sec bins |
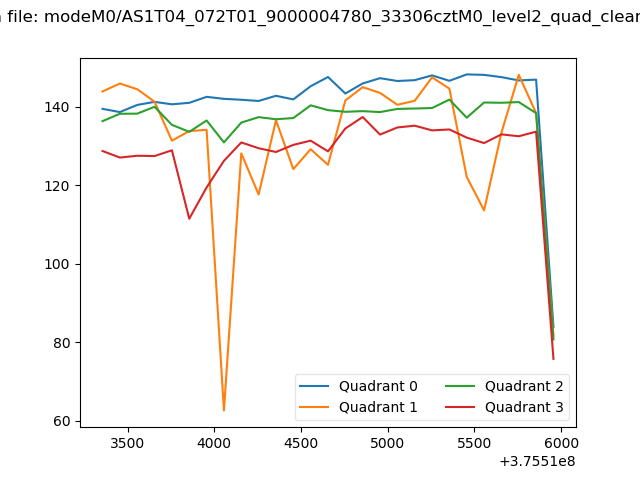 |
|
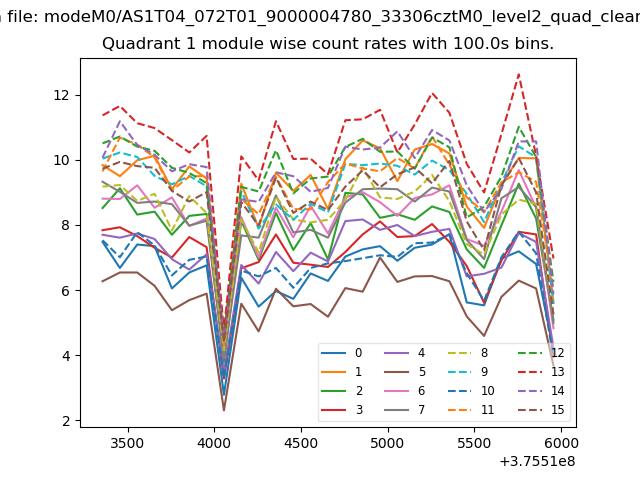
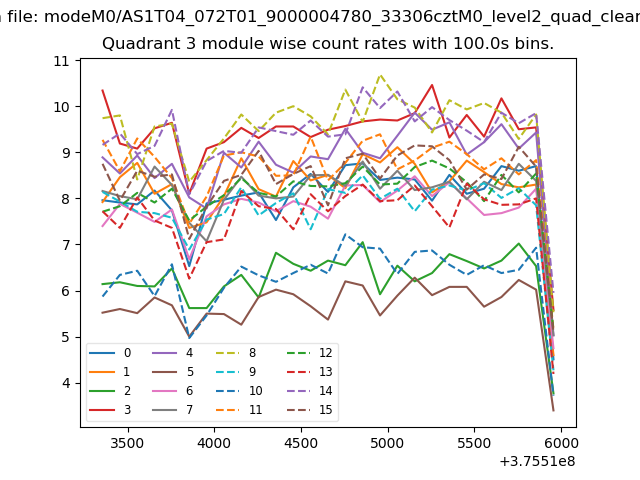
| Module-wise count rates for Quadrant A Data is divided into 100 sec bins |
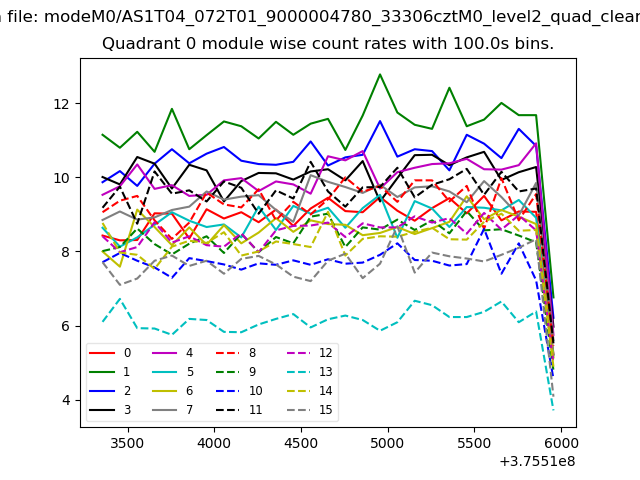 |
 |
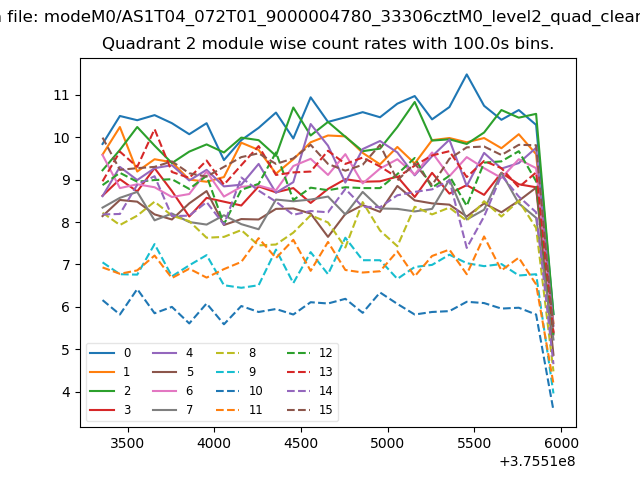
| Module-wise count rates for Quadrant B Data is divided into 100 sec bins |
 |
 |
| Module-wise count rates for Quadrant C Data is divided into 100 sec bins |
 |
 |
| Module-wise count rates for Quadrant D Data is divided into 100 sec bins |
 |
 |
| Parameter | Plot |
|---|---|
| CZT HV Monitor | 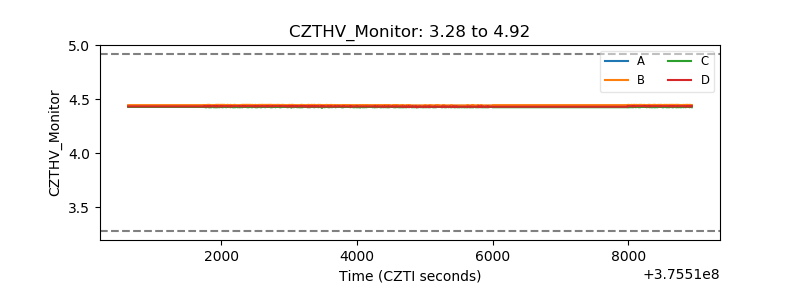 |
| D_VDD | 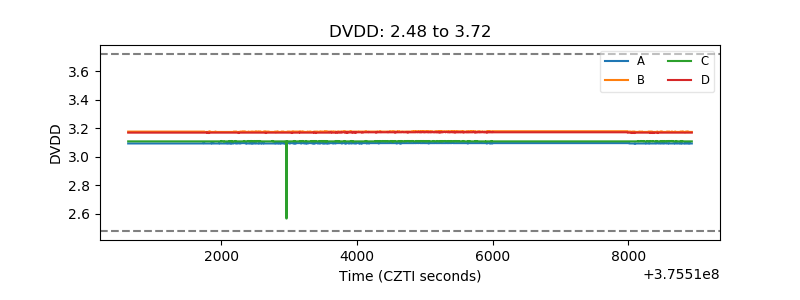 |
| Temperature 1 | 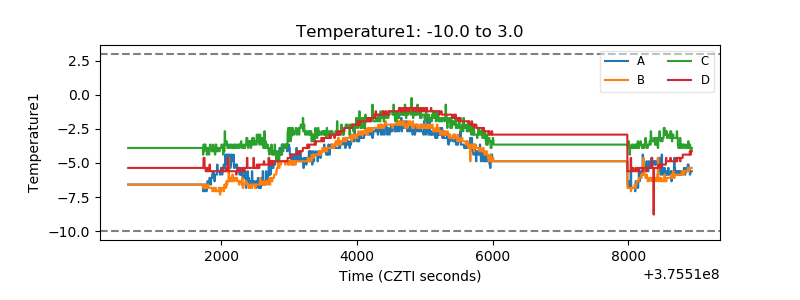 |
| Veto HV Monitor | 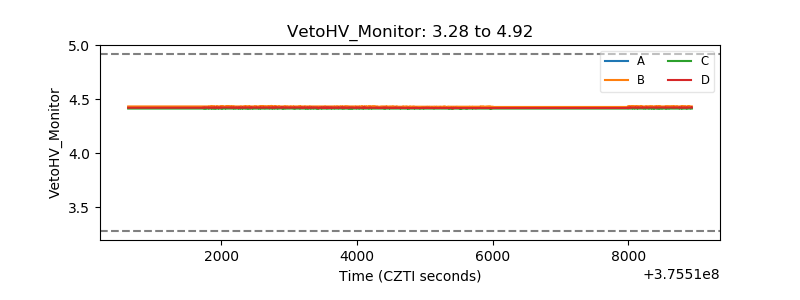 |
| Veto LLD | 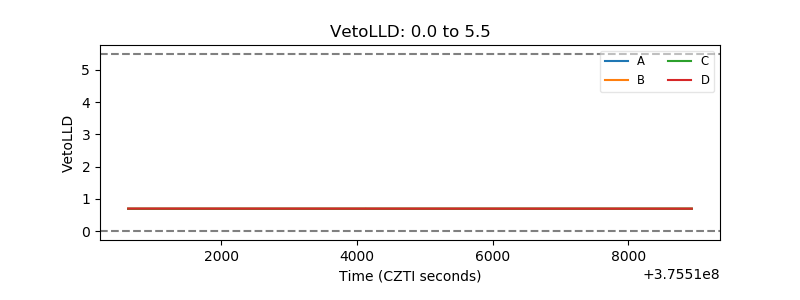 |
| Alpha Counter | 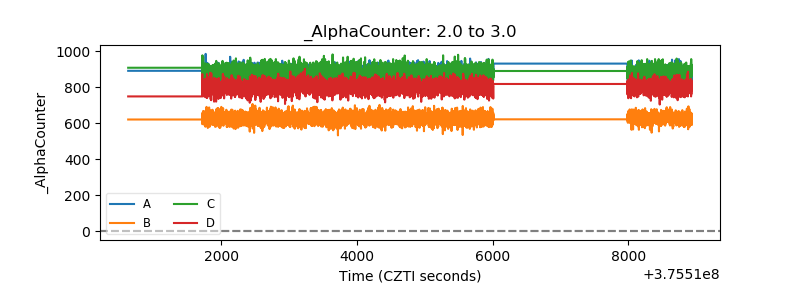 |
| _CPM_Rate | 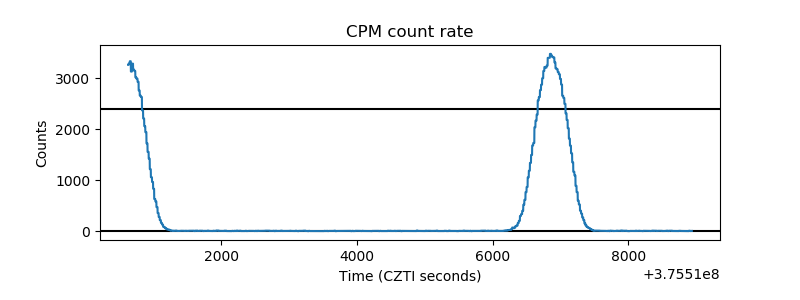 |
| CZT Counter | 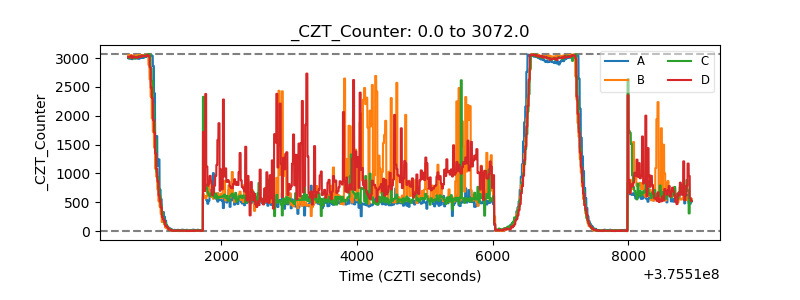 |
| +2.5 Volts monitor |  |
| +5 Volts monitor |  |
| _ROLL_ROT | 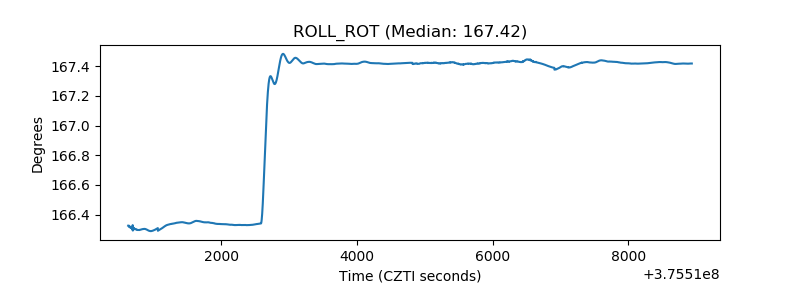 |
| _Roll_DEC | 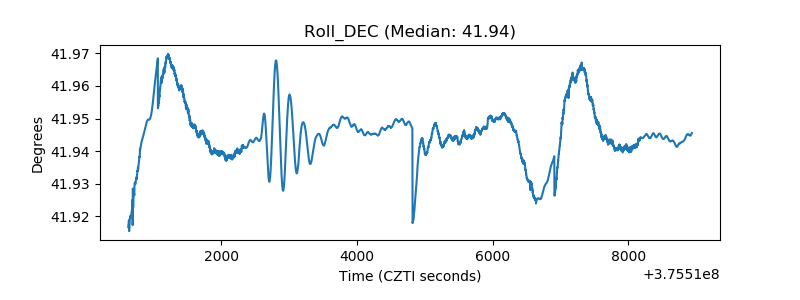 |
| _Roll_RA |  |
| Veto Counter | 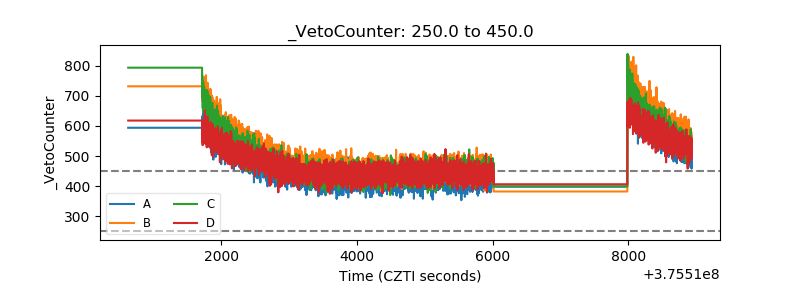 |