| Param | Original file | Final file |
|---|---|---|
| Filename | modeM0/AS1T04_072T01_9000004780_33307cztM0_level2.evt | modeM0/AS1T04_072T01_9000004780_33307cztM0_level2_quad_clean.evt |
| Size (bytes) | 531,132,480 | 67,809,600 |
| Size | 506.5 MB | 64.7 MB |
| Events in quadrant A | 2,686,693 | 454,340 |
| Events in quadrant B | 4,306,238 | 418,397 |
| Events in quadrant C | 4,457,777 | 422,673 |
| Events in quadrant D | 4,297,563 | 407,971 |
| Mode SS | |||
|---|---|---|---|
| Quadrant | BADHDUFLAG | Total packets | Discarded packets |
| A | 0 | 102 | 0 |
| B | 0 | 102 | 0 |
| C | 0 | 102 | 0 |
| D | 0 | 102 | 0 |
| Mode M0 | |||
|---|---|---|---|
| Quadrant | BADHDUFLAG | Total packets | Discarded packets |
| A | 0 | 10811 | 3 |
| B | 0 | 16075 | 2 |
| C | 0 | 16838 | 2 |
| D | 0 | 16431 | 2 |
| Mode M9 | |||
|---|---|---|---|
| Quadrant | BADHDUFLAG | Total packets | Discarded packets |
| A | 0 | 35 | 0 |
| B | 0 | 35 | 0 |
| C | 0 | 35 | 0 |
| D | 0 | 36 | 0 |
| Quadrant | Total seconds | Saturated seconds | Saturation percentage |
|---|---|---|---|
| A | 4983 | 9 | 0.180614% |
| B | 4983 | 545 | 10.937186% |
| C | 4983 | 272 | 5.458559% |
| D | 4983 | 140 | 2.809552% |
Noise dominated data is calculated using 1-second bins in cleaned event files. If a bin has >2000 counts, and if more than 50% of those come from <1% of pixels, then it is considered to be noise-dominated and hence unusable.
| Quadrant | # 1 sec bins | Bins with >0 counts | Bins with >2000 counts | High rate bins dominated by noise | Noise dominated (total time) | Noise dominated (detector-on time) | Marked lightcurve |
|---|---|---|---|---|---|---|---|
| A | 7046 | 4984 | 0 | 0 | 0.00% | 0.00% | 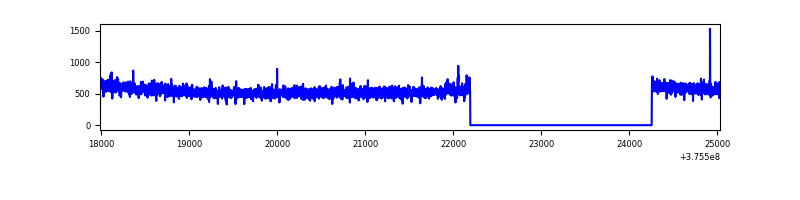 |
| B | 7046 | 4984 | 397 | 397 | 5.63% | 7.97% | 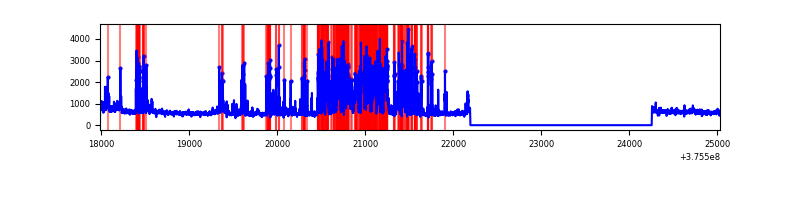 |
| C | 7046 | 4984 | 245 | 245 | 3.48% | 4.92% | 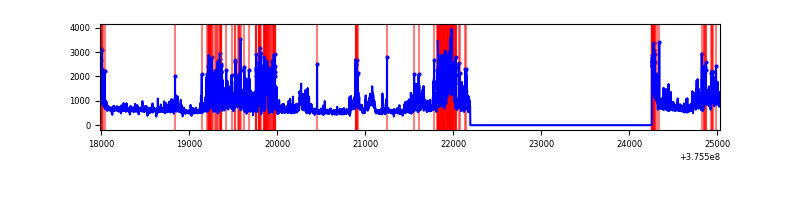 |
| D | 7046 | 4984 | 126 | 126 | 1.79% | 2.53% | 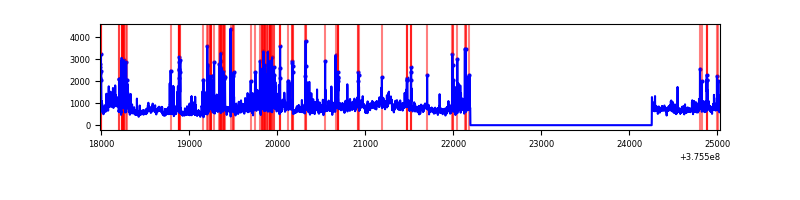 |
Top three noisy pixels from each quadrant. If the there are fewer than three noisy pixels in the level2.evt file, extra rows are filled as -1
| Pixel properties | Quadrant properties | ||||||
|---|---|---|---|---|---|---|---|
| Quadrant | DetID | PixID | Counts | Sigma | Mean | Median | Sigma |
| A | 15 | 169 | 22322 | 161.12 | 685 | 676 | 134.3 |
| A | 15 | 174 | 11837 | 83.08 | 685 | 676 | 134.3 |
| A | 13 | 6 | 8945 | 61.55 | 685 | 676 | 134.3 |
| B | 5 | 172 | 1327066 | 11098.35 | 651 | 639 | 119.5 |
| B | 0 | 219 | 214670 | 1790.82 | 651 | 639 | 119.5 |
| B | 0 | 190 | 116456 | 969.05 | 651 | 639 | 119.5 |
| C | 10 | 49 | 1293946 | 8903.93 | 636 | 641 | 145.3 |
| C | 15 | 208 | 264352 | 1815.55 | 636 | 641 | 145.3 |
| C | 15 | 214 | 229001 | 1572.17 | 636 | 641 | 145.3 |
| D | 8 | 195 | 741291 | 4674.53 | 648 | 630 | 158.4 |
| D | 2 | 250 | 464271 | 2926.17 | 648 | 630 | 158.4 |
| D | 7 | 222 | 187002 | 1176.25 | 648 | 630 | 158.4 |
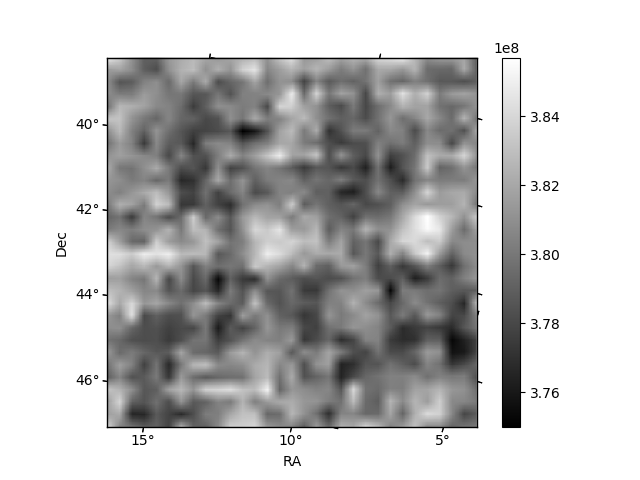
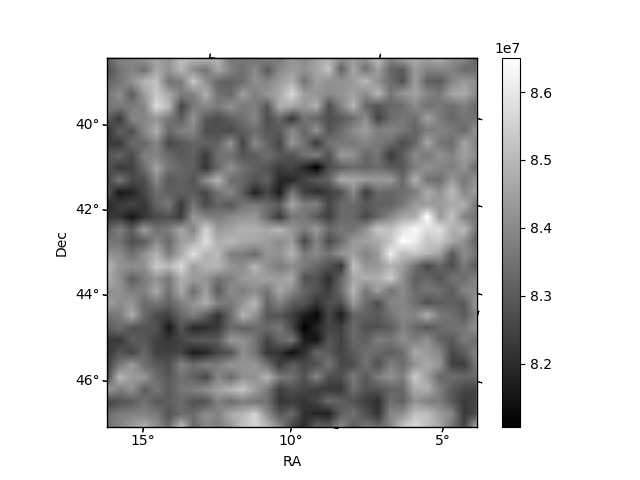
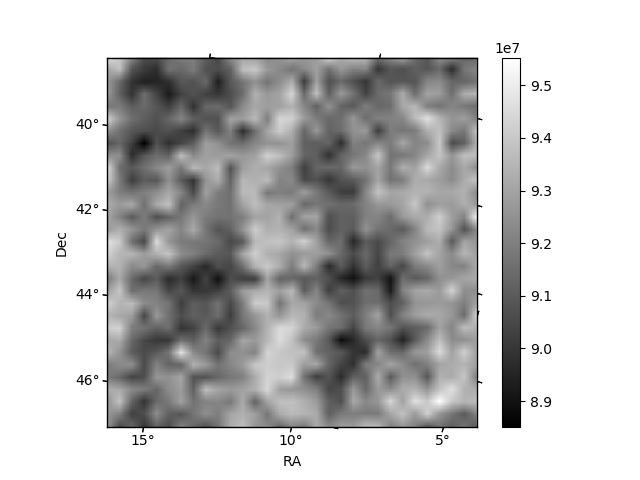
Histogram calculated using DETX and DETY for each event in the final _common_clean file
| Quadrant A | 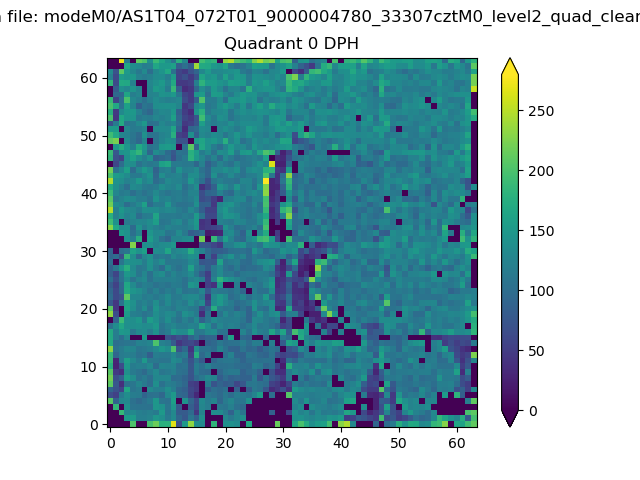 |
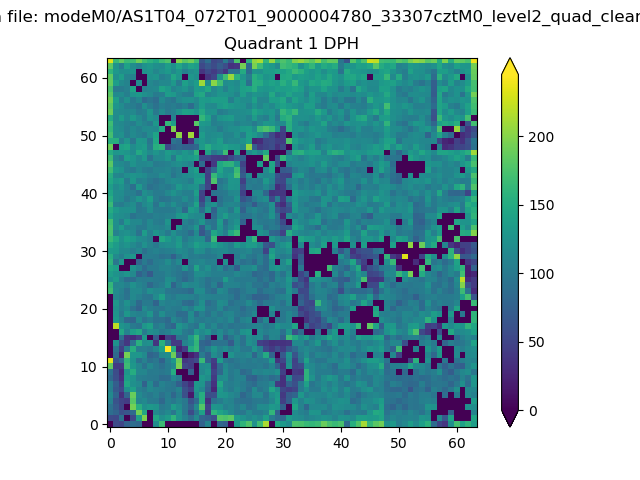 |
Quadrant B |
|---|---|---|---|
| Quadrant D | 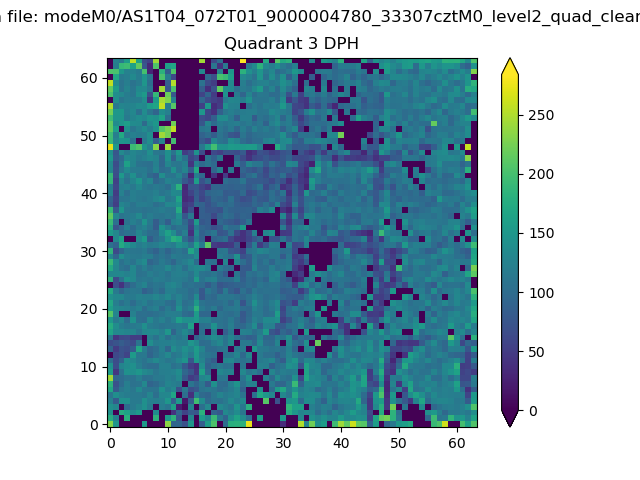 |
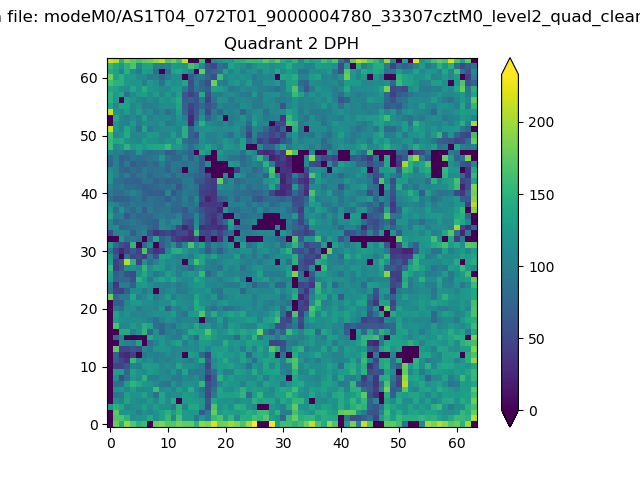 |
Quadrant C |
| Plot type | Count rate plots | Images |
|---|---|---|
| Comparison with Poisson distribution Blue bars denote a histogram of data divided into 1 sec bins. Red curve is a Poisson curve with rate = median count rate of data. |
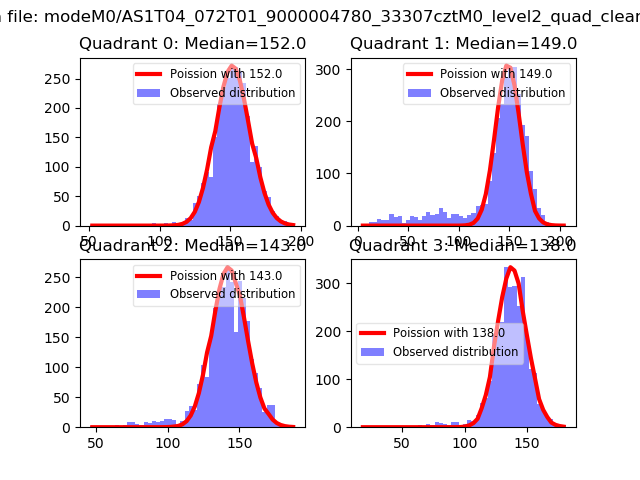 |
 |
| Quadrant-wise count rates Data is divided into 100 sec bins |
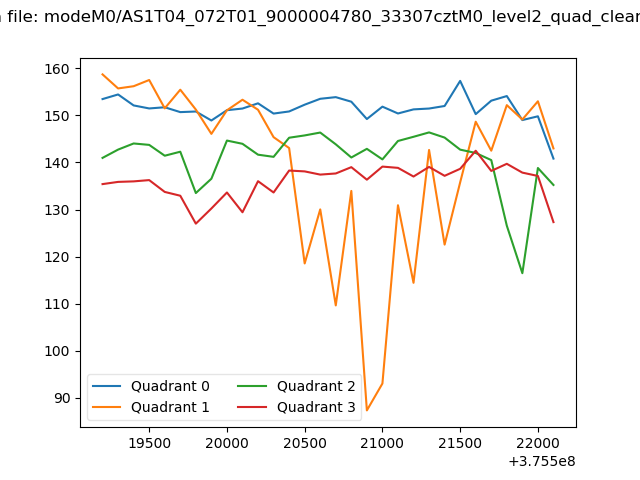 |
|
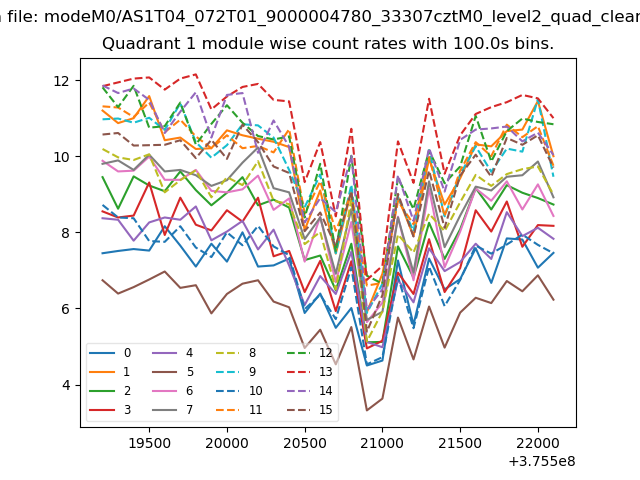
| Module-wise count rates for Quadrant A Data is divided into 100 sec bins |
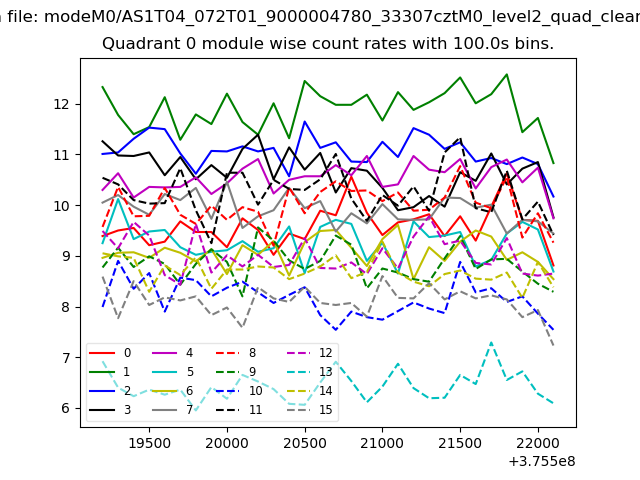 |
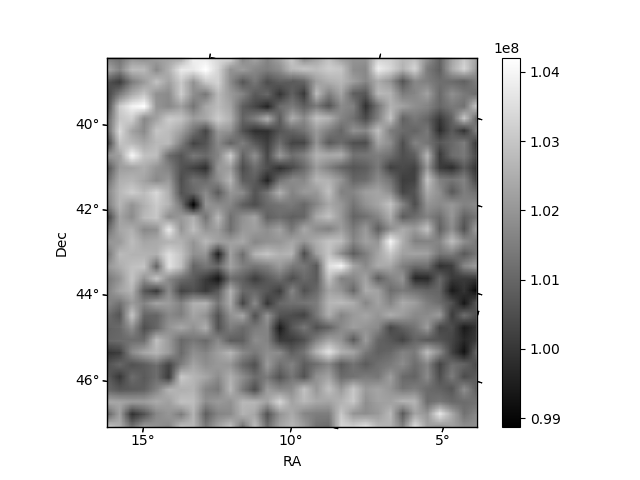 |
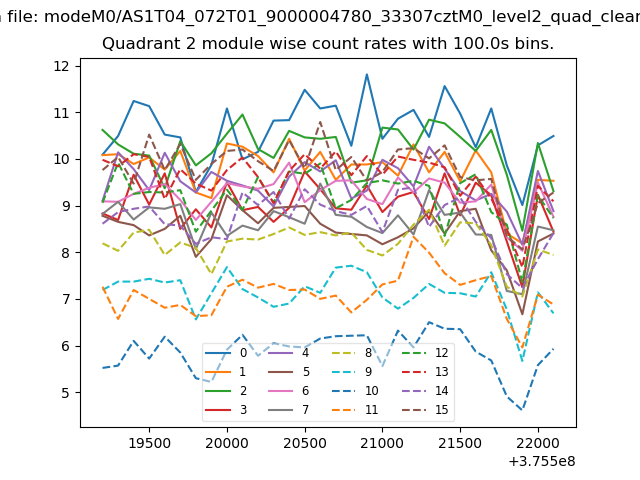
| Module-wise count rates for Quadrant B Data is divided into 100 sec bins |
 |
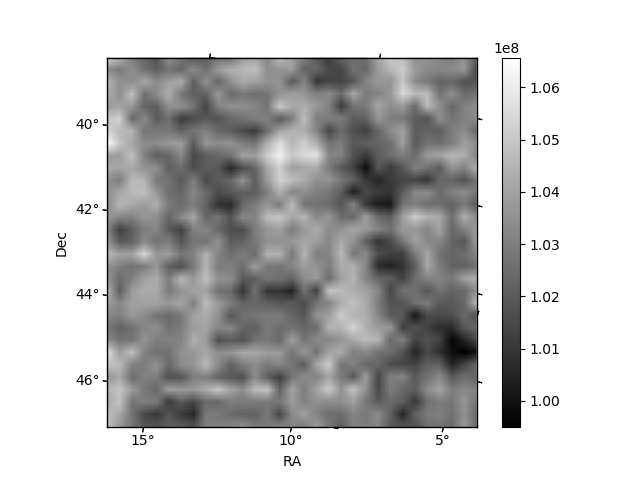 |
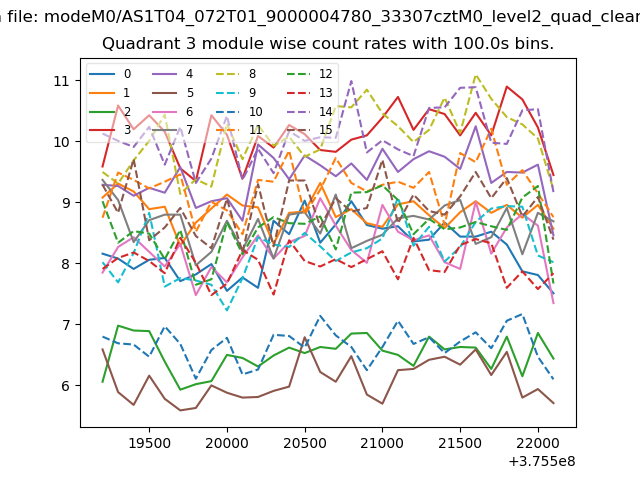
| Module-wise count rates for Quadrant C Data is divided into 100 sec bins |
 |
 |
| Module-wise count rates for Quadrant D Data is divided into 100 sec bins |
 |
 |
| Parameter | Plot |
|---|---|
| CZT HV Monitor | 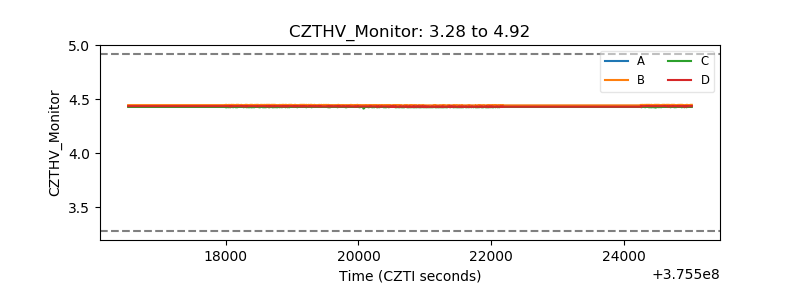 |
| D_VDD | 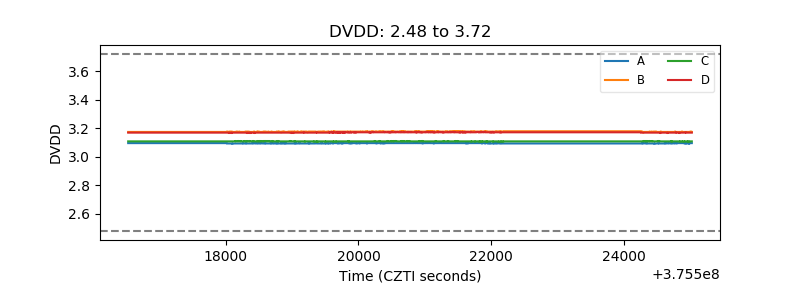 |
| Temperature 1 | 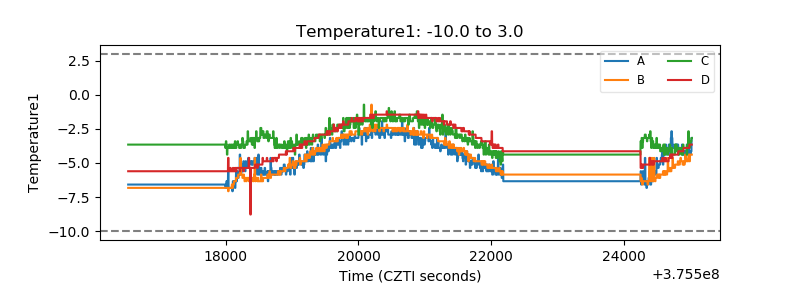 |
| Veto HV Monitor | 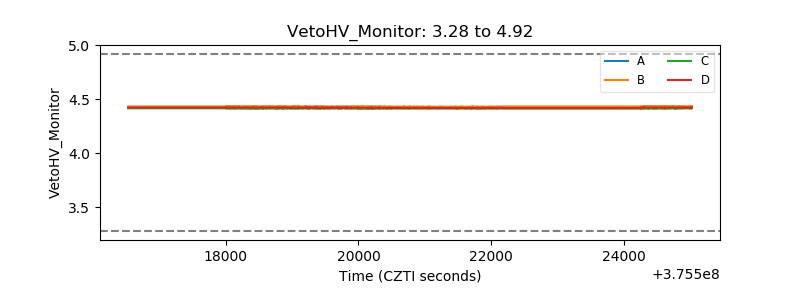 |
| Veto LLD |  |
| Alpha Counter | 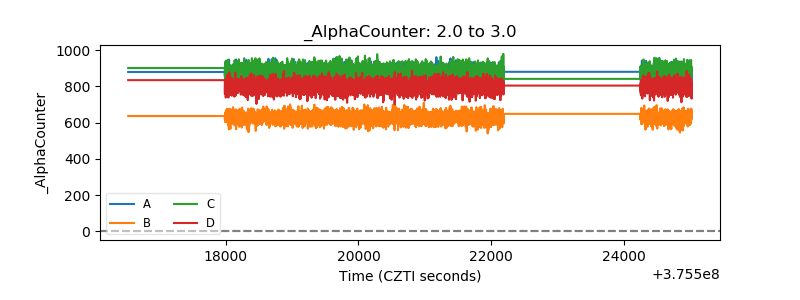 |
| _CPM_Rate |  |
| CZT Counter | 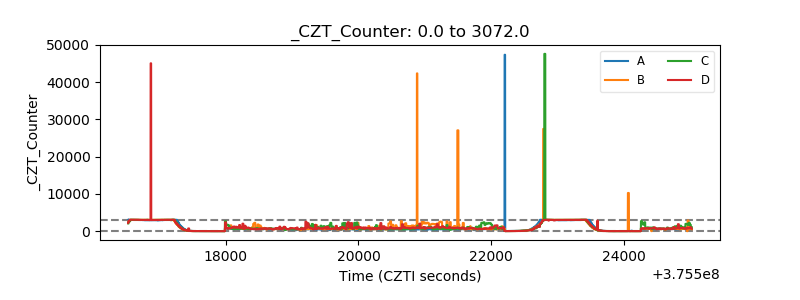 |
| +2.5 Volts monitor | 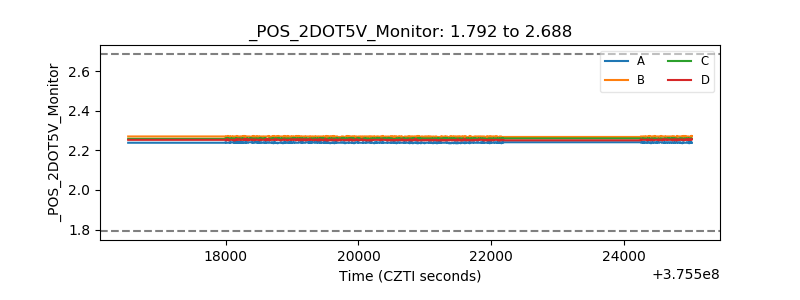 |
| +5 Volts monitor |  |
| _ROLL_ROT | 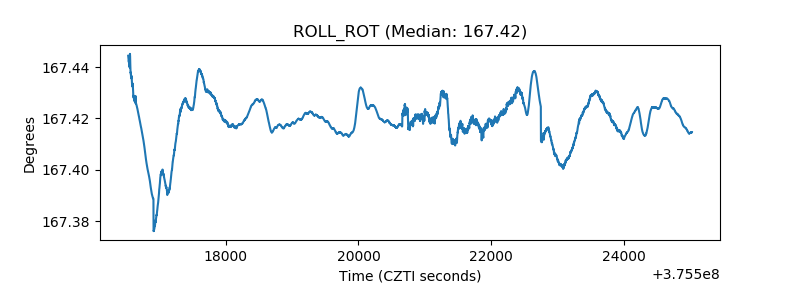 |
| _Roll_DEC | 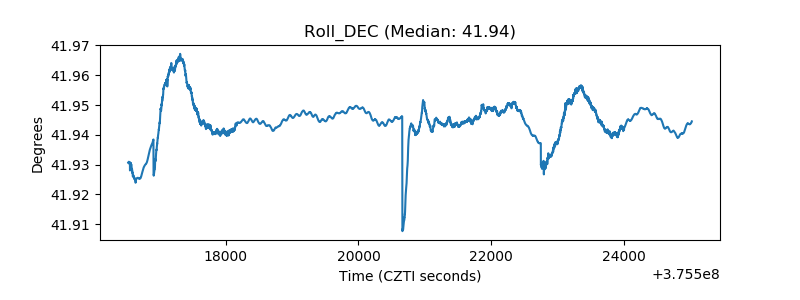 |
| _Roll_RA | 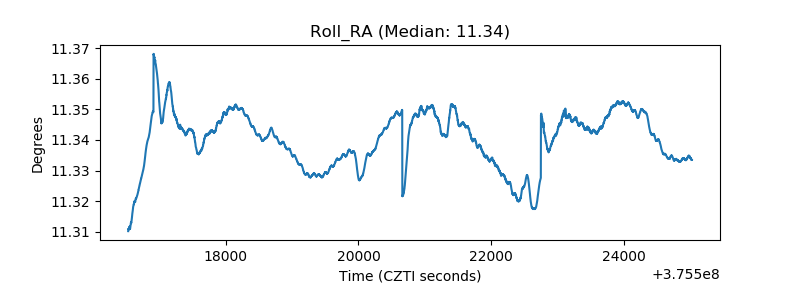 |
| Veto Counter | 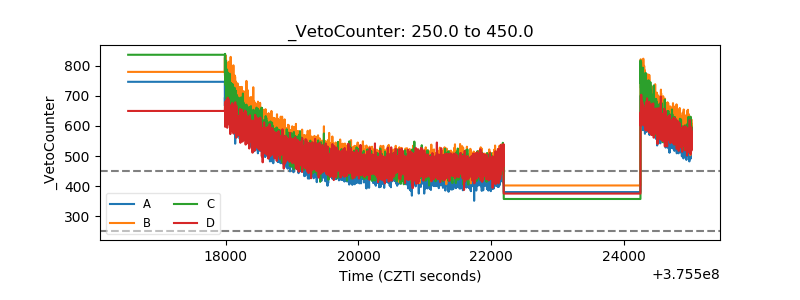 |