| Param | Original file | Final file |
|---|---|---|
| Filename | modeM0/AS1T04_072T01_9000004780_33308cztM0_level2.evt | modeM0/AS1T04_072T01_9000004780_33308cztM0_level2_quad_clean.evt |
| Size (bytes) | 559,002,240 | 85,224,960 |
| Size | 533.1 MB | 81.3 MB |
| Events in quadrant A | 2,661,818 | 594,680 |
| Events in quadrant B | 3,396,865 | 587,737 |
| Events in quadrant C | 6,543,032 | 515,870 |
| Events in quadrant D | 3,993,498 | 535,200 |
| Mode SS | |||
|---|---|---|---|
| Quadrant | BADHDUFLAG | Total packets | Discarded packets |
| A | 0 | 100 | 0 |
| B | 0 | 100 | 0 |
| C | 0 | 100 | 0 |
| D | 0 | 100 | 0 |
| Mode M0 | |||
|---|---|---|---|
| Quadrant | BADHDUFLAG | Total packets | Discarded packets |
| A | 0 | 10625 | 3 |
| B | 0 | 13243 | 2 |
| C | 0 | 22997 | 2 |
| D | 0 | 15499 | 2 |
| Mode M9 | |||
|---|---|---|---|
| Quadrant | BADHDUFLAG | Total packets | Discarded packets |
| A | 0 | 31 | 0 |
| B | 0 | 31 | 0 |
| C | 0 | 31 | 0 |
| D | 0 | 32 | 0 |
| Quadrant | Total seconds | Saturated seconds | Saturation percentage |
|---|---|---|---|
| A | 4950 | 12 | 0.242424% |
| B | 4950 | 164 | 3.313131% |
| C | 4950 | 951 | 19.212121% |
| D | 4950 | 142 | 2.868687% |
Noise dominated data is calculated using 1-second bins in cleaned event files. If a bin has >2000 counts, and if more than 50% of those come from <1% of pixels, then it is considered to be noise-dominated and hence unusable.
| Quadrant | # 1 sec bins | Bins with >0 counts | Bins with >2000 counts | High rate bins dominated by noise | Noise dominated (total time) | Noise dominated (detector-on time) | Marked lightcurve |
|---|---|---|---|---|---|---|---|
| A | 7103 | 4951 | 0 | 0 | 0.00% | 0.00% | 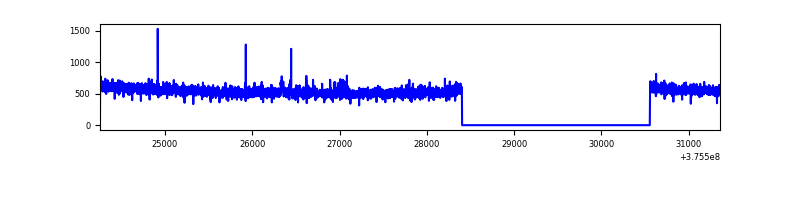 |
| B | 7103 | 4951 | 118 | 118 | 1.66% | 2.38% | 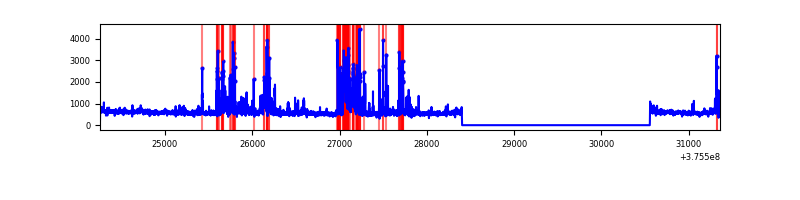 |
| C | 7103 | 4951 | 782 | 782 | 11.01% | 15.79% | 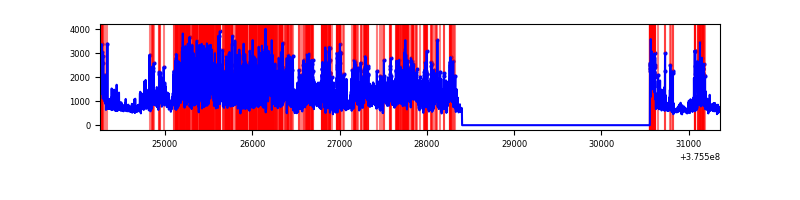 |
| D | 7103 | 4951 | 123 | 123 | 1.73% | 2.48% | 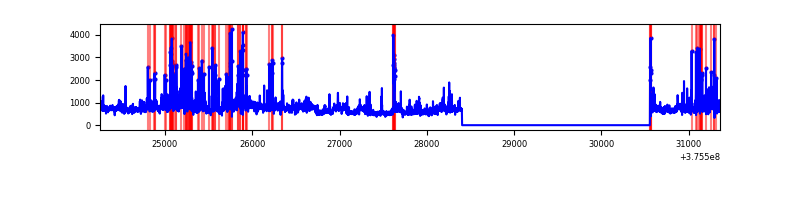 |
Top three noisy pixels from each quadrant. If the there are fewer than three noisy pixels in the level2.evt file, extra rows are filled as -1
| Pixel properties | Quadrant properties | ||||||
|---|---|---|---|---|---|---|---|
| Quadrant | DetID | PixID | Counts | Sigma | Mean | Median | Sigma |
| A | 15 | 169 | 42353 | 310.64 | 676 | 664 | 134.2 |
| A | 13 | 6 | 8814 | 60.73 | 676 | 664 | 134.2 |
| A | 13 | 254 | 7778 | 53.01 | 676 | 664 | 134.2 |
| B | 5 | 172 | 550619 | 4499.27 | 660 | 647 | 122.2 |
| B | 0 | 219 | 130449 | 1061.9 | 660 | 647 | 122.2 |
| B | 15 | 85 | 46208 | 372.73 | 660 | 647 | 122.2 |
| C | 10 | 49 | 3654511 | 27022.41 | 599 | 606 | 135.2 |
| C | 15 | 214 | 222491 | 1640.95 | 599 | 606 | 135.2 |
| C | 0 | 10 | 113312 | 833.52 | 599 | 606 | 135.2 |
| D | 8 | 195 | 749665 | 4856.18 | 638 | 622 | 154.2 |
| D | 2 | 250 | 227414 | 1470.33 | 638 | 622 | 154.2 |
| D | 12 | 6 | 131651 | 849.48 | 638 | 622 | 154.2 |
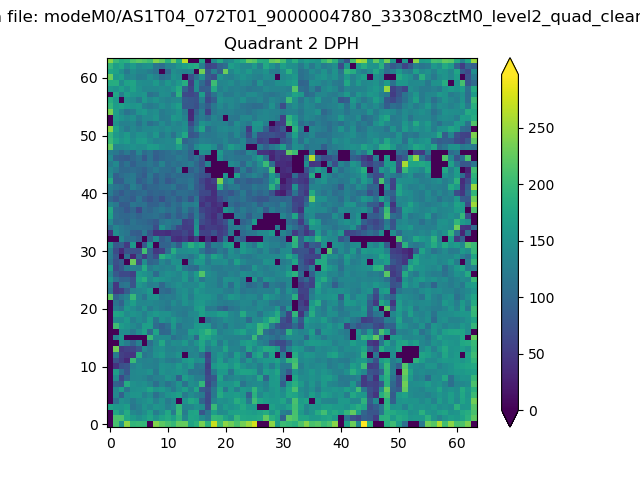
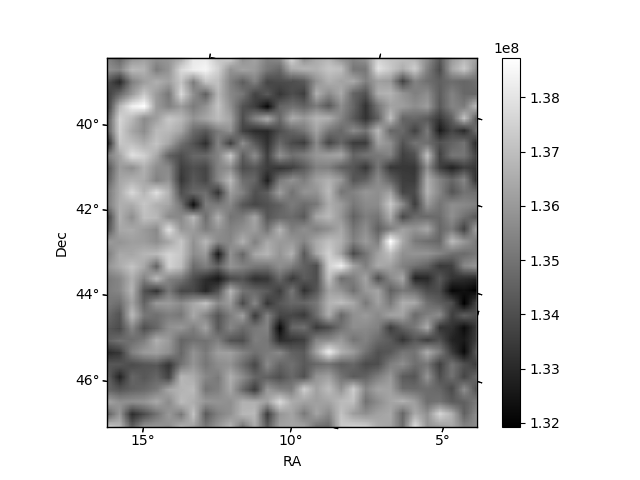
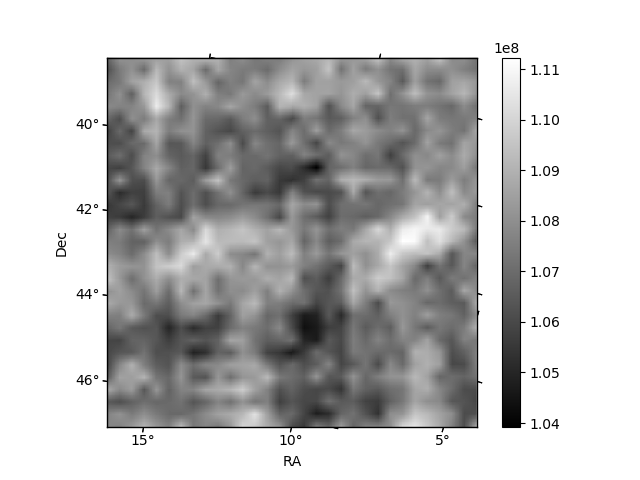
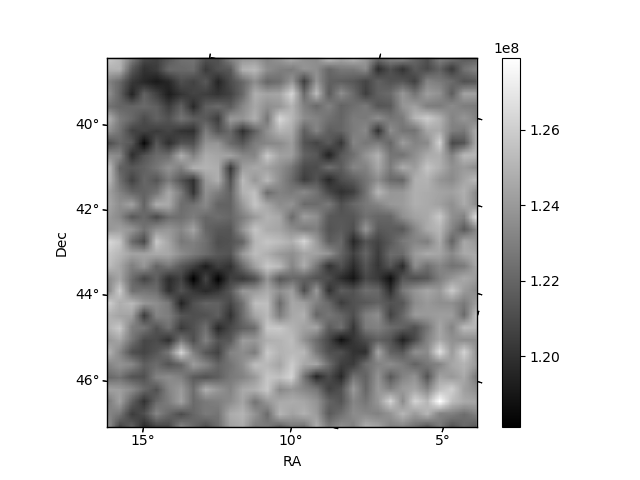
Histogram calculated using DETX and DETY for each event in the final _common_clean file
| Quadrant A | 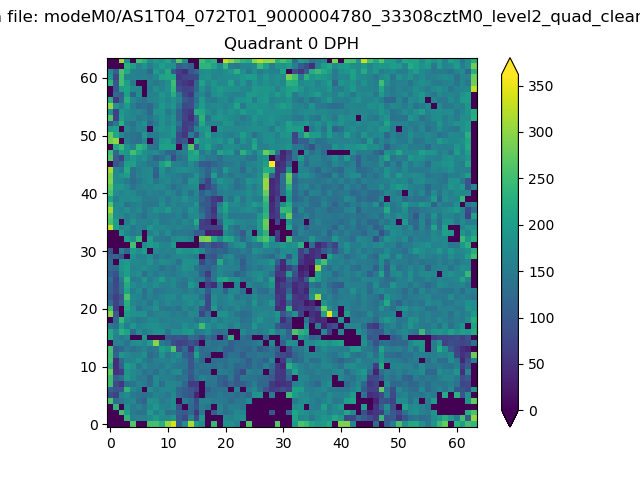 |
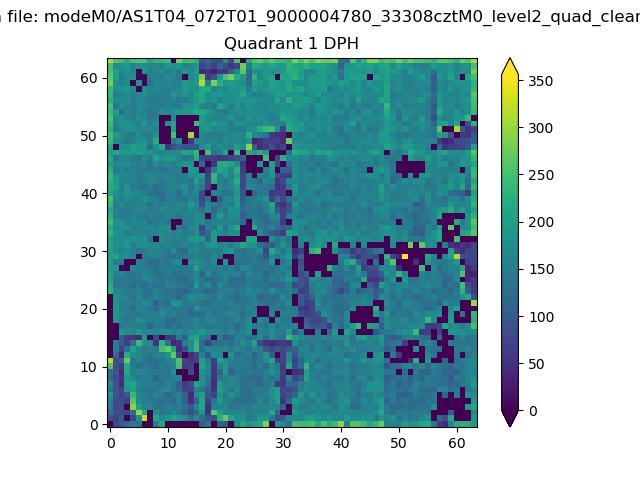 |
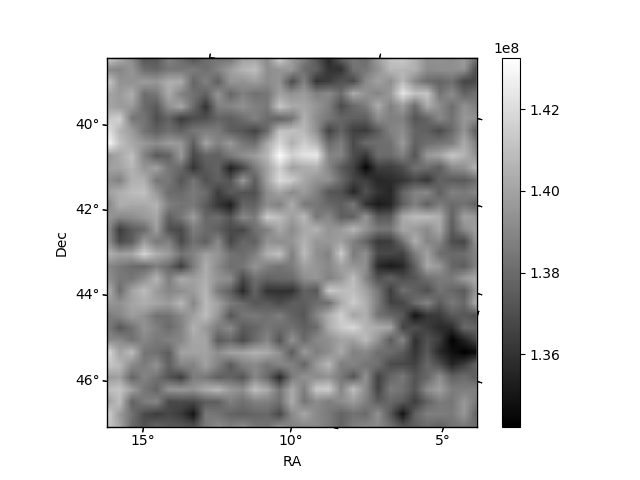
Quadrant B |
|---|---|---|---|
| Quadrant D | 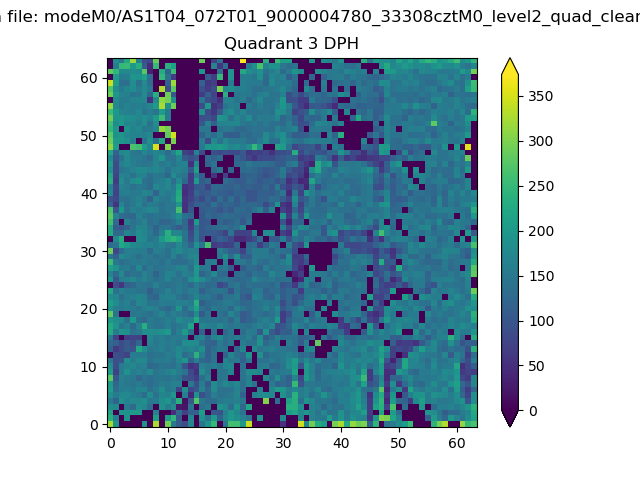 |
 |
Quadrant C |
| Plot type | Count rate plots | Images |
|---|---|---|
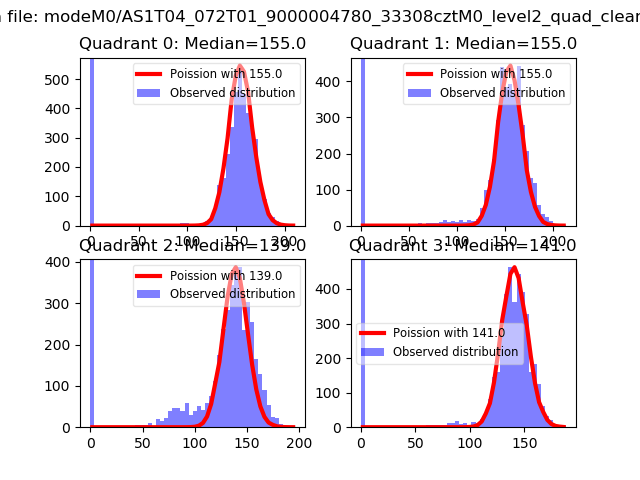
| Comparison with Poisson distribution Blue bars denote a histogram of data divided into 1 sec bins. Red curve is a Poisson curve with rate = median count rate of data. |
 |
 |
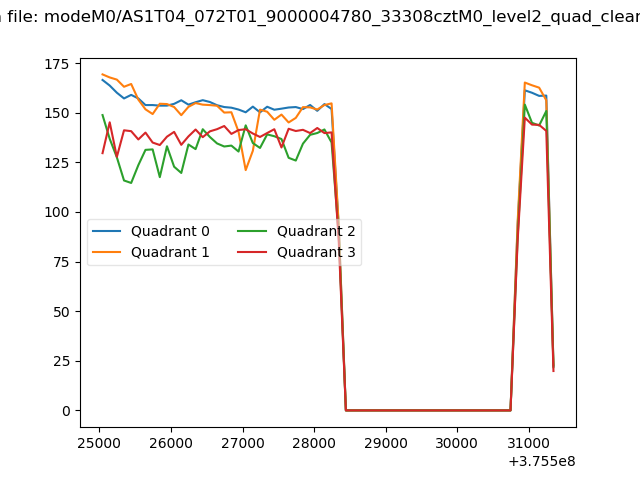
| Quadrant-wise count rates Data is divided into 100 sec bins |
 |
|
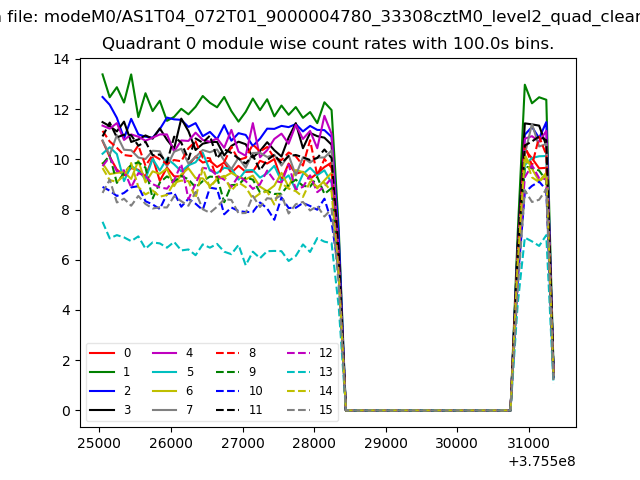
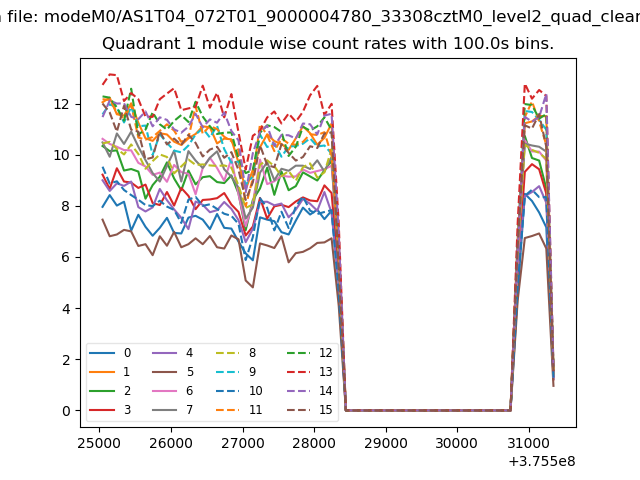
| Module-wise count rates for Quadrant A Data is divided into 100 sec bins |
 |
 |
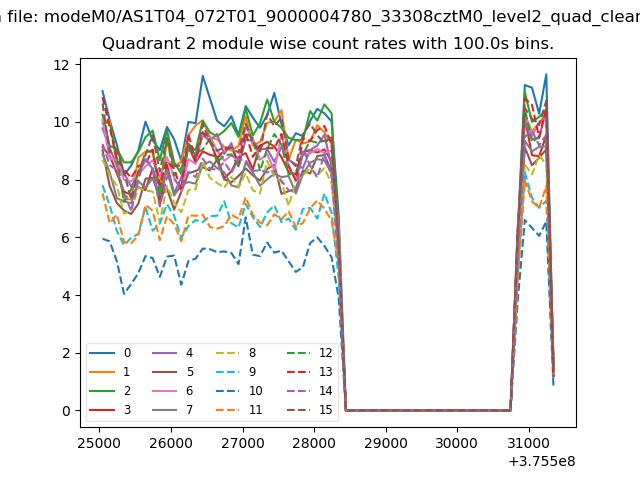
| Module-wise count rates for Quadrant B Data is divided into 100 sec bins |
 |
 |
| Module-wise count rates for Quadrant C Data is divided into 100 sec bins |
 |
 |
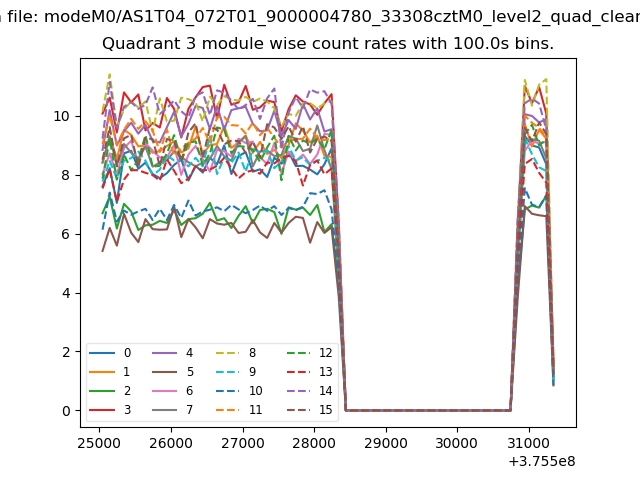
| Module-wise count rates for Quadrant D Data is divided into 100 sec bins |
 |
 |
| Parameter | Plot |
|---|---|
| CZT HV Monitor | 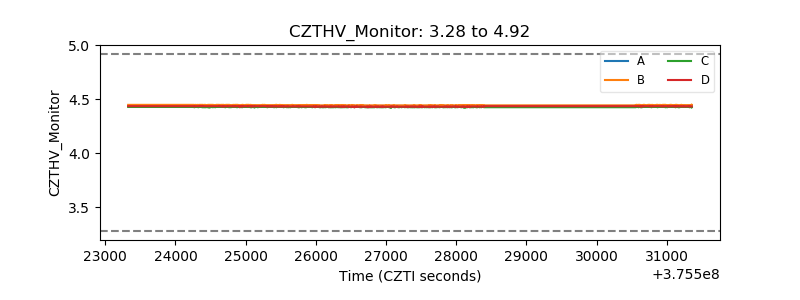 |
| D_VDD | 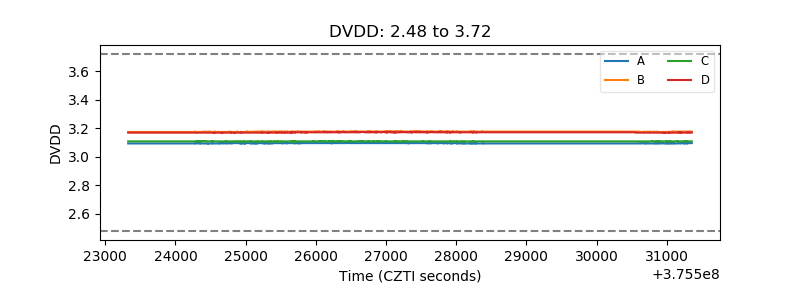 |
| Temperature 1 | 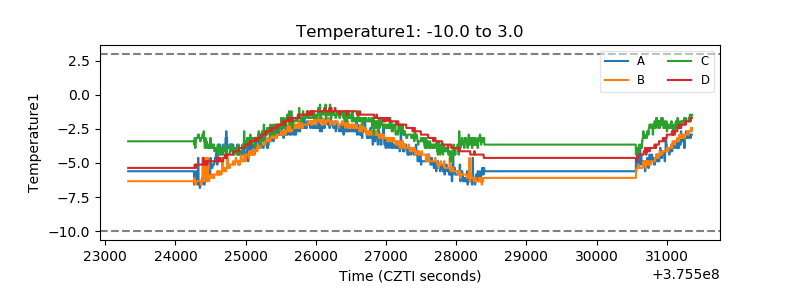 |
| Veto HV Monitor | 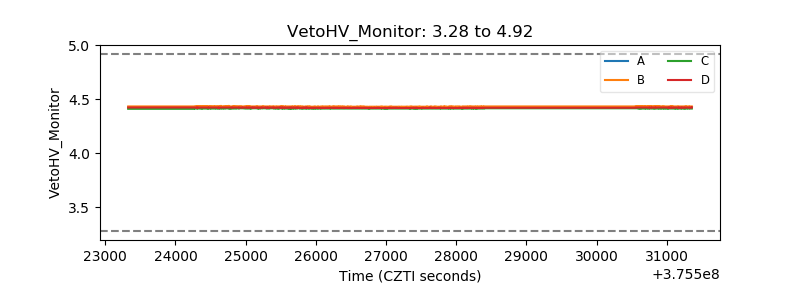 |
| Veto LLD | 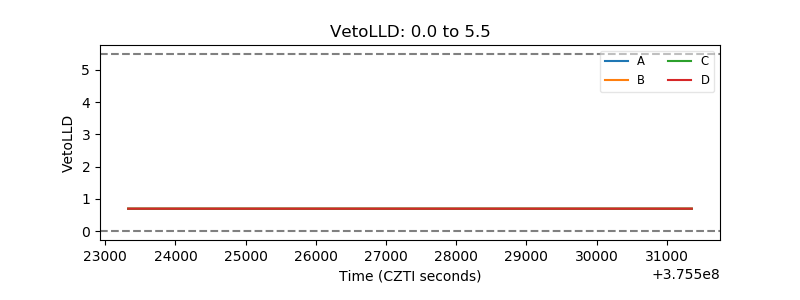 |
| Alpha Counter | 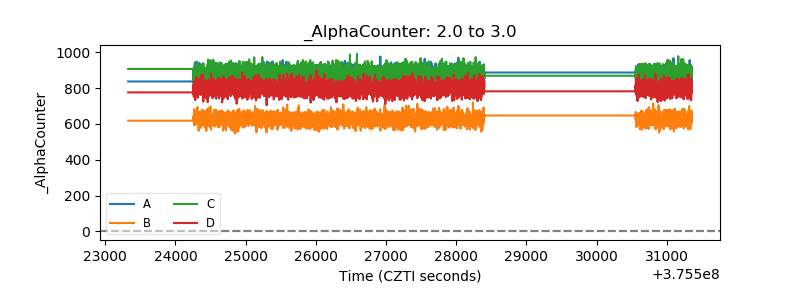 |
| _CPM_Rate | 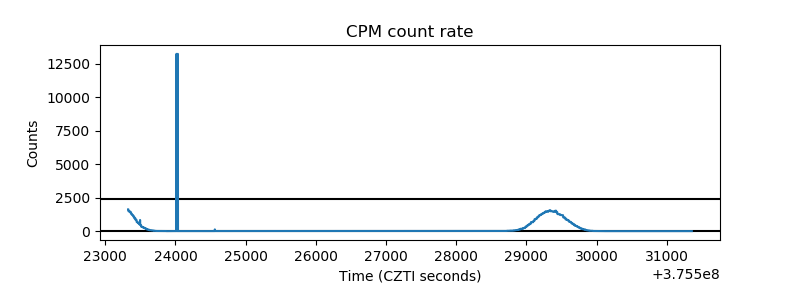 |
| CZT Counter | 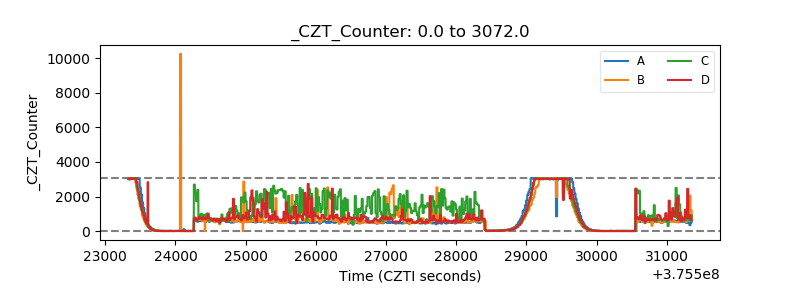 |
| +2.5 Volts monitor |  |
| +5 Volts monitor |  |
| _ROLL_ROT | 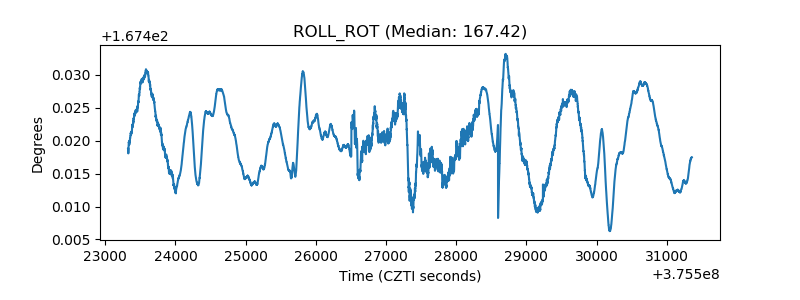 |
| _Roll_DEC | 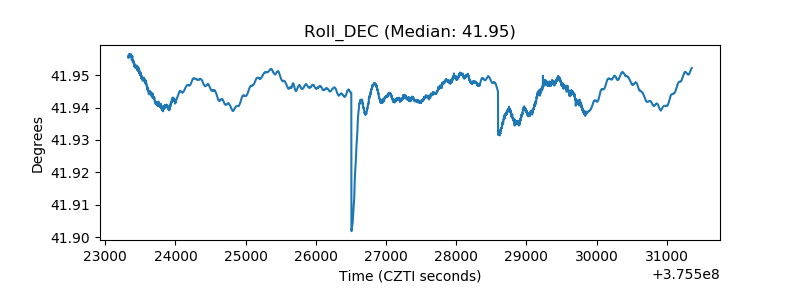 |
| _Roll_RA | 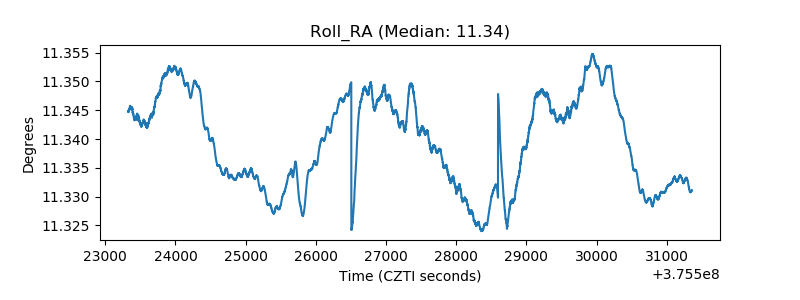 |
| Veto Counter | 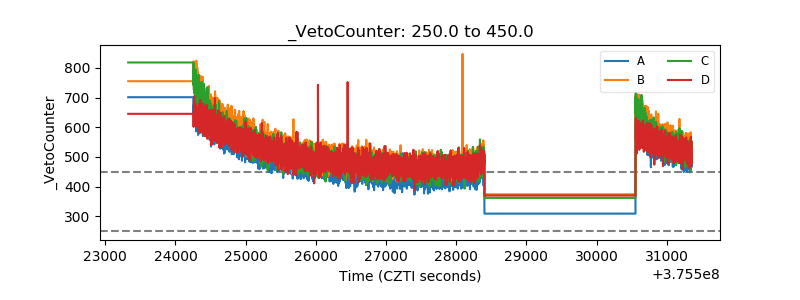 |