| Param | Original file | Final file |
|---|---|---|
| Filename | modeM0/AS1T04_072T01_9000004780_33310cztM0_level2.evt | modeM0/AS1T04_072T01_9000004780_33310cztM0_level2_quad_clean.evt |
| Size (bytes) | 495,253,440 | 89,406,720 |
| Size | 472.3 MB | 85.3 MB |
| Events in quadrant A | 2,638,205 | 618,748 |
| Events in quadrant B | 4,268,119 | 581,375 |
| Events in quadrant C | 4,132,547 | 577,772 |
| Events in quadrant D | 3,618,672 | 576,190 |
| Mode SS | |||
|---|---|---|---|
| Quadrant | BADHDUFLAG | Total packets | Discarded packets |
| A | 0 | 102 | 0 |
| B | 0 | 102 | 0 |
| C | 0 | 102 | 0 |
| D | 0 | 102 | 0 |
| Mode M0 | |||
|---|---|---|---|
| Quadrant | BADHDUFLAG | Total packets | Discarded packets |
| A | 0 | 10760 | 2 |
| B | 0 | 15963 | 1 |
| C | 0 | 15548 | 1 |
| D | 0 | 14353 | 1 |
| Mode M9 | |||
|---|---|---|---|
| Quadrant | BADHDUFLAG | Total packets | Discarded packets |
| A | 0 | 29 | 0 |
| B | 0 | 29 | 0 |
| C | 0 | 29 | 0 |
| D | 0 | 30 | 0 |
| Quadrant | Total seconds | Saturated seconds | Saturation percentage |
|---|---|---|---|
| A | 5041 | 22 | 0.436421% |
| B | 5041 | 519 | 10.295576% |
| C | 5041 | 222 | 4.403888% |
| D | 5041 | 74 | 1.467963% |
Noise dominated data is calculated using 1-second bins in cleaned event files. If a bin has >2000 counts, and if more than 50% of those come from <1% of pixels, then it is considered to be noise-dominated and hence unusable.
| Quadrant | # 1 sec bins | Bins with >0 counts | Bins with >2000 counts | High rate bins dominated by noise | Noise dominated (total time) | Noise dominated (detector-on time) | Marked lightcurve |
|---|---|---|---|---|---|---|---|
| A | 7012 | 5042 | 8 | 8 | 0.11% | 0.16% | 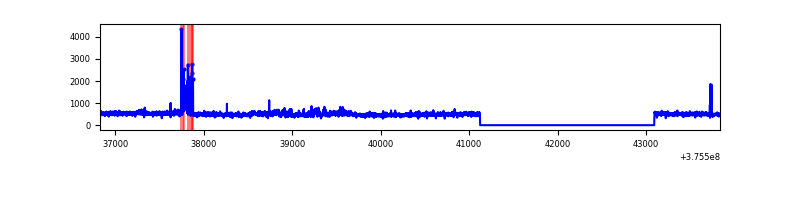 |
| B | 7012 | 5042 | 378 | 378 | 5.39% | 7.50% | 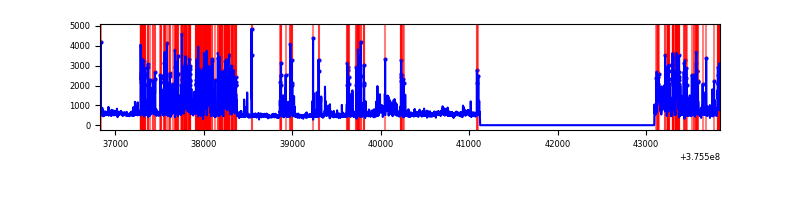 |
| C | 7012 | 5042 | 173 | 173 | 2.47% | 3.43% | 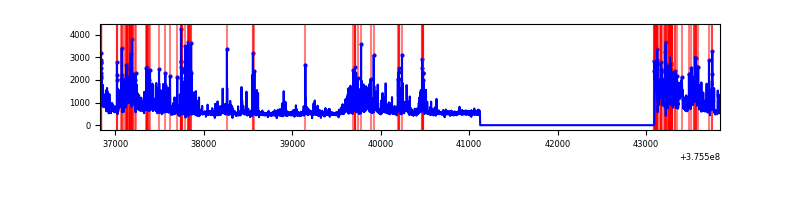 |
| D | 7012 | 5042 | 54 | 54 | 0.77% | 1.07% | 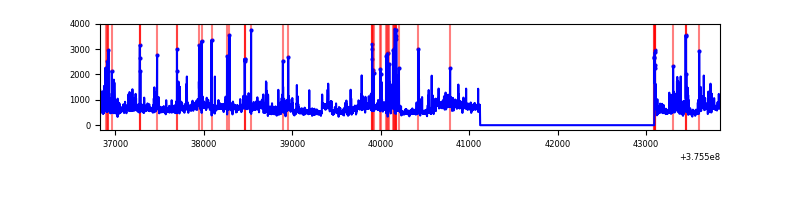 |
Top three noisy pixels from each quadrant. If the there are fewer than three noisy pixels in the level2.evt file, extra rows are filled as -1
| Pixel properties | Quadrant properties | ||||||
|---|---|---|---|---|---|---|---|
| Quadrant | DetID | PixID | Counts | Sigma | Mean | Median | Sigma |
| A | 15 | 169 | 211115 | 1684.63 | 620 | 608 | 125.0 |
| A | 15 | 47 | 23385 | 182.28 | 620 | 608 | 125.0 |
| A | 13 | 6 | 8953 | 66.78 | 620 | 608 | 125.0 |
| B | 5 | 172 | 1512586 | 13637.14 | 587 | 574 | 110.9 |
| B | 0 | 219 | 216498 | 1947.46 | 587 | 574 | 110.9 |
| B | 5 | 200 | 36409 | 323.2 | 587 | 574 | 110.9 |
| C | 10 | 49 | 1078585 | 8075.05 | 585 | 590 | 133.5 |
| C | 1 | 23 | 308880 | 2309.34 | 585 | 590 | 133.5 |
| C | 15 | 214 | 236584 | 1767.78 | 585 | 590 | 133.5 |
| D | 8 | 195 | 694676 | 4478.1 | 596 | 585 | 155.0 |
| D | 2 | 250 | 155557 | 999.84 | 596 | 585 | 155.0 |
| D | 12 | 218 | 92651 | 593.99 | 596 | 585 | 155.0 |
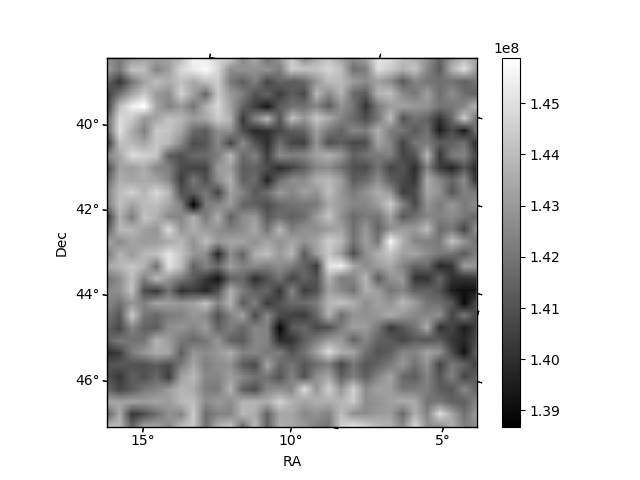
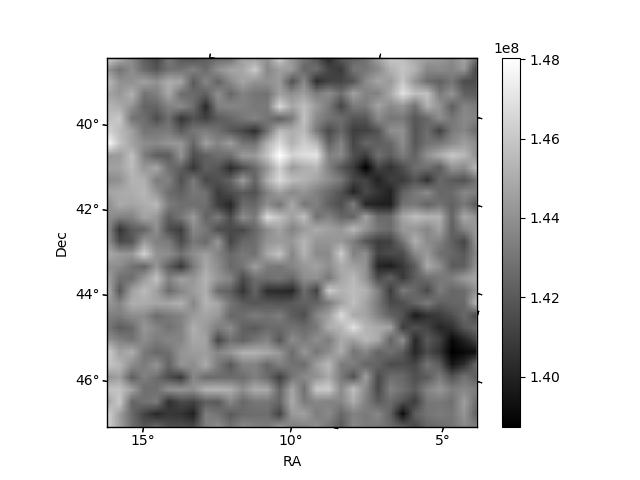
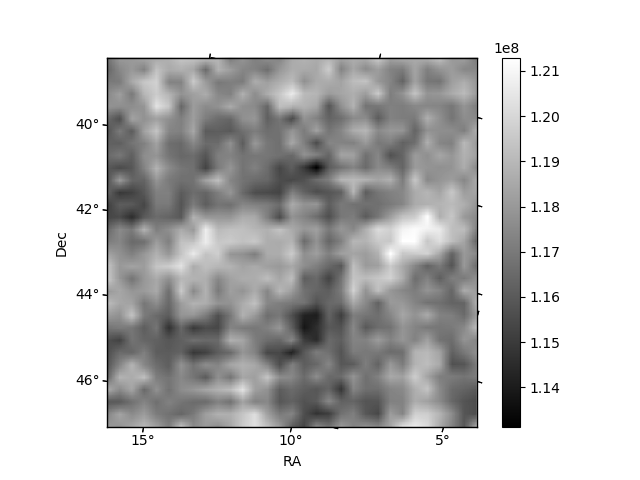
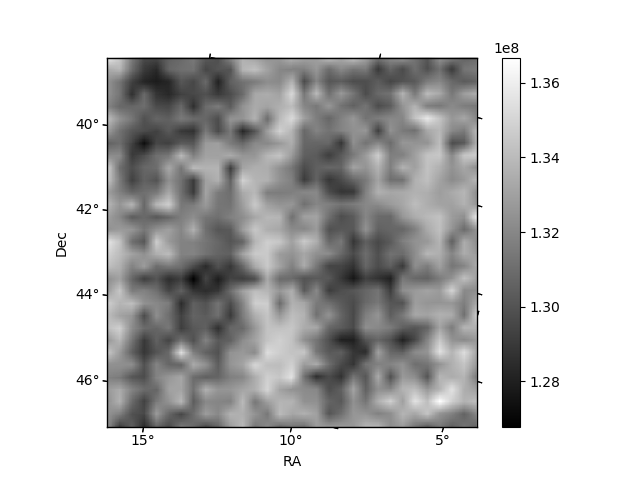
Histogram calculated using DETX and DETY for each event in the final _common_clean file
| Quadrant A | 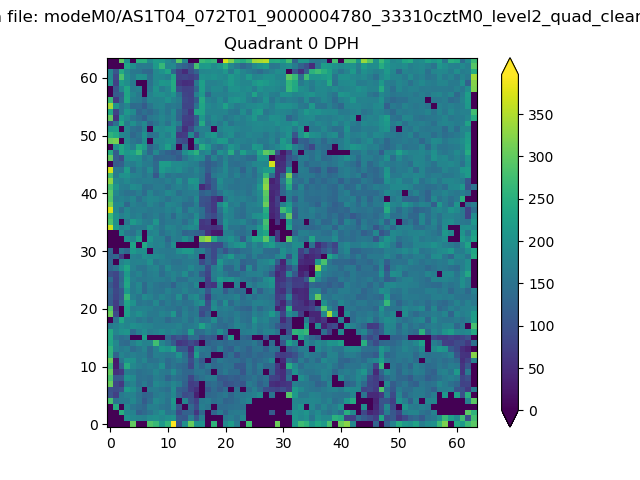 |
 |
Quadrant B |
|---|---|---|---|
| Quadrant D |  |
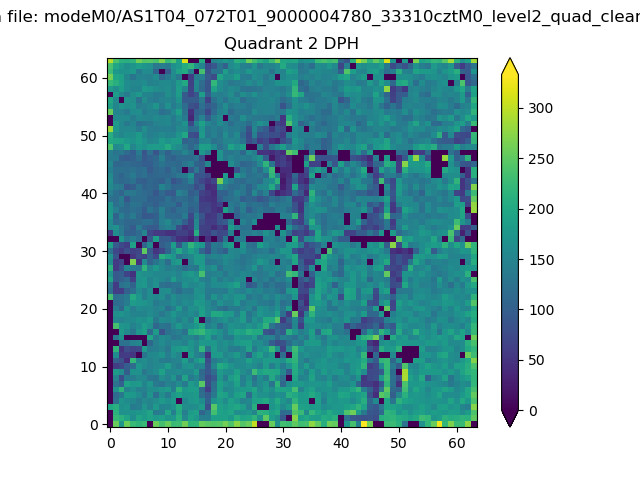 |
Quadrant C |
| Plot type | Count rate plots | Images |
|---|---|---|
| Comparison with Poisson distribution Blue bars denote a histogram of data divided into 1 sec bins. Red curve is a Poisson curve with rate = median count rate of data. |
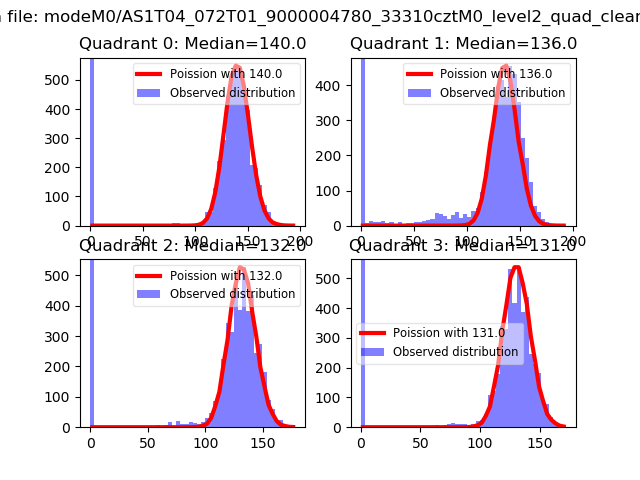 |
 |
| Quadrant-wise count rates Data is divided into 100 sec bins |
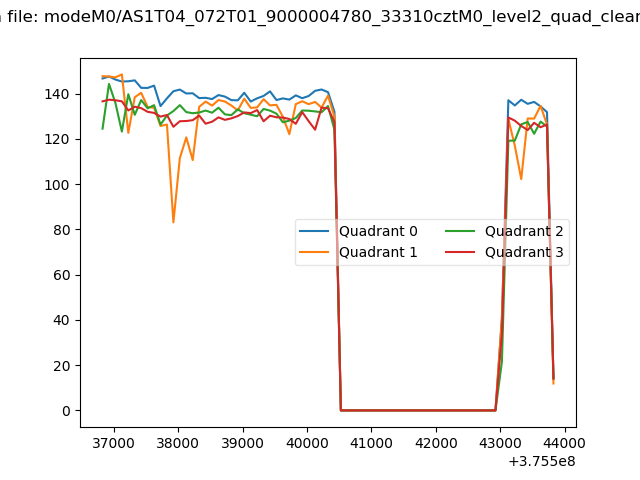 |
|
| Module-wise count rates for Quadrant A Data is divided into 100 sec bins |
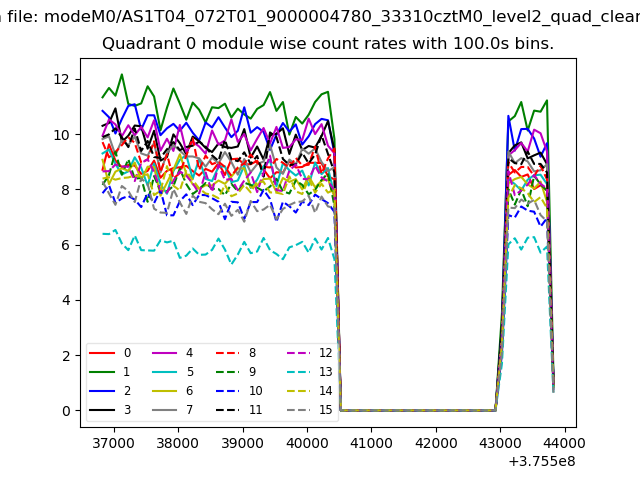 |
 |
| Module-wise count rates for Quadrant B Data is divided into 100 sec bins |
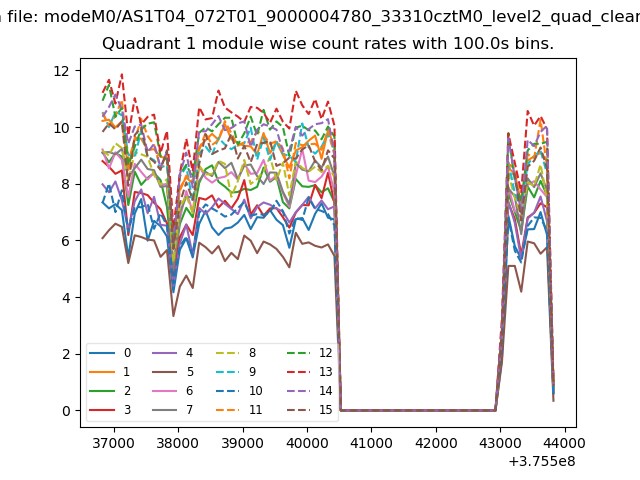 |
 |
| Module-wise count rates for Quadrant C Data is divided into 100 sec bins |
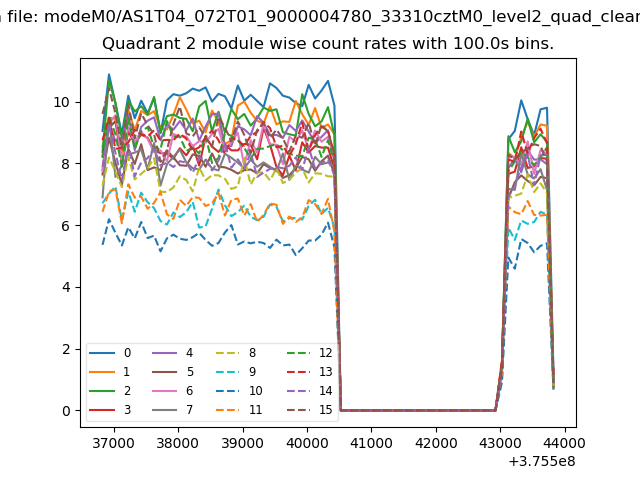 |
 |
| Module-wise count rates for Quadrant D Data is divided into 100 sec bins |
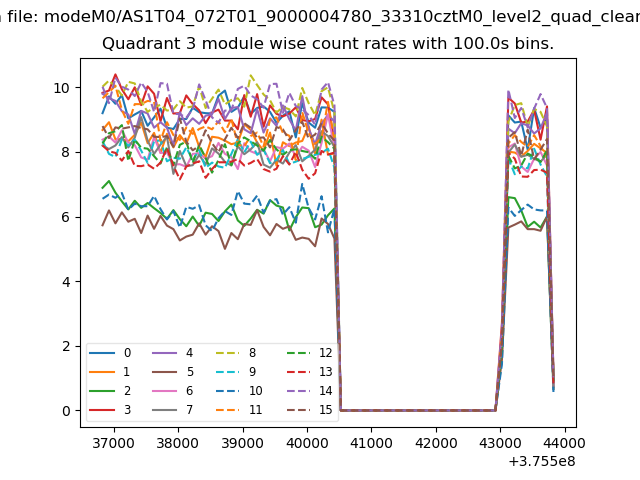 |
 |
| Parameter | Plot |
|---|---|
| CZT HV Monitor | 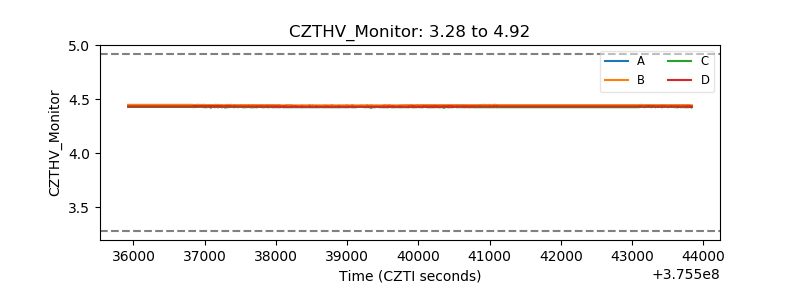 |
| D_VDD | 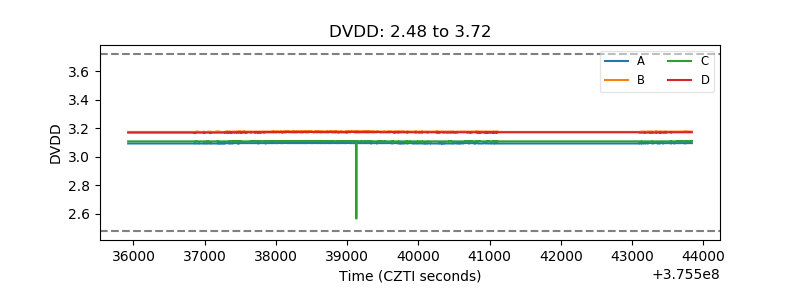 |
| Temperature 1 | 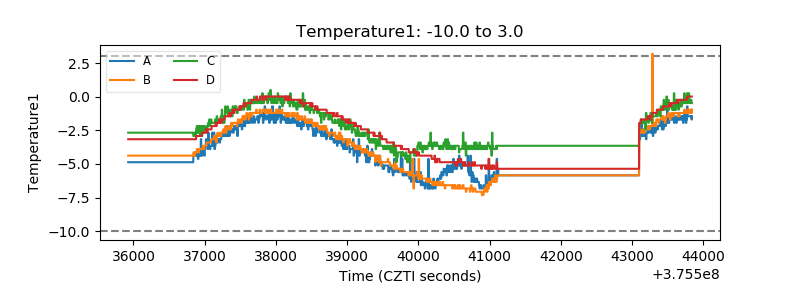 |
| Veto HV Monitor | 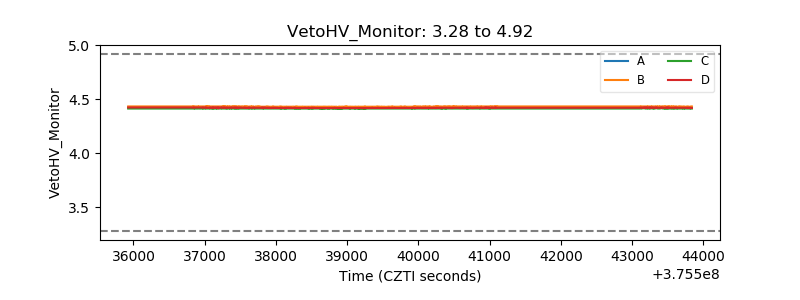 |
| Veto LLD | 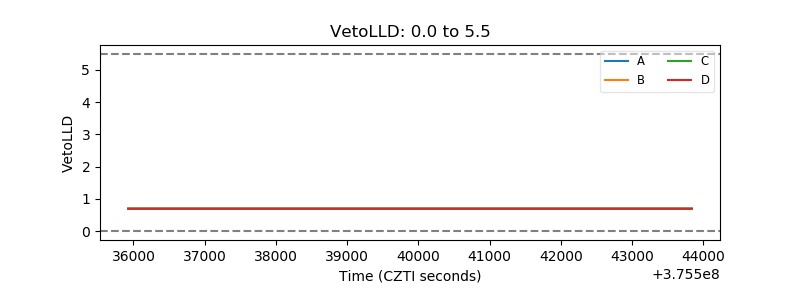 |
| Alpha Counter | 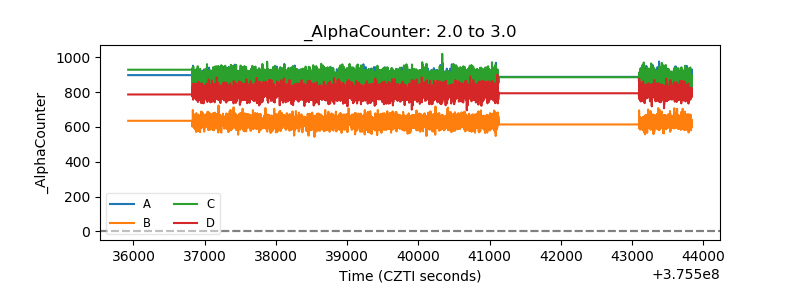 |
| _CPM_Rate | 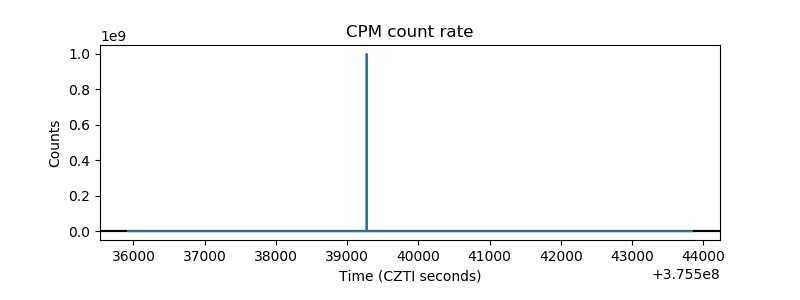 |
| CZT Counter | 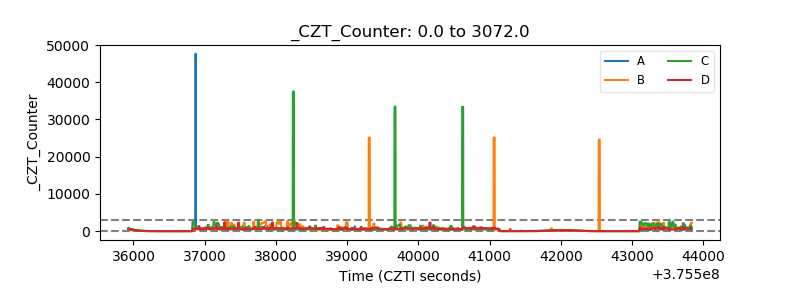 |
| +2.5 Volts monitor |  |
| +5 Volts monitor | 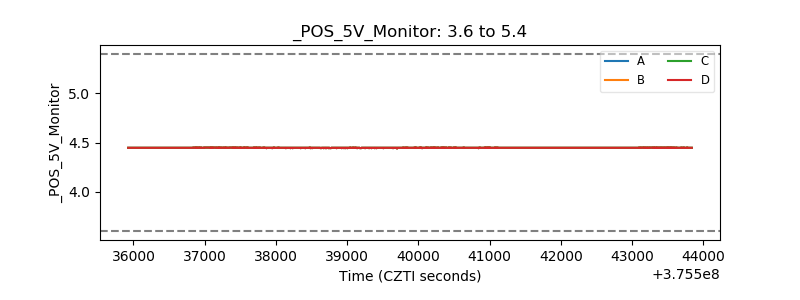 |
| _ROLL_ROT | 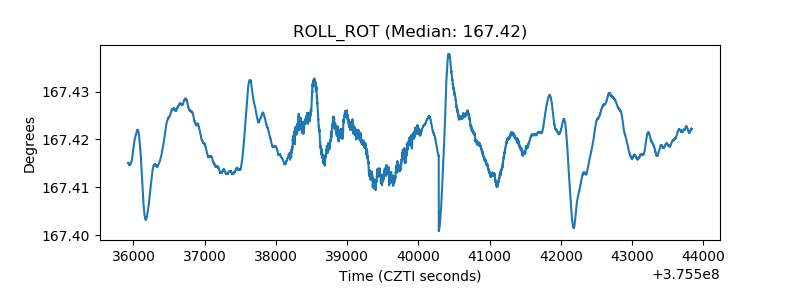 |
| _Roll_DEC | 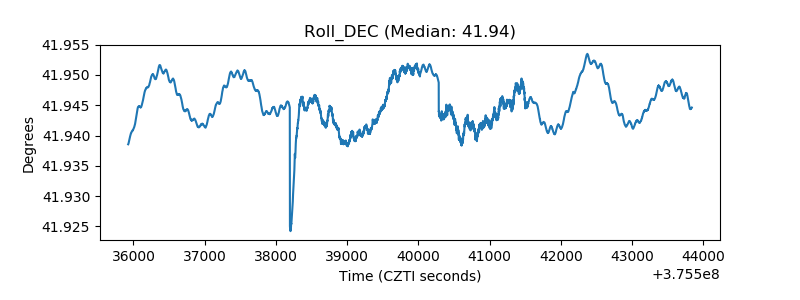 |
| _Roll_RA | 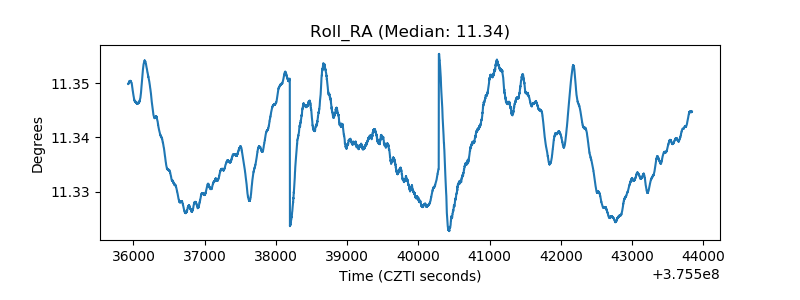 |
| Veto Counter | 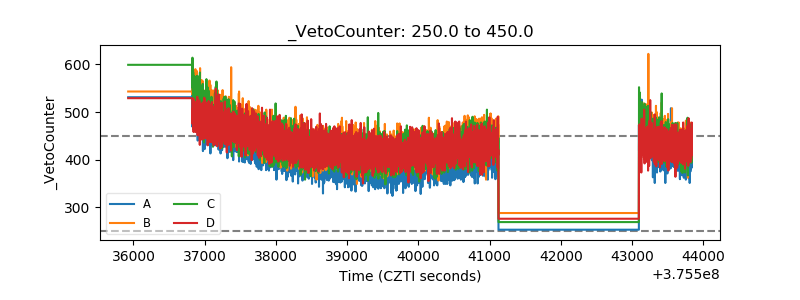 |