| Param | Original file | Final file |
|---|---|---|
| Filename | modeM0/AS1T04_072T01_9000004780_33312cztM0_level2.evt | modeM0/AS1T04_072T01_9000004780_33312cztM0_level2_quad_clean.evt |
| Size (bytes) | 621,515,520 | 74,059,200 |
| Size | 592.7 MB | 70.6 MB |
| Events in quadrant A | 2,935,904 | 494,213 |
| Events in quadrant B | 4,297,024 | 464,605 |
| Events in quadrant C | 6,838,760 | 411,294 |
| Events in quadrant D | 4,353,147 | 460,621 |
| Mode SS | |||
|---|---|---|---|
| Quadrant | BADHDUFLAG | Total packets | Discarded packets |
| A | 0 | 120 | 0 |
| B | 0 | 120 | 0 |
| C | 0 | 120 | 0 |
| D | 0 | 120 | 0 |
| Mode M0 | |||
|---|---|---|---|
| Quadrant | BADHDUFLAG | Total packets | Discarded packets |
| A | 0 | 12505 | 3 |
| B | 0 | 16501 | 2 |
| C | 0 | 24192 | 2 |
| D | 0 | 17230 | 2 |
| Mode M9 | |||
|---|---|---|---|
| Quadrant | BADHDUFLAG | Total packets | Discarded packets |
| A | 0 | 16 | 0 |
| B | 0 | 16 | 0 |
| C | 0 | 16 | 0 |
| D | 0 | 17 | 0 |
| Quadrant | Total seconds | Saturated seconds | Saturation percentage |
|---|---|---|---|
| A | 5883 | 13 | 0.220976% |
| B | 5883 | 376 | 6.391297% |
| C | 5883 | 1180 | 20.057794% |
| D | 5883 | 142 | 2.413734% |
Noise dominated data is calculated using 1-second bins in cleaned event files. If a bin has >2000 counts, and if more than 50% of those come from <1% of pixels, then it is considered to be noise-dominated and hence unusable.
| Quadrant | # 1 sec bins | Bins with >0 counts | Bins with >2000 counts | High rate bins dominated by noise | Noise dominated (total time) | Noise dominated (detector-on time) | Marked lightcurve |
|---|---|---|---|---|---|---|---|
| A | 7225 | 5884 | 5 | 5 | 0.07% | 0.08% | 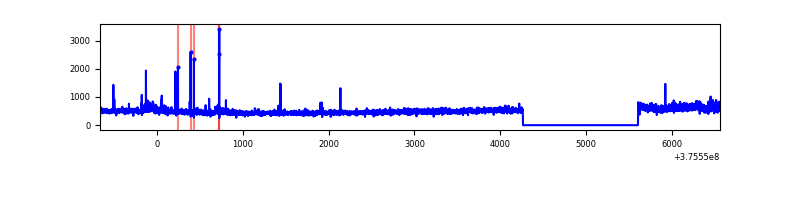 |
| B | 7225 | 5884 | 288 | 288 | 3.99% | 4.89% | 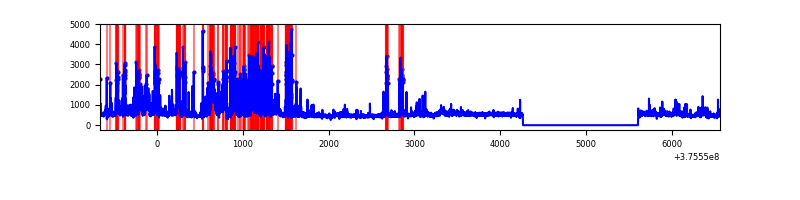 |
| C | 7225 | 5884 | 1072 | 1072 | 14.84% | 18.22% | 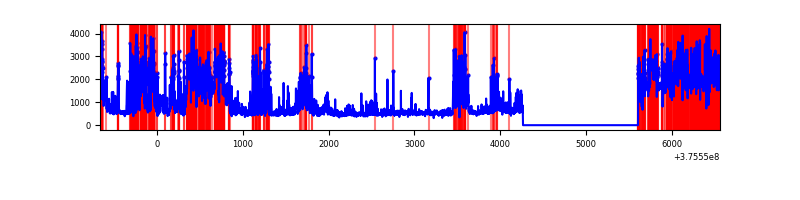 |
| D | 7225 | 5884 | 116 | 116 | 1.61% | 1.97% | 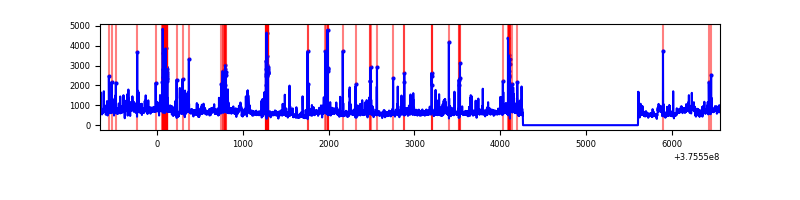 |
Top three noisy pixels from each quadrant. If the there are fewer than three noisy pixels in the level2.evt file, extra rows are filled as -1
| Pixel properties | Quadrant properties | ||||||
|---|---|---|---|---|---|---|---|
| Quadrant | DetID | PixID | Counts | Sigma | Mean | Median | Sigma |
| A | 15 | 169 | 217954 | 1563.23 | 693 | 679 | 139.0 |
| A | 15 | 47 | 26193 | 183.57 | 693 | 679 | 139.0 |
| A | 13 | 254 | 9641 | 64.48 | 693 | 679 | 139.0 |
| B | 5 | 172 | 1162946 | 9094.34 | 670 | 652 | 127.8 |
| B | 0 | 219 | 216166 | 1686.28 | 670 | 652 | 127.8 |
| B | 4 | 170 | 148041 | 1153.24 | 670 | 652 | 127.8 |
| C | 1 | 23 | 3299918 | 23018.02 | 624 | 629 | 143.3 |
| C | 10 | 49 | 432853 | 3015.48 | 624 | 629 | 143.3 |
| C | 15 | 214 | 257576 | 1792.63 | 624 | 629 | 143.3 |
| D | 8 | 195 | 994909 | 5792.8 | 665 | 648 | 171.6 |
| D | 12 | 233 | 182562 | 1059.87 | 665 | 648 | 171.6 |
| D | 13 | 249 | 148196 | 859.65 | 665 | 648 | 171.6 |
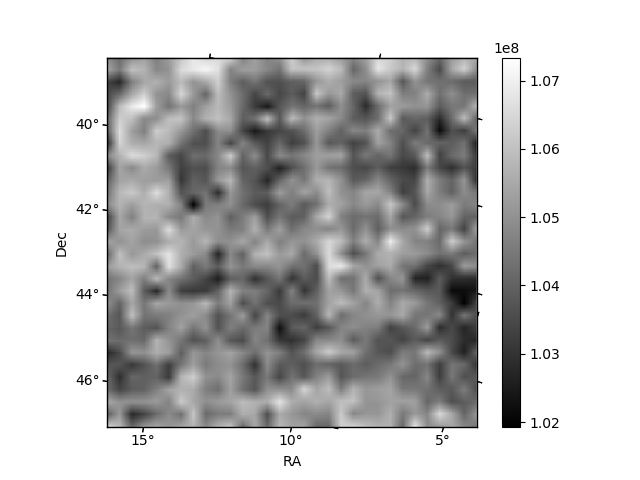
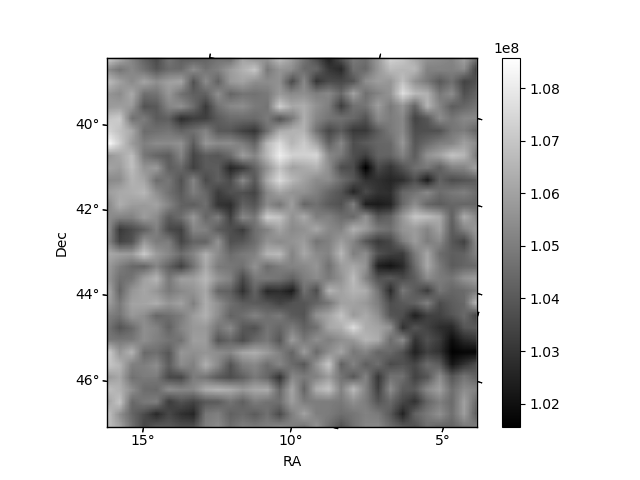
Histogram calculated using DETX and DETY for each event in the final _common_clean file
| Quadrant A | 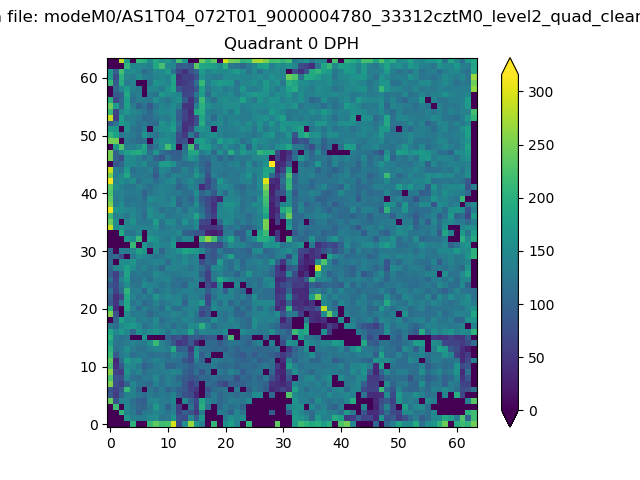 |
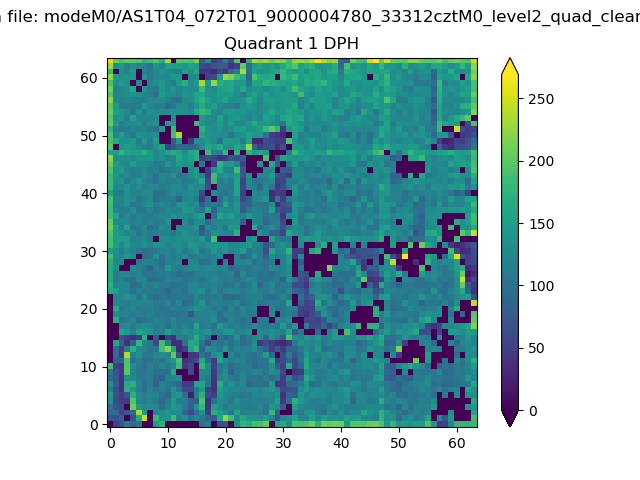 |
Quadrant B |
|---|---|---|---|
| Quadrant D | 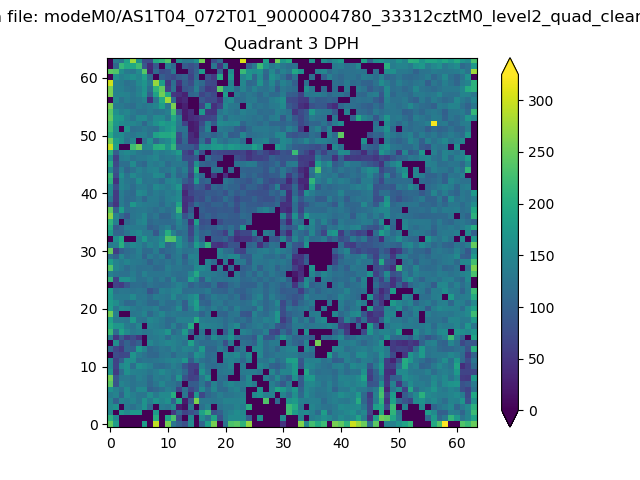 |
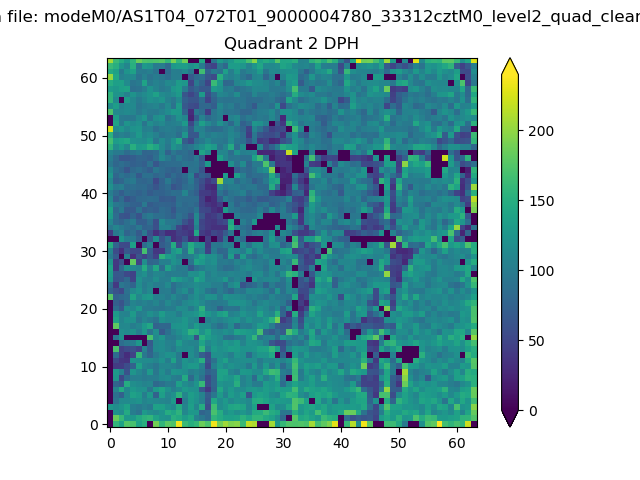 |
Quadrant C |
| Plot type | Count rate plots | Images |
|---|---|---|
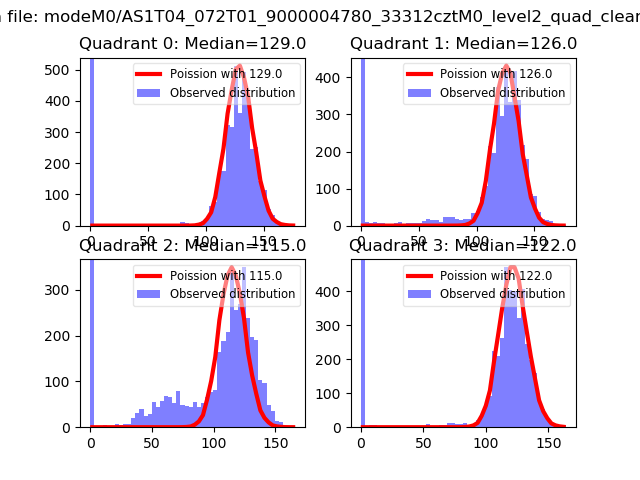
| Comparison with Poisson distribution Blue bars denote a histogram of data divided into 1 sec bins. Red curve is a Poisson curve with rate = median count rate of data. |
 |
 |
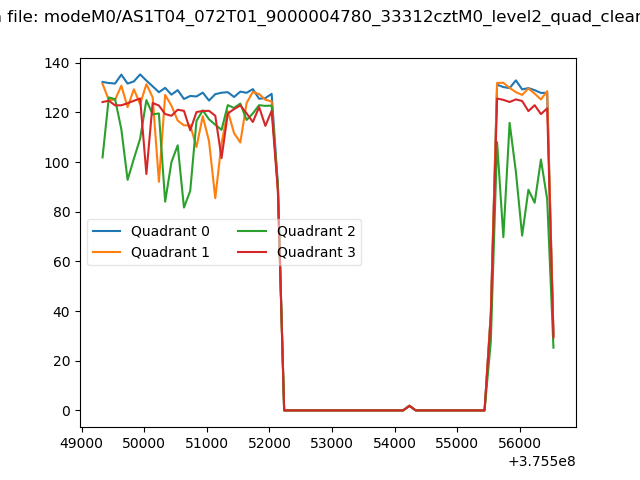
| Quadrant-wise count rates Data is divided into 100 sec bins |
 |
|
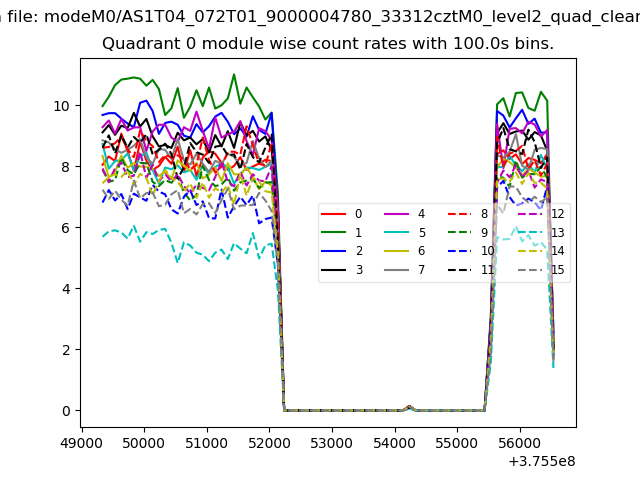
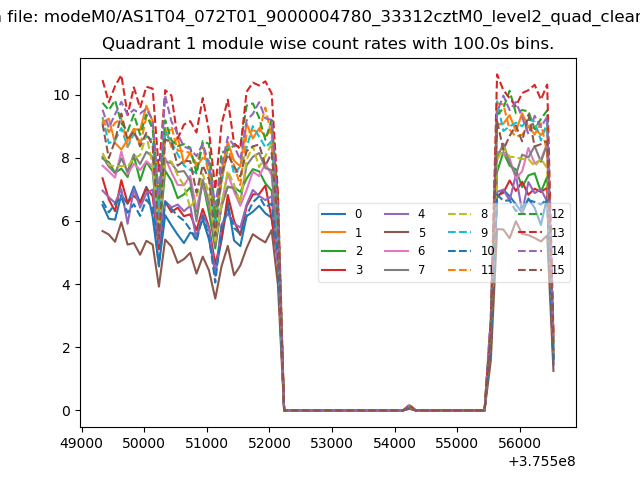
| Module-wise count rates for Quadrant A Data is divided into 100 sec bins |
 |
 |
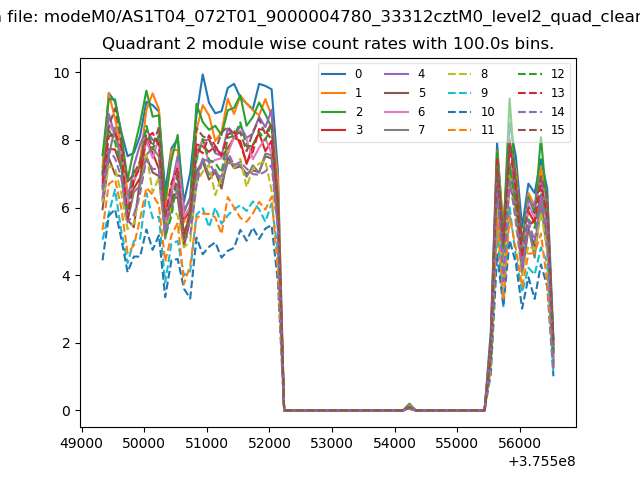
| Module-wise count rates for Quadrant B Data is divided into 100 sec bins |
 |
 |
| Module-wise count rates for Quadrant C Data is divided into 100 sec bins |
 |
 |
| Module-wise count rates for Quadrant D Data is divided into 100 sec bins |
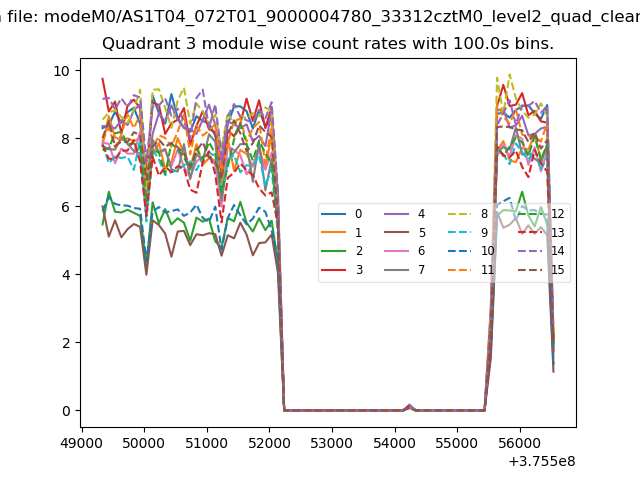 |
 |
| Parameter | Plot |
|---|---|
| CZT HV Monitor | 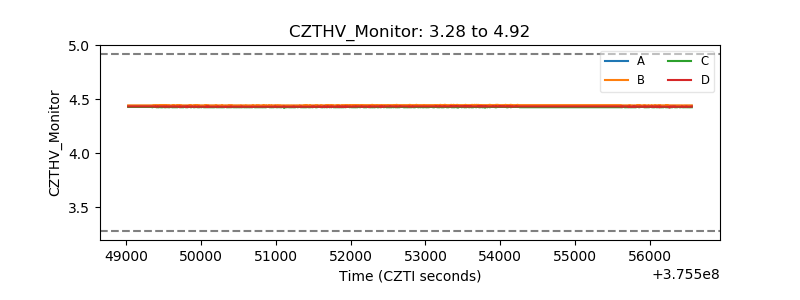 |
| D_VDD | 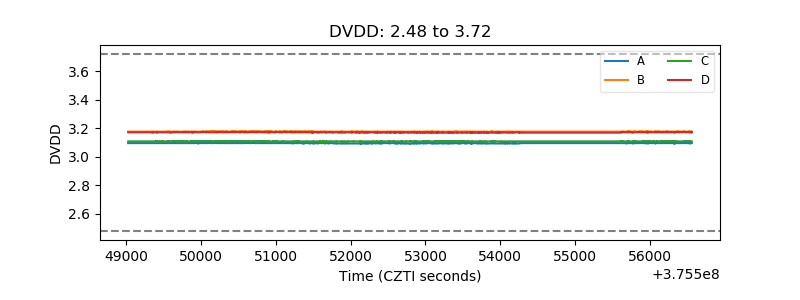 |
| Temperature 1 |  |
| Veto HV Monitor | 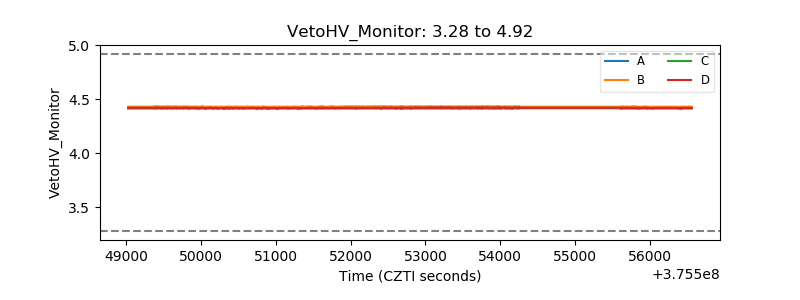 |
| Veto LLD | 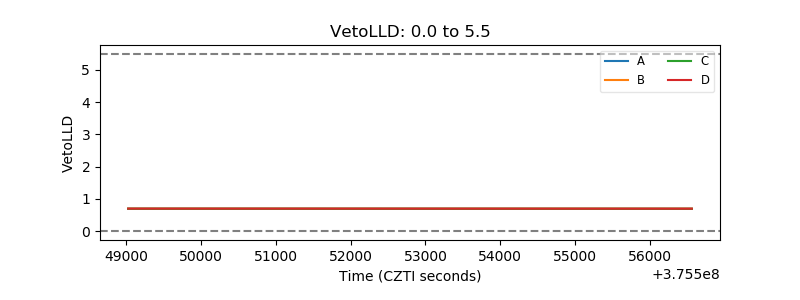 |
| Alpha Counter | 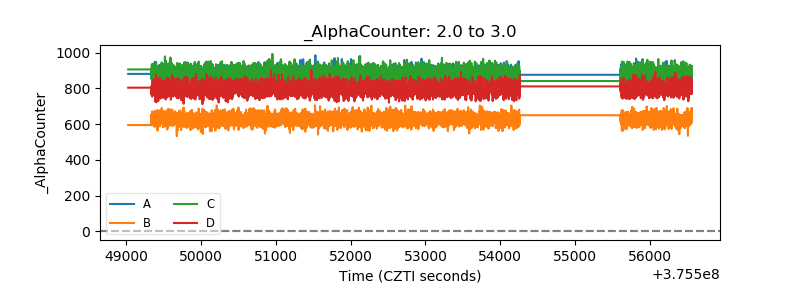 |
| _CPM_Rate | 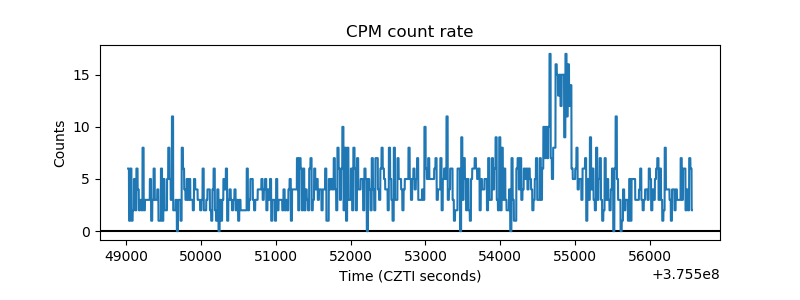 |
| CZT Counter | 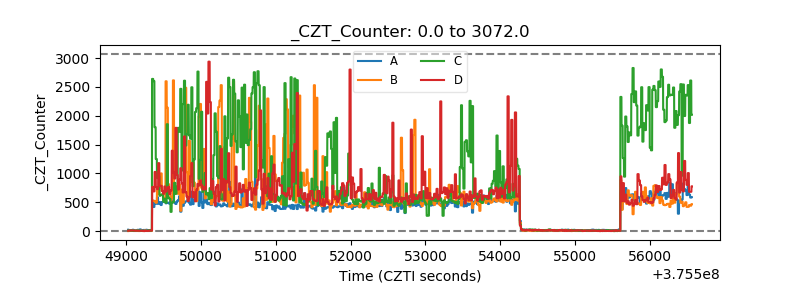 |
| +2.5 Volts monitor |  |
| +5 Volts monitor |  |
| _ROLL_ROT | 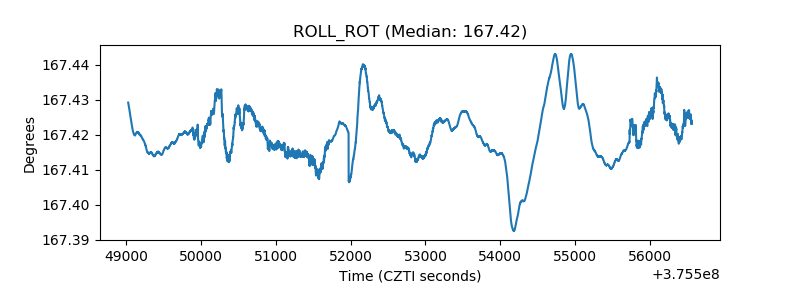 |
| _Roll_DEC | 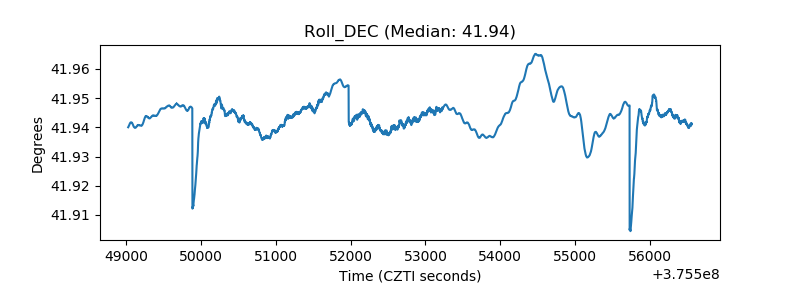 |
| _Roll_RA | 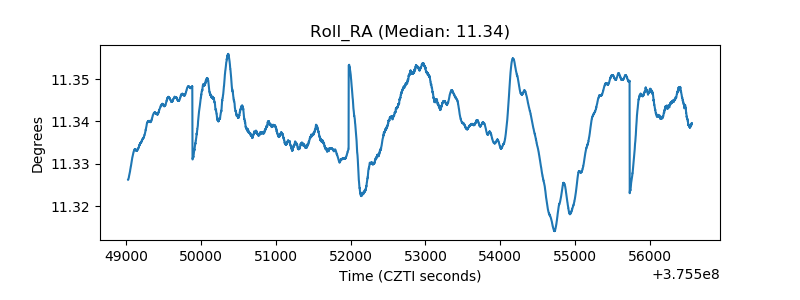 |
| Veto Counter | 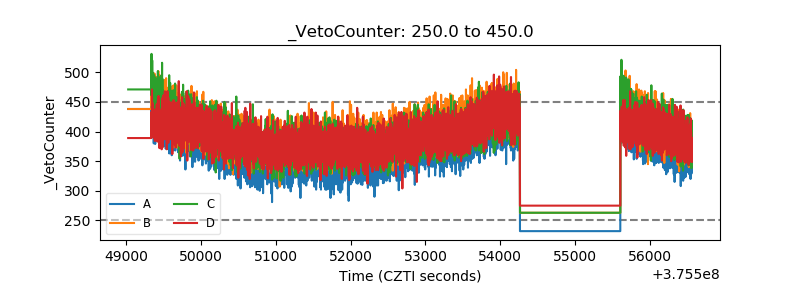 |