| Param | Original file | Final file |
|---|---|---|
| Filename | modeM0/AS1T04_072T01_9000004780_33315cztM0_level2.evt | modeM0/AS1T04_072T01_9000004780_33315cztM0_level2_quad_clean.evt |
| Size (bytes) | 442,483,200 | 59,212,800 |
| Size | 422.0 MB | 56.5 MB |
| Events in quadrant A | 3,001,802 | 369,188 |
| Events in quadrant B | 3,196,782 | 366,477 |
| Events in quadrant C | 3,217,589 | 358,373 |
| Events in quadrant D | 3,648,065 | 350,695 |
| Mode SS | |||
|---|---|---|---|
| Quadrant | BADHDUFLAG | Total packets | Discarded packets |
| A | 0 | 102 | 0 |
| B | 0 | 102 | 0 |
| C | 0 | 102 | 0 |
| D | 0 | 102 | 0 |
| Mode M0 | |||
|---|---|---|---|
| Quadrant | BADHDUFLAG | Total packets | Discarded packets |
| A | 0 | 12225 | 1 |
| B | 0 | 12780 | 1 |
| C | 0 | 12616 | 1 |
| D | 0 | 14569 | 1 |
| Mode M9 | |||
|---|---|---|---|
| Quadrant | BADHDUFLAG | Total packets | Discarded packets |
| A | 0 | 22 | 0 |
| B | 0 | 22 | 0 |
| C | 0 | 22 | 0 |
| D | 0 | 23 | 0 |
| Quadrant | Total seconds | Saturated seconds | Saturation percentage |
|---|---|---|---|
| A | 4957 | 108 | 2.178737% |
| B | 4957 | 186 | 3.752270% |
| C | 4957 | 90 | 1.815614% |
| D | 4957 | 60 | 1.210410% |
Noise dominated data is calculated using 1-second bins in cleaned event files. If a bin has >2000 counts, and if more than 50% of those come from <1% of pixels, then it is considered to be noise-dominated and hence unusable.
| Quadrant | # 1 sec bins | Bins with >0 counts | Bins with >2000 counts | High rate bins dominated by noise | Noise dominated (total time) | Noise dominated (detector-on time) | Marked lightcurve |
|---|---|---|---|---|---|---|---|
| A | 4957 | 4957 | 24 | 24 | 0.48% | 0.48% | 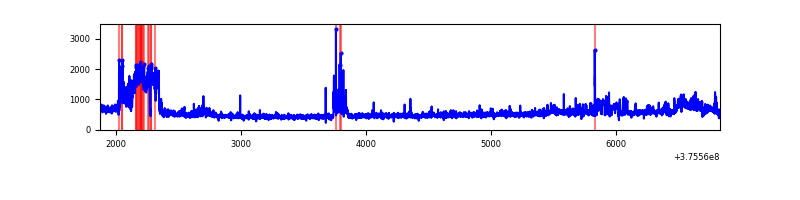 |
| B | 4957 | 4957 | 106 | 106 | 2.14% | 2.14% | 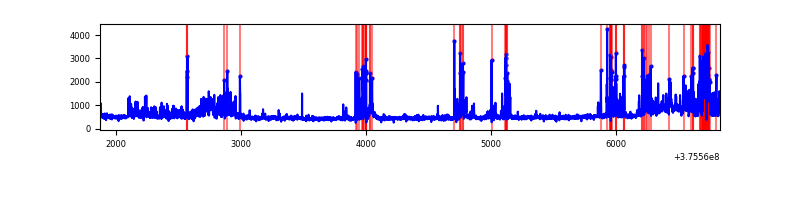 |
| C | 4957 | 4957 | 81 | 81 | 1.63% | 1.63% | 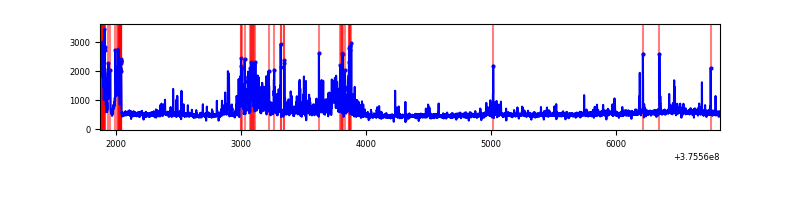 |
| D | 4957 | 4957 | 41 | 41 | 0.83% | 0.83% | 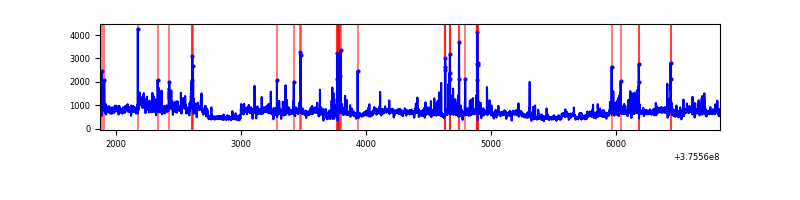 |
Top three noisy pixels from each quadrant. If the there are fewer than three noisy pixels in the level2.evt file, extra rows are filled as -1
| Pixel properties | Quadrant properties | ||||||
|---|---|---|---|---|---|---|---|
| Quadrant | DetID | PixID | Counts | Sigma | Mean | Median | Sigma |
| A | 15 | 169 | 728949 | 6182.81 | 579 | 566 | 117.8 |
| A | 15 | 47 | 25322 | 210.13 | 579 | 566 | 117.8 |
| A | 13 | 254 | 6954 | 54.22 | 579 | 566 | 117.8 |
| B | 5 | 172 | 525337 | 4778.57 | 570 | 556 | 109.8 |
| B | 0 | 219 | 317914 | 2889.81 | 570 | 556 | 109.8 |
| B | 5 | 173 | 43988 | 395.48 | 570 | 556 | 109.8 |
| C | 10 | 49 | 441701 | 3387.48 | 560 | 564 | 130.2 |
| C | 15 | 214 | 224939 | 1722.97 | 560 | 564 | 130.2 |
| C | 1 | 23 | 179926 | 1377.32 | 560 | 564 | 130.2 |
| D | 8 | 195 | 1082296 | 7403.0 | 559 | 545 | 146.1 |
| D | 13 | 249 | 132063 | 900.05 | 559 | 545 | 146.1 |
| D | 12 | 233 | 83676 | 568.91 | 559 | 545 | 146.1 |
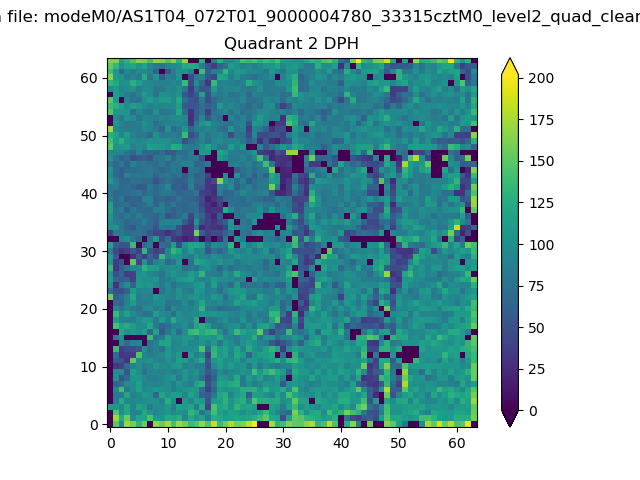
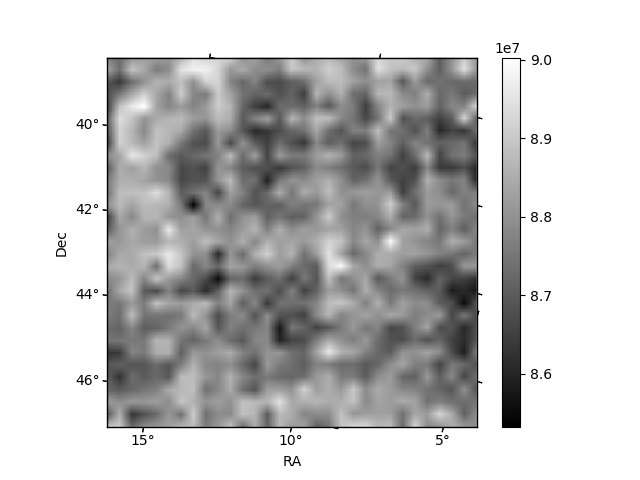
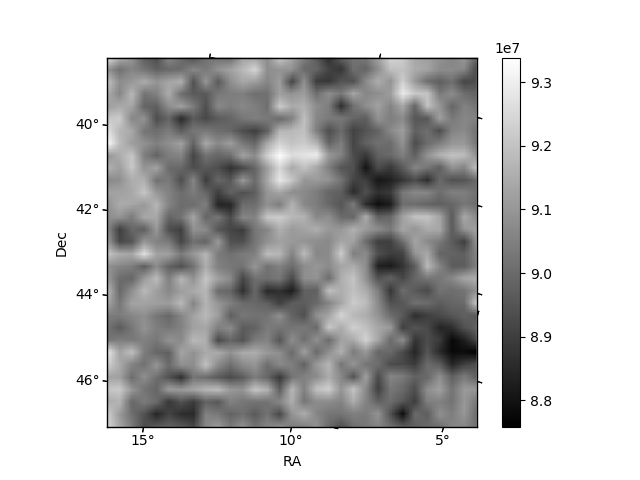
Histogram calculated using DETX and DETY for each event in the final _common_clean file
| Quadrant A | 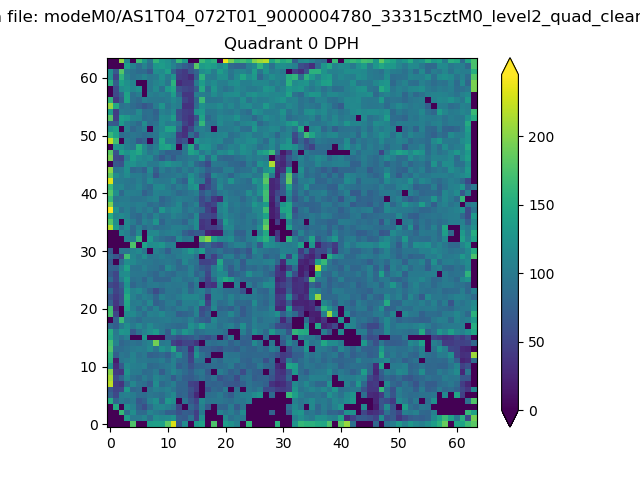 |
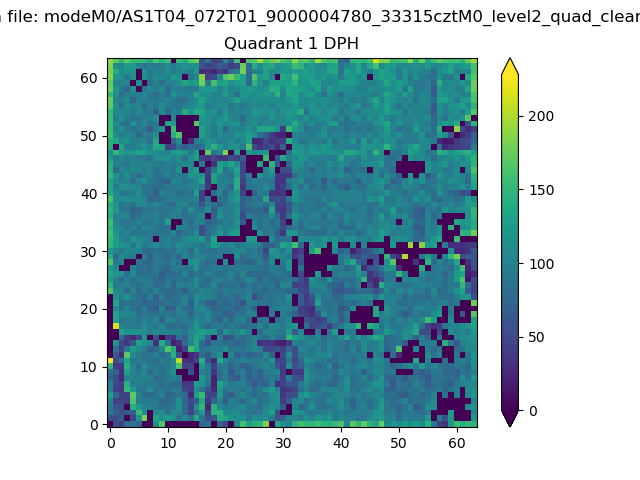 |
Quadrant B |
|---|---|---|---|
| Quadrant D | 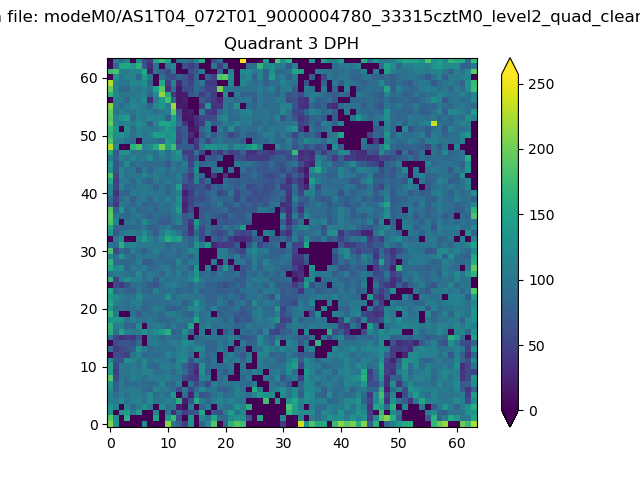 |
 |
Quadrant C |
| Plot type | Count rate plots | Images |
|---|---|---|
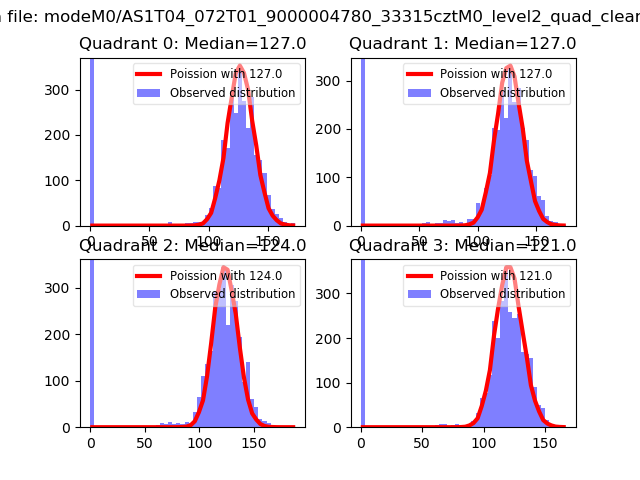
| Comparison with Poisson distribution Blue bars denote a histogram of data divided into 1 sec bins. Red curve is a Poisson curve with rate = median count rate of data. |
 |
 |
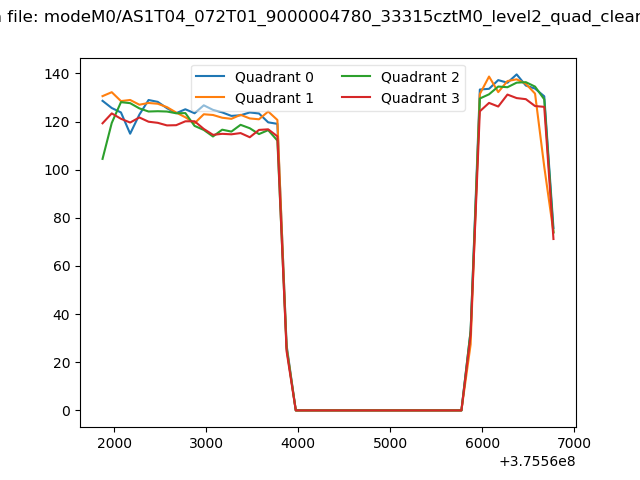
| Quadrant-wise count rates Data is divided into 100 sec bins |
 |
|
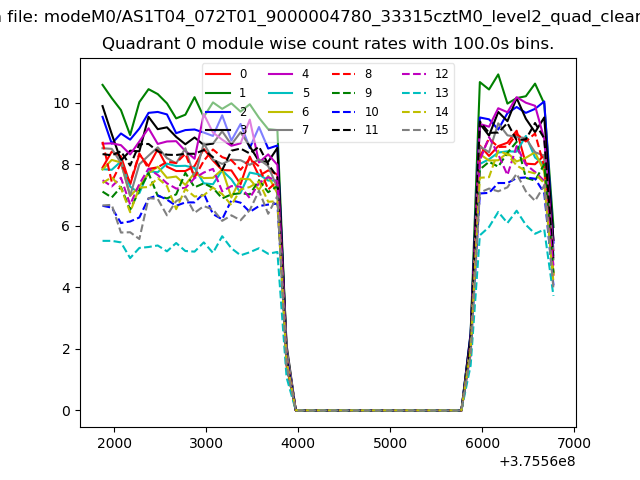
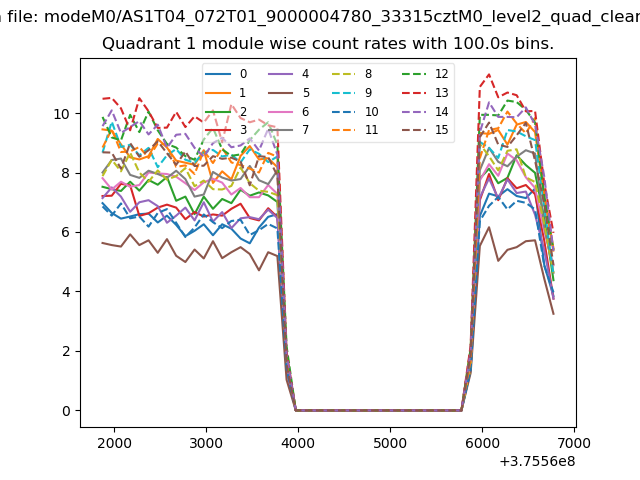
| Module-wise count rates for Quadrant A Data is divided into 100 sec bins |
 |
 |
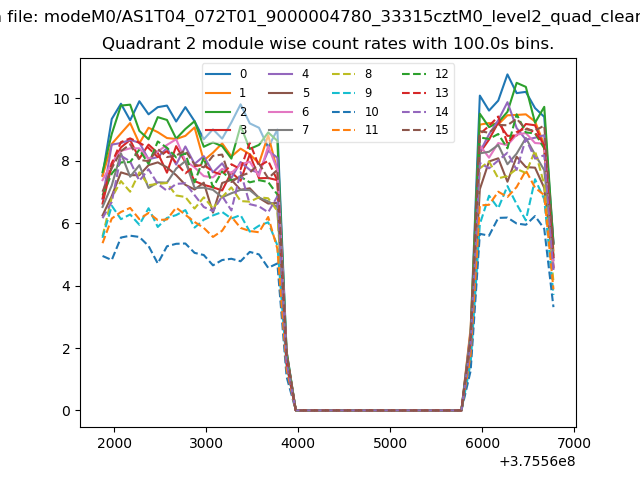
| Module-wise count rates for Quadrant B Data is divided into 100 sec bins |
 |
 |
| Module-wise count rates for Quadrant C Data is divided into 100 sec bins |
 |
 |
| Module-wise count rates for Quadrant D Data is divided into 100 sec bins |
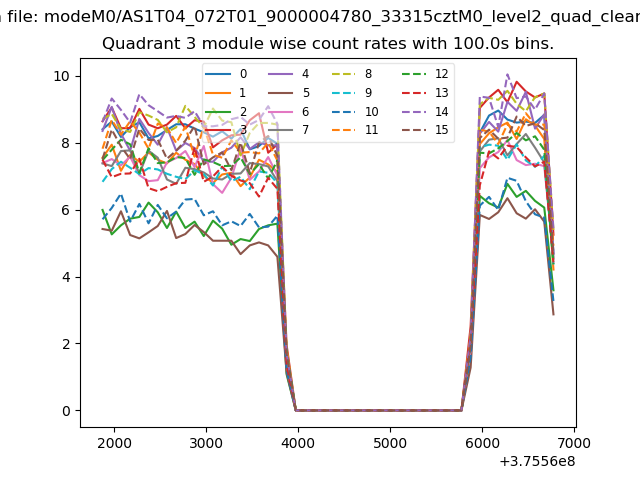 |
 |
| Parameter | Plot |
|---|---|
| CZT HV Monitor | 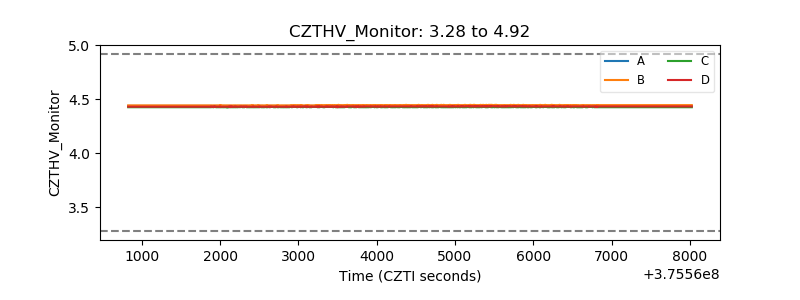 |
| D_VDD | 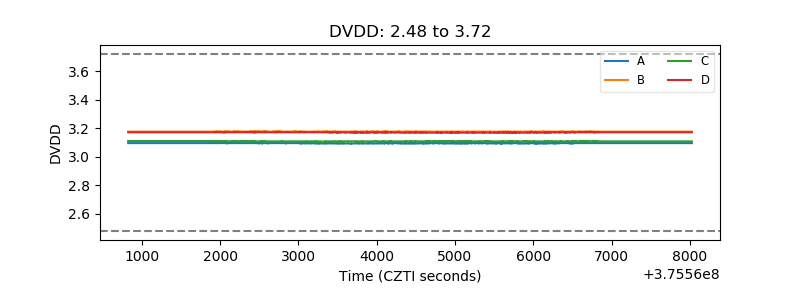 |
| Temperature 1 | 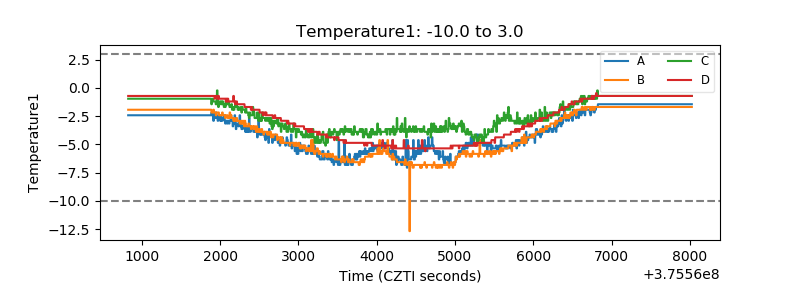 |
| Veto HV Monitor | 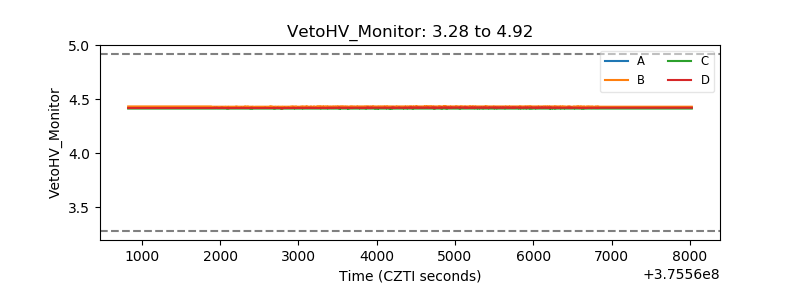 |
| Veto LLD | 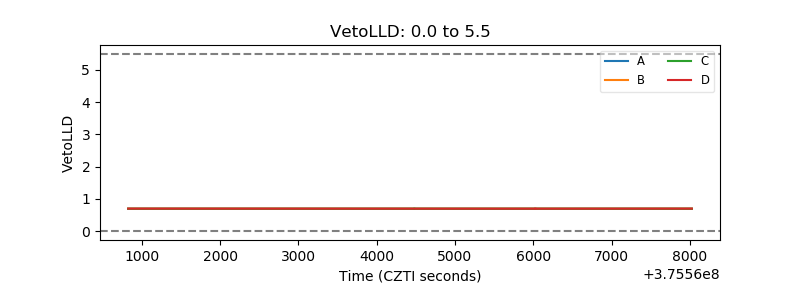 |
| Alpha Counter | 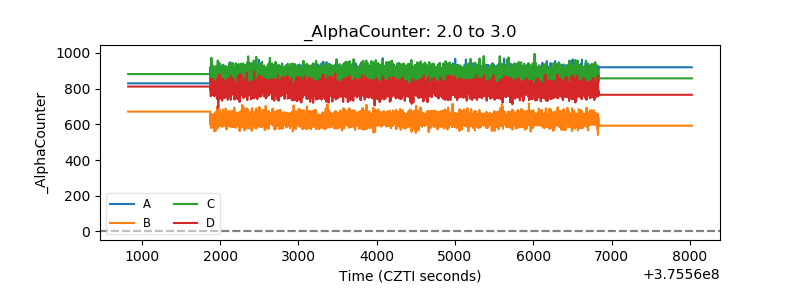 |
| _CPM_Rate | 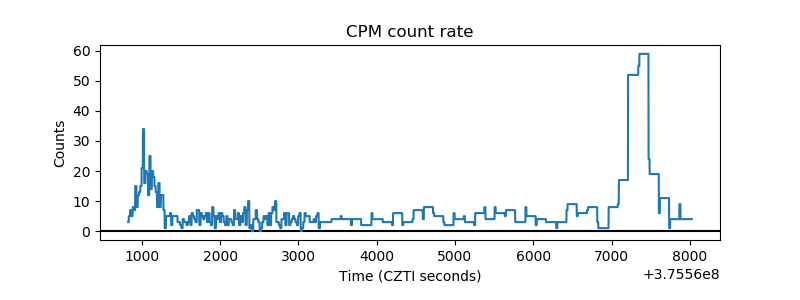 |
| CZT Counter | 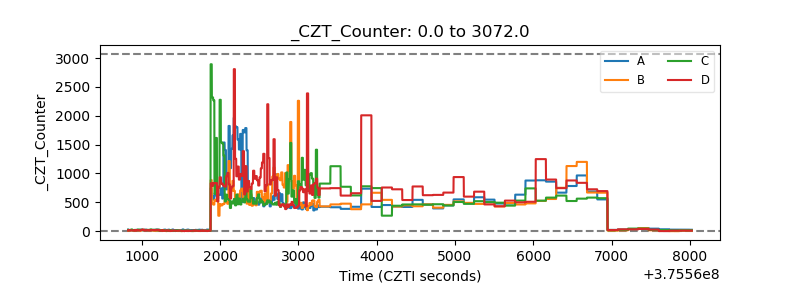 |
| +2.5 Volts monitor |  |
| +5 Volts monitor |  |
| _ROLL_ROT | 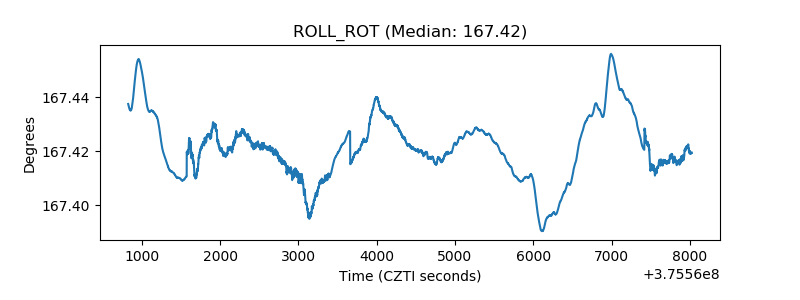 |
| _Roll_DEC | 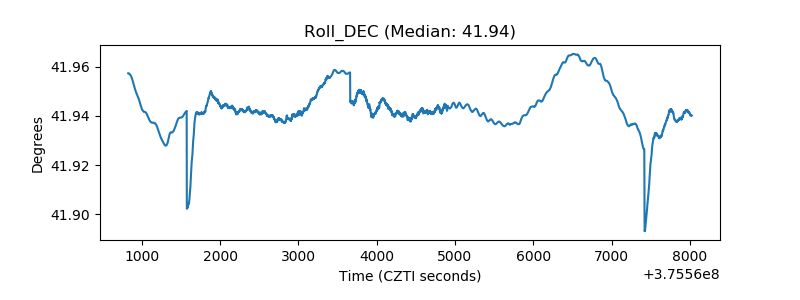 |
| _Roll_RA | 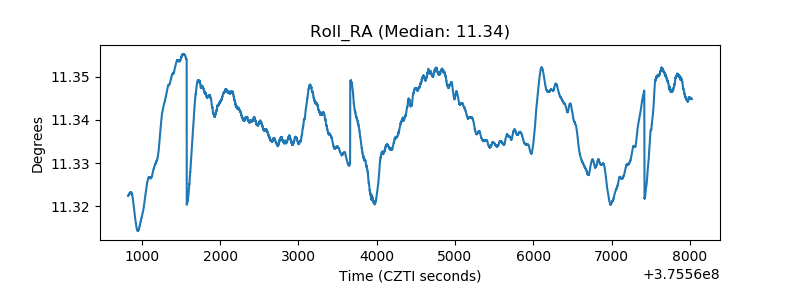 |
| Veto Counter | 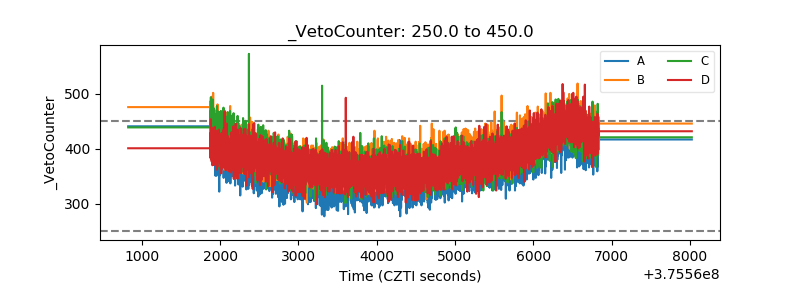 |