| Param | Original file | Final file |
|---|---|---|
| Filename | modeM0/AS1T04_072T01_9000004780_33457cztM0_level2.evt | modeM0/AS1T04_072T01_9000004780_33457cztM0_level2_quad_clean.evt |
| Size (bytes) | 531,077,760 | 61,565,760 |
| Size | 506.5 MB | 58.7 MB |
| Events in quadrant A | 2,731,600 | 375,946 |
| Events in quadrant B | 4,124,473 | 364,441 |
| Events in quadrant C | 3,180,998 | 363,455 |
| Events in quadrant D | 5,644,249 | 345,018 |
| Mode SS | |||
|---|---|---|---|
| Quadrant | BADHDUFLAG | Total packets | Discarded packets |
| A | 0 | 120 | 0 |
| B | 0 | 120 | 0 |
| C | 0 | 120 | 0 |
| D | 0 | 120 | 0 |
| Mode M0 | |||
|---|---|---|---|
| Quadrant | BADHDUFLAG | Total packets | Discarded packets |
| A | 0 | 11924 | 2 |
| B | 0 | 15983 | 1 |
| C | 0 | 12781 | 1 |
| D | 0 | 20863 | 1 |
| Mode M9 | |||
|---|---|---|---|
| Quadrant | BADHDUFLAG | Total packets | Discarded packets |
| A | 0 | 15 | 0 |
| B | 0 | 15 | 0 |
| C | 0 | 15 | 0 |
| D | 0 | 16 | 0 |
| Quadrant | Total seconds | Saturated seconds | Saturation percentage |
|---|---|---|---|
| A | 5943 | 7 | 0.117786% |
| B | 5943 | 326 | 5.485445% |
| C | 5943 | 57 | 0.959112% |
| D | 5943 | 360 | 6.057547% |
Noise dominated data is calculated using 1-second bins in cleaned event files. If a bin has >2000 counts, and if more than 50% of those come from <1% of pixels, then it is considered to be noise-dominated and hence unusable.
| Quadrant | # 1 sec bins | Bins with >0 counts | Bins with >2000 counts | High rate bins dominated by noise | Noise dominated (total time) | Noise dominated (detector-on time) | Marked lightcurve |
|---|---|---|---|---|---|---|---|
| A | 7284 | 5944 | 0 | 0 | 0.00% | 0.00% | 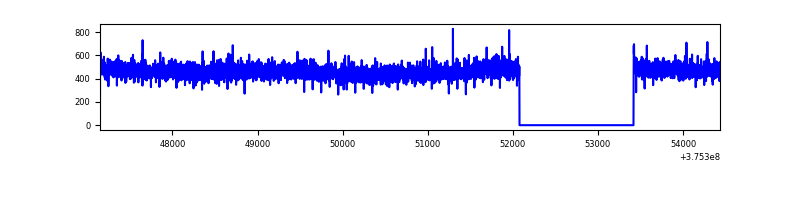 |
| B | 7284 | 5944 | 237 | 237 | 3.25% | 3.99% | 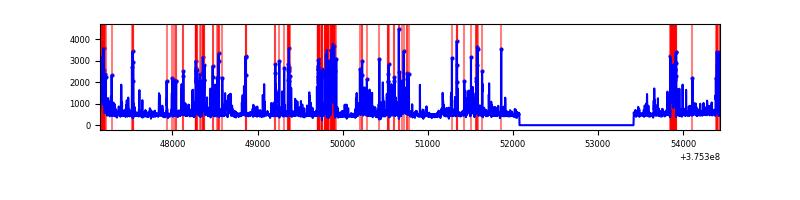 |
| C | 7284 | 5944 | 40 | 40 | 0.55% | 0.67% | 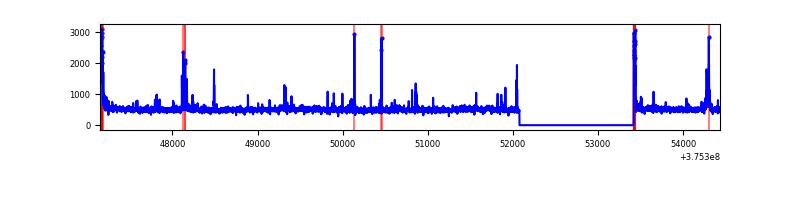 |
| D | 7284 | 5944 | 283 | 283 | 3.89% | 4.76% | 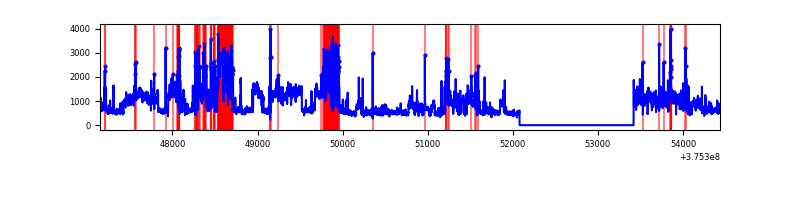 |
Top three noisy pixels from each quadrant. If the there are fewer than three noisy pixels in the level2.evt file, extra rows are filled as -1
| Pixel properties | Quadrant properties | ||||||
|---|---|---|---|---|---|---|---|
| Quadrant | DetID | PixID | Counts | Sigma | Mean | Median | Sigma |
| A | 13 | 6 | 14767 | 99.41 | 701 | 686 | 141.7 |
| A | 13 | 254 | 11408 | 75.69 | 701 | 686 | 141.7 |
| A | 3 | 137 | 6927 | 44.06 | 701 | 686 | 141.7 |
| B | 5 | 172 | 763679 | 5825.17 | 680 | 663 | 131.0 |
| B | 5 | 255 | 381973 | 2911.08 | 680 | 663 | 131.0 |
| B | 15 | 85 | 61333 | 463.18 | 680 | 663 | 131.0 |
| C | 15 | 214 | 257195 | 1635.01 | 672 | 675 | 156.9 |
| C | 0 | 10 | 122121 | 774.08 | 672 | 675 | 156.9 |
| C | 1 | 23 | 44189 | 277.35 | 672 | 675 | 156.9 |
| D | 8 | 195 | 1940105 | 11207.02 | 658 | 643 | 173.1 |
| D | 10 | 118 | 387171 | 2233.52 | 658 | 643 | 173.1 |
| D | 12 | 233 | 360354 | 2078.56 | 658 | 643 | 173.1 |
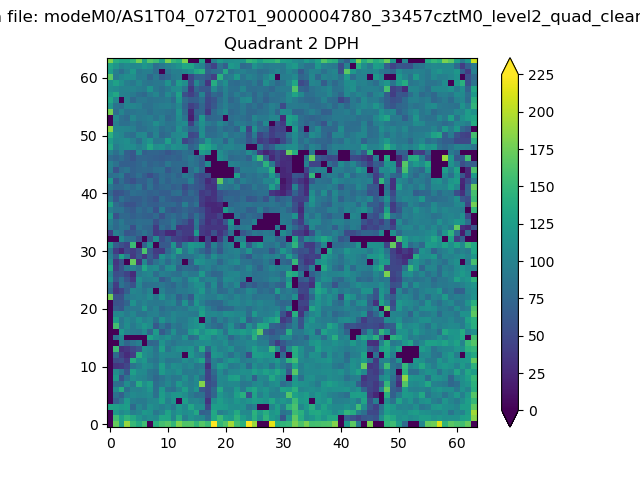
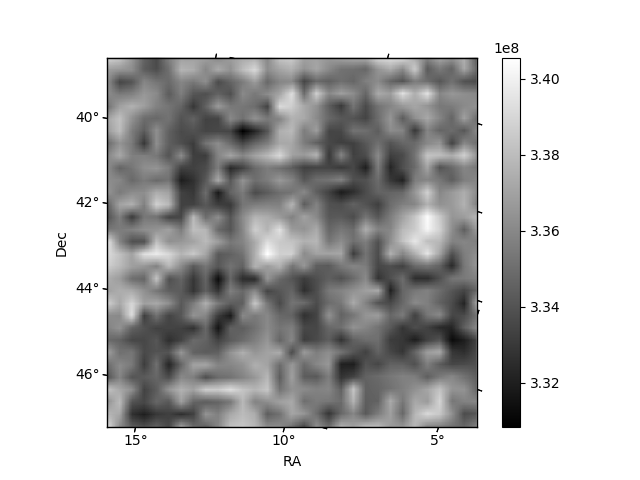
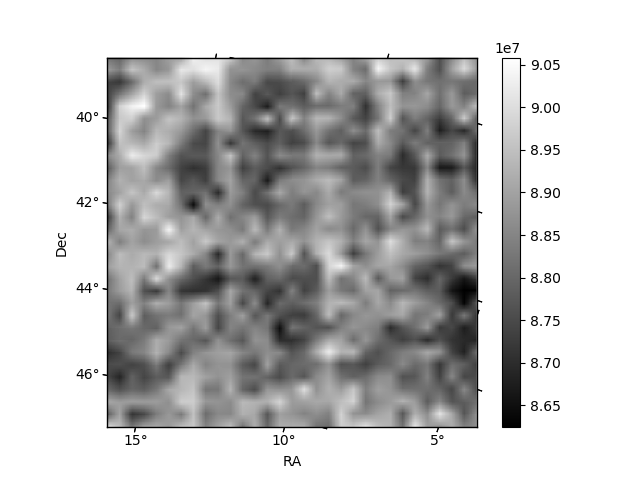
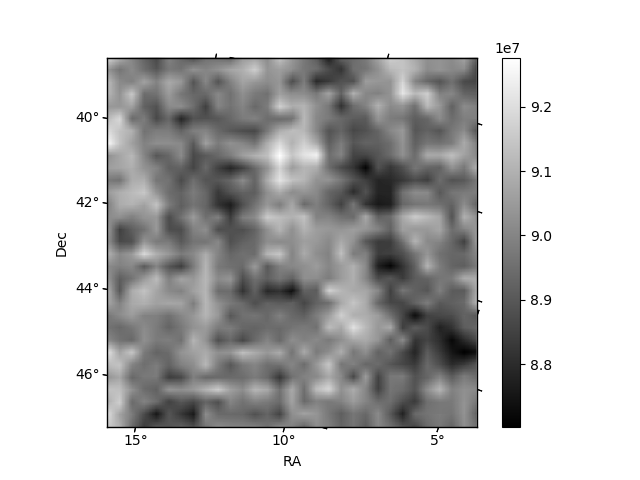
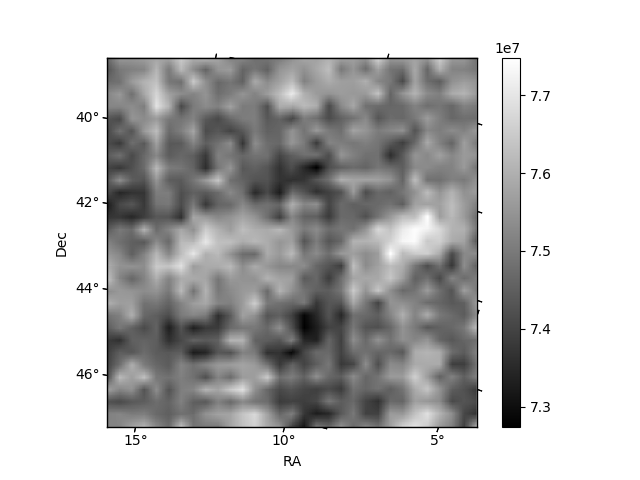
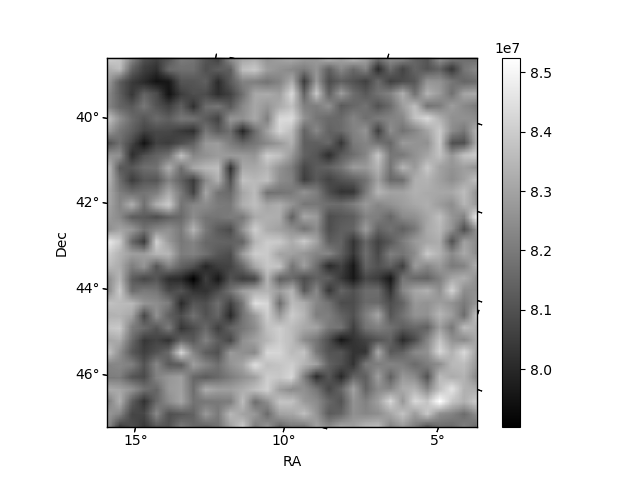
Histogram calculated using DETX and DETY for each event in the final _common_clean file
| Quadrant A | 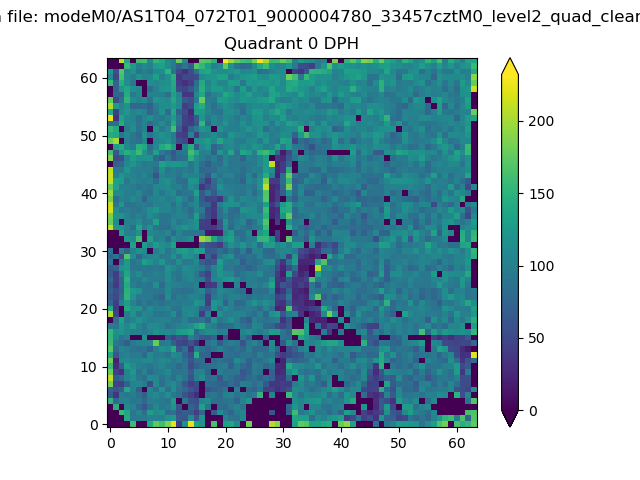 |
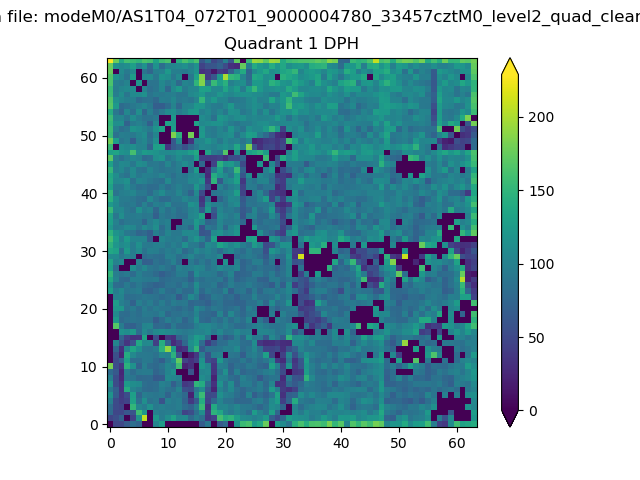 |
Quadrant B |
|---|---|---|---|
| Quadrant D | 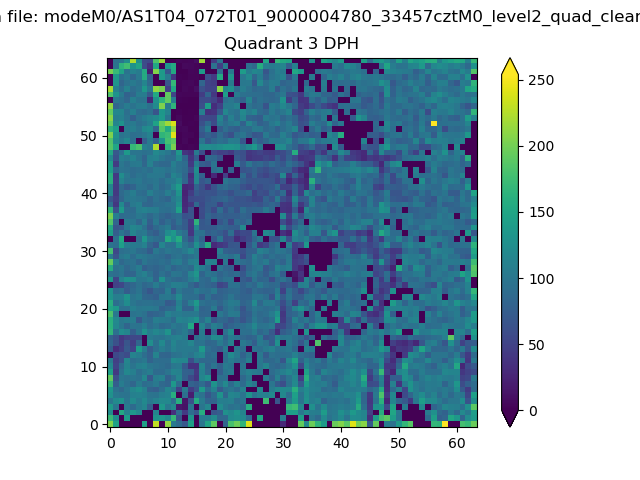 |
 |
Quadrant C |
| Plot type | Count rate plots | Images |
|---|---|---|
| Comparison with Poisson distribution Blue bars denote a histogram of data divided into 1 sec bins. Red curve is a Poisson curve with rate = median count rate of data. |
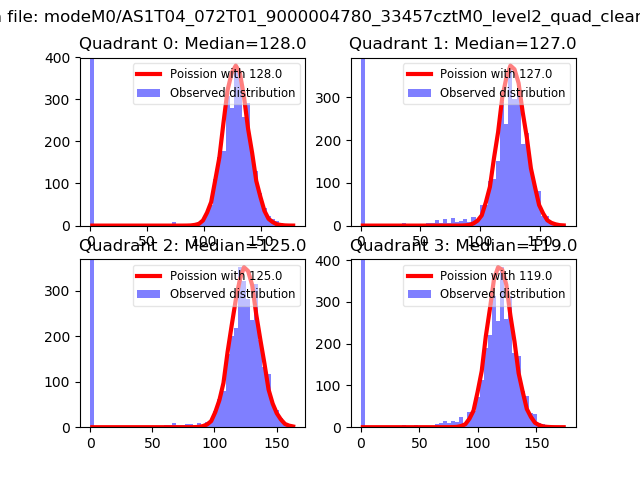 |
 |
| Quadrant-wise count rates Data is divided into 100 sec bins |
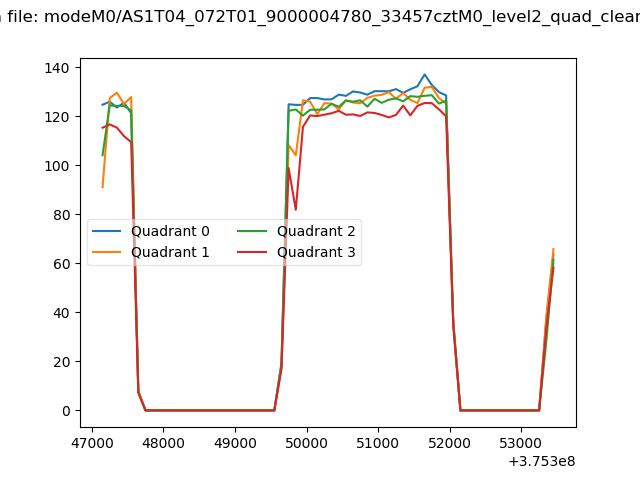 |
|
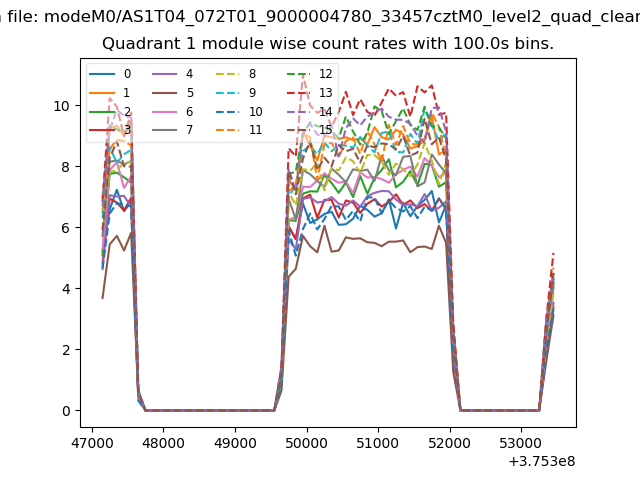
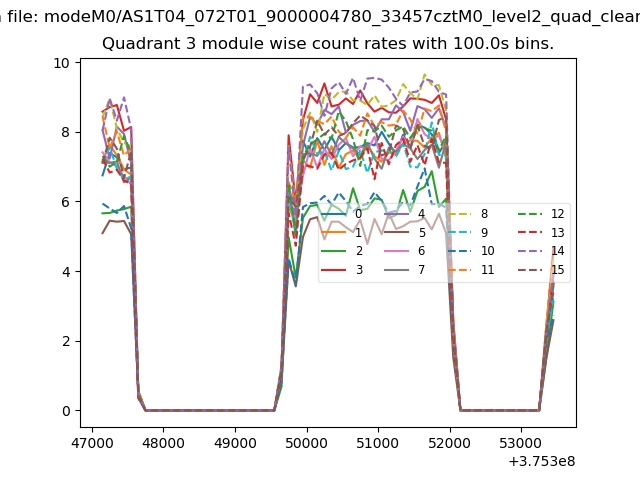
| Module-wise count rates for Quadrant A Data is divided into 100 sec bins |
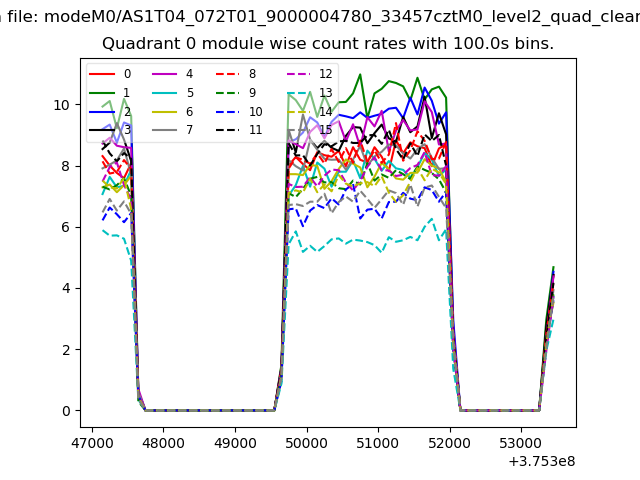 |
 |
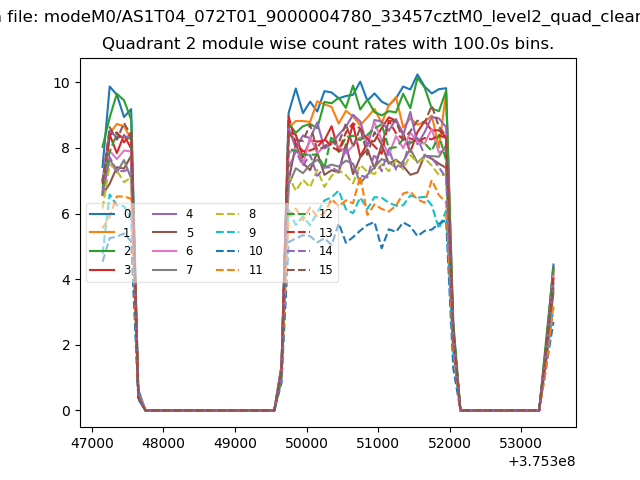
| Module-wise count rates for Quadrant B Data is divided into 100 sec bins |
 |
 |
| Module-wise count rates for Quadrant C Data is divided into 100 sec bins |
 |
 |
| Module-wise count rates for Quadrant D Data is divided into 100 sec bins |
 |
 |
| Parameter | Plot |
|---|---|
| CZT HV Monitor | 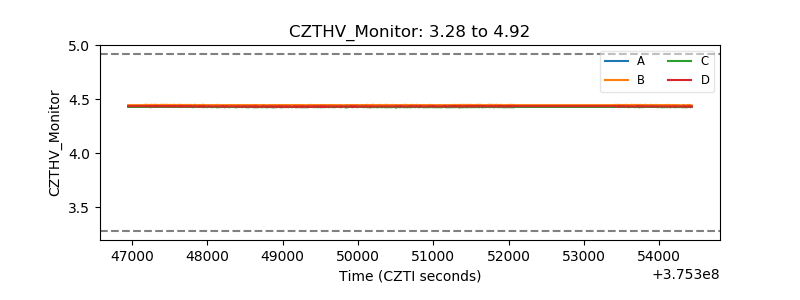 |
| D_VDD | 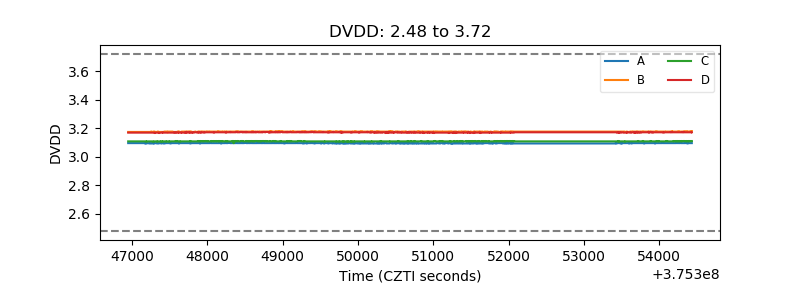 |
| Temperature 1 | 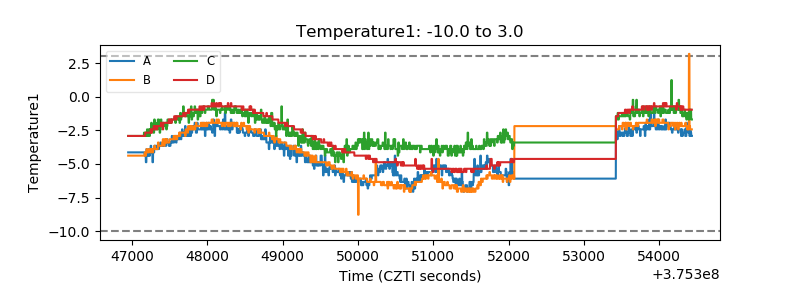 |
| Veto HV Monitor |  |
| Veto LLD | 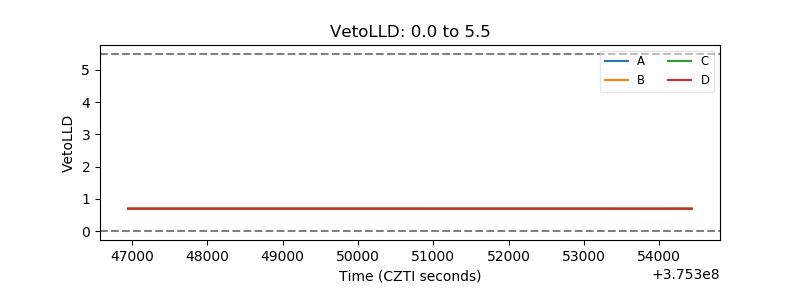 |
| Alpha Counter | 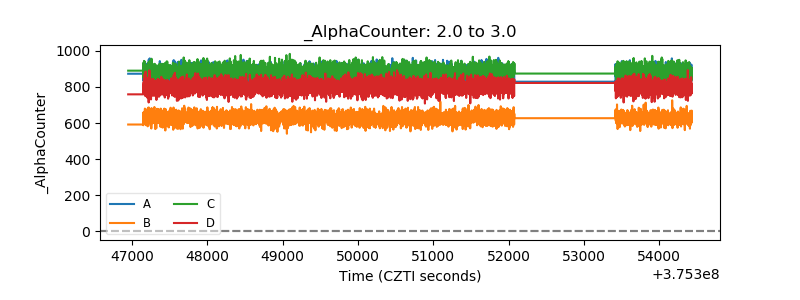 |
| _CPM_Rate | 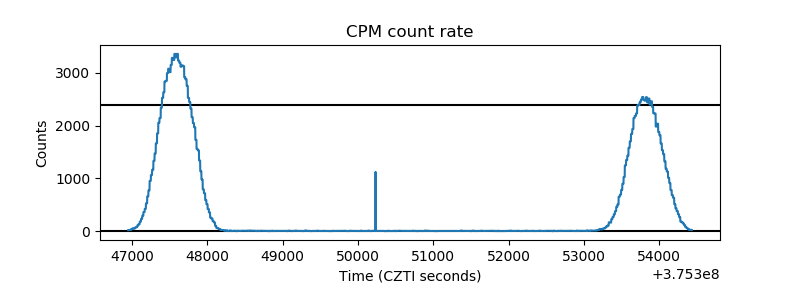 |
| CZT Counter | 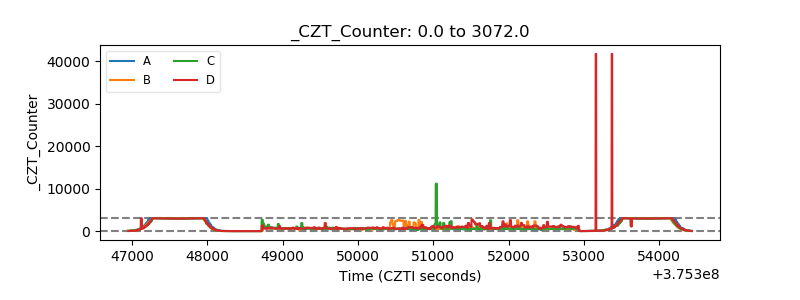 |
| +2.5 Volts monitor |  |
| +5 Volts monitor |  |
| _ROLL_ROT | 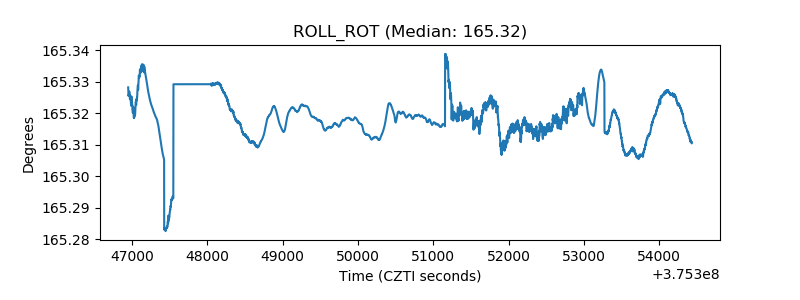 |
| _Roll_DEC | 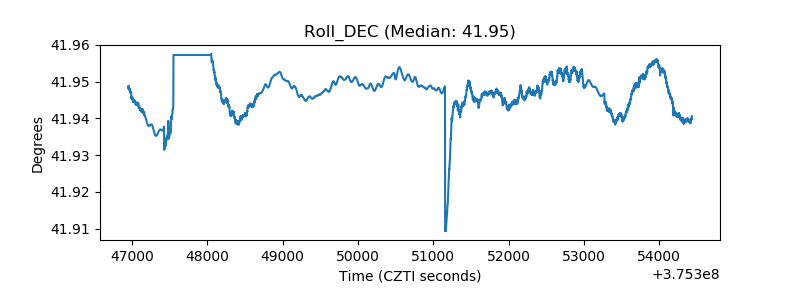 |
| _Roll_RA | 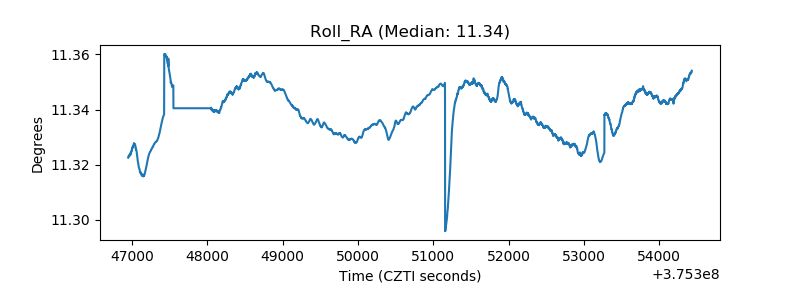 |
| Veto Counter | 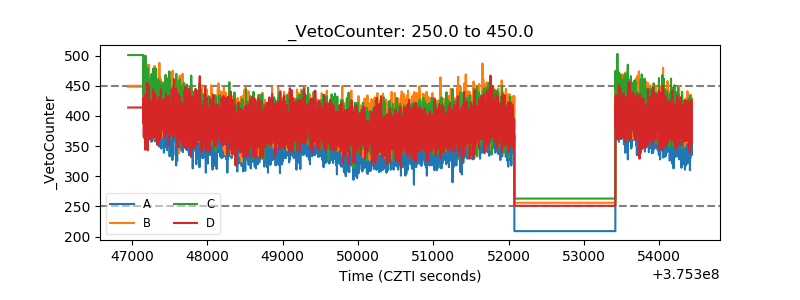 |