| Param | Original file | Final file |
|---|---|---|
| Filename | modeM0/AS1T04_072T01_9000004780_33460cztM0_level2.evt | modeM0/AS1T04_072T01_9000004780_33460cztM0_level2_quad_clean.evt |
| Size (bytes) | 950,132,160 | 133,470,720 |
| Size | 906.1 MB | 127.3 MB |
| Events in quadrant A | 5,028,276 | 850,706 |
| Events in quadrant B | 6,692,067 | 837,272 |
| Events in quadrant C | 6,093,475 | 833,418 |
| Events in quadrant D | 10,234,649 | 775,302 |
| Mode SS | |||
|---|---|---|---|
| Quadrant | BADHDUFLAG | Total packets | Discarded packets |
| A | 0 | 218 | 0 |
| B | 0 | 218 | 0 |
| C | 0 | 218 | 0 |
| D | 0 | 218 | 0 |
| Mode M0 | |||
|---|---|---|---|
| Quadrant | BADHDUFLAG | Total packets | Discarded packets |
| A | 0 | 22078 | 4 |
| B | 0 | 26701 | 3 |
| C | 0 | 24719 | 3 |
| D | 0 | 37628 | 3 |
| Mode M9 | |||
|---|---|---|---|
| Quadrant | BADHDUFLAG | Total packets | Discarded packets |
| A | 0 | 36 | 0 |
| B | 0 | 36 | 0 |
| C | 0 | 36 | 0 |
| D | 0 | 37 | 0 |
| Quadrant | Total seconds | Saturated seconds | Saturation percentage |
|---|---|---|---|
| A | 10770 | 25 | 0.232126% |
| B | 10770 | 445 | 4.131848% |
| C | 10770 | 227 | 2.107707% |
| D | 10770 | 566 | 5.255339% |
Noise dominated data is calculated using 1-second bins in cleaned event files. If a bin has >2000 counts, and if more than 50% of those come from <1% of pixels, then it is considered to be noise-dominated and hence unusable.
| Quadrant | # 1 sec bins | Bins with >0 counts | Bins with >2000 counts | High rate bins dominated by noise | Noise dominated (total time) | Noise dominated (detector-on time) | Marked lightcurve |
|---|---|---|---|---|---|---|---|
| A | 13545 | 10772 | 16 | 16 | 0.12% | 0.15% | 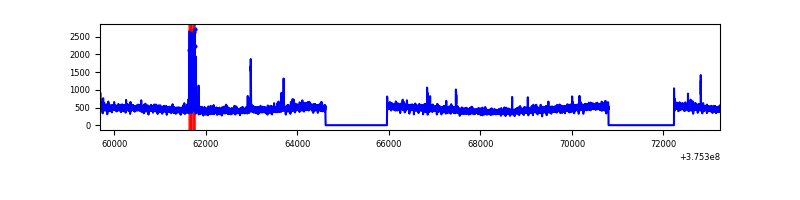 |
| B | 13545 | 10772 | 320 | 320 | 2.36% | 2.97% | 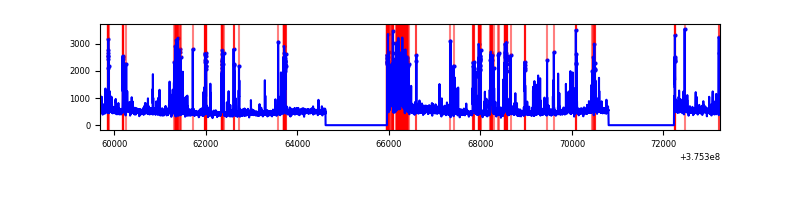 |
| C | 13545 | 10772 | 171 | 171 | 1.26% | 1.59% | 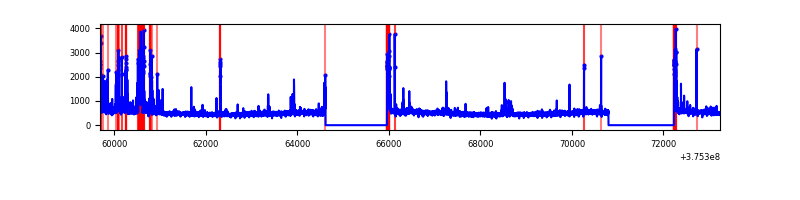 |
| D | 13545 | 10772 | 485 | 485 | 3.58% | 4.50% | 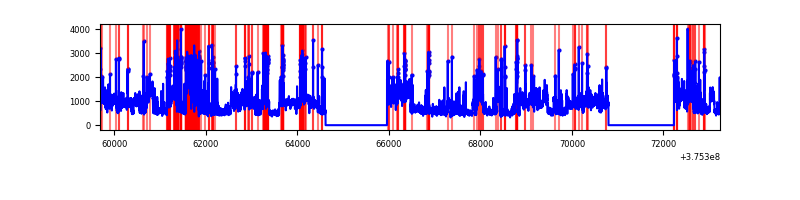 |
Top three noisy pixels from each quadrant. If the there are fewer than three noisy pixels in the level2.evt file, extra rows are filled as -1
| Pixel properties | Quadrant properties | ||||||
|---|---|---|---|---|---|---|---|
| Quadrant | DetID | PixID | Counts | Sigma | Mean | Median | Sigma |
| A | 9 | 143 | 144670 | 576.02 | 1247 | 1221 | 249.0 |
| A | 13 | 6 | 21789 | 82.59 | 1247 | 1221 | 249.0 |
| A | 13 | 254 | 19325 | 72.7 | 1247 | 1221 | 249.0 |
| B | 5 | 172 | 1415622 | 6055.51 | 1221 | 1187 | 233.6 |
| B | 0 | 230 | 122546 | 519.56 | 1221 | 1187 | 233.6 |
| B | 5 | 255 | 54249 | 227.17 | 1221 | 1187 | 233.6 |
| C | 1 | 23 | 544581 | 1970.44 | 1197 | 1206 | 275.8 |
| C | 15 | 214 | 457331 | 1654.05 | 1197 | 1206 | 275.8 |
| C | 0 | 10 | 229438 | 827.64 | 1197 | 1206 | 275.8 |
| D | 8 | 195 | 3797782 | 11895.14 | 1173 | 1149 | 319.2 |
| D | 1 | 52 | 619215 | 1936.45 | 1173 | 1149 | 319.2 |
| D | 2 | 250 | 341671 | 1066.88 | 1173 | 1149 | 319.2 |
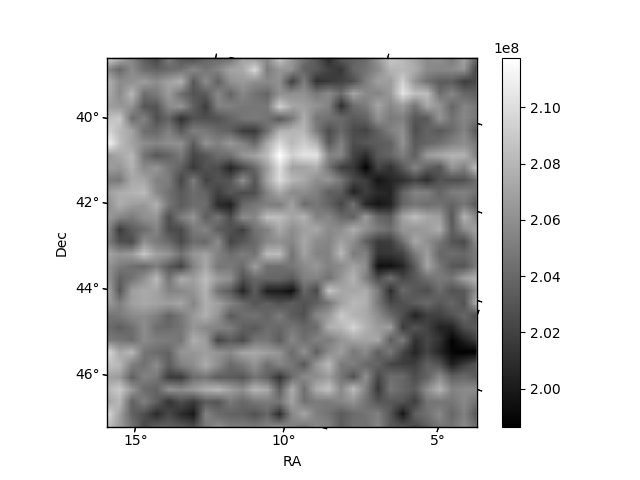
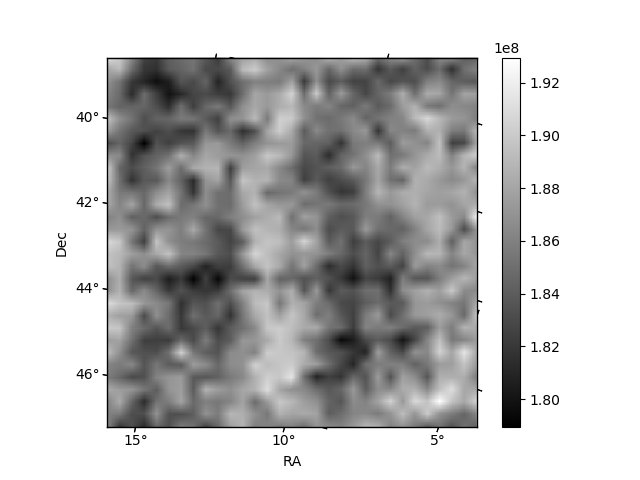
Histogram calculated using DETX and DETY for each event in the final _common_clean file
| Quadrant A | 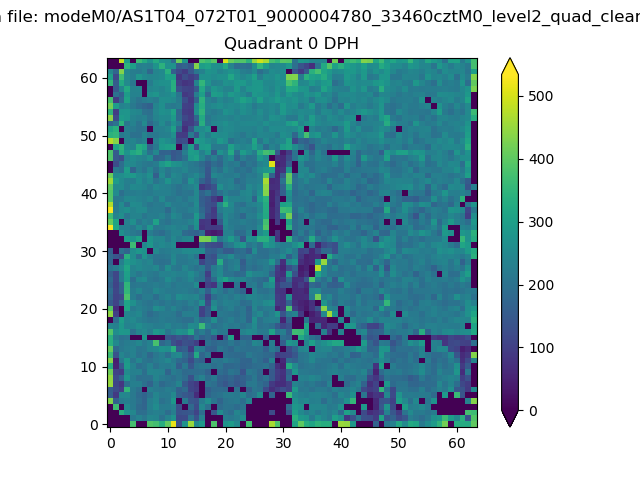 |
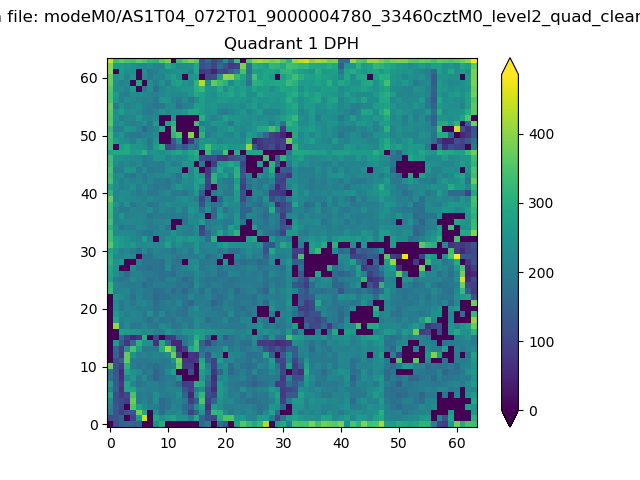 |
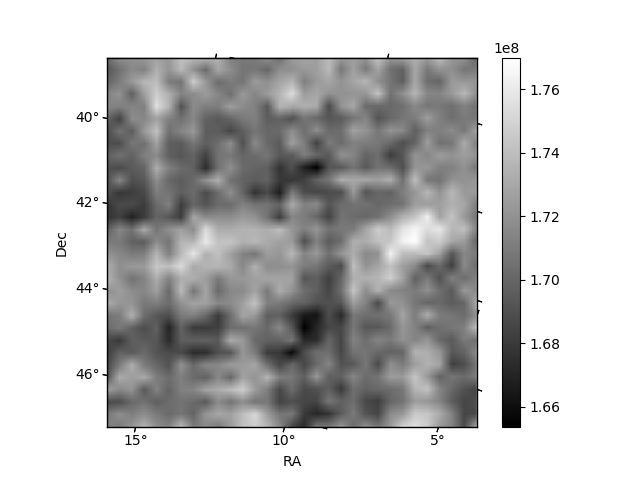
Quadrant B |
|---|---|---|---|
| Quadrant D | 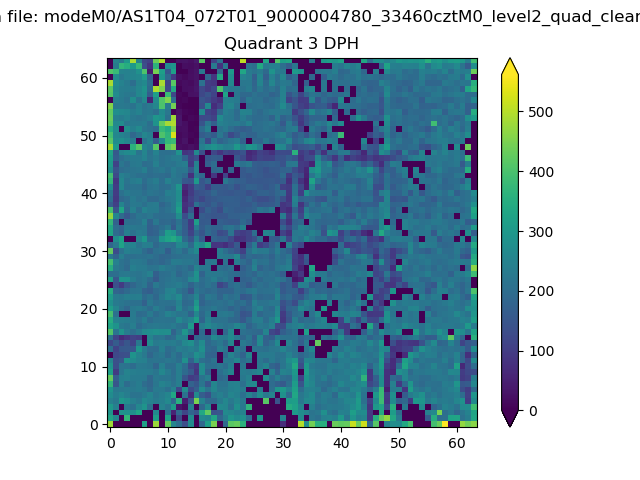 |
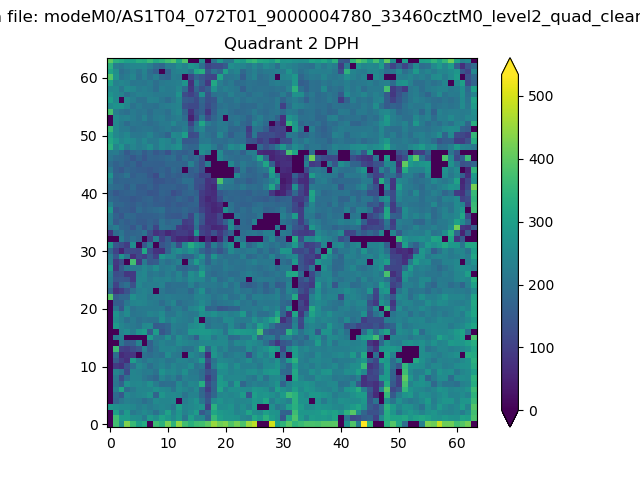 |
Quadrant C |
| Plot type | Count rate plots | Images |
|---|---|---|
| Comparison with Poisson distribution Blue bars denote a histogram of data divided into 1 sec bins. Red curve is a Poisson curve with rate = median count rate of data. |
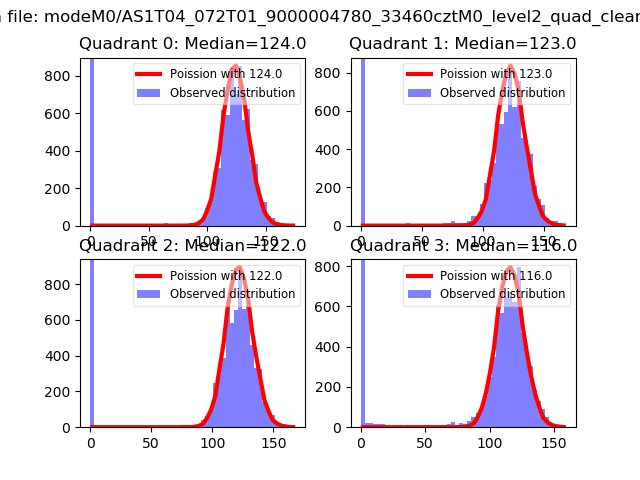 |
 |
| Quadrant-wise count rates Data is divided into 100 sec bins |
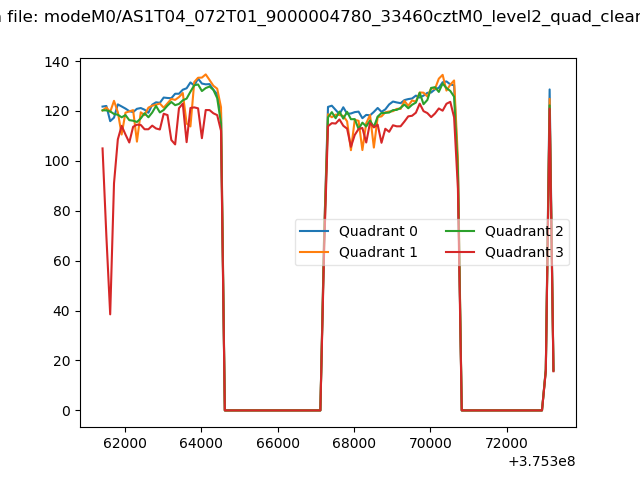 |
|
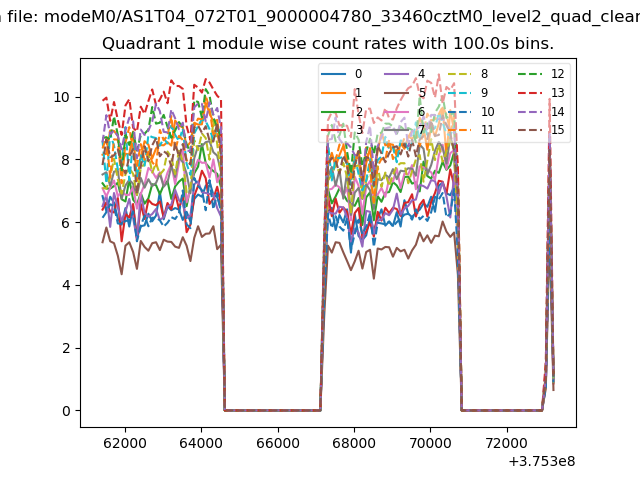
| Module-wise count rates for Quadrant A Data is divided into 100 sec bins |
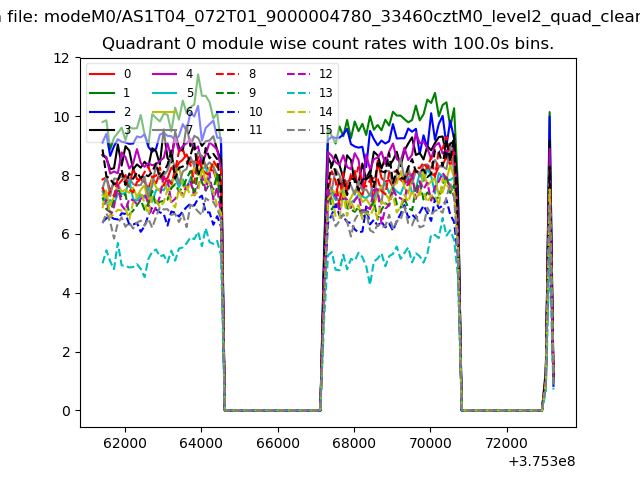 |
 |
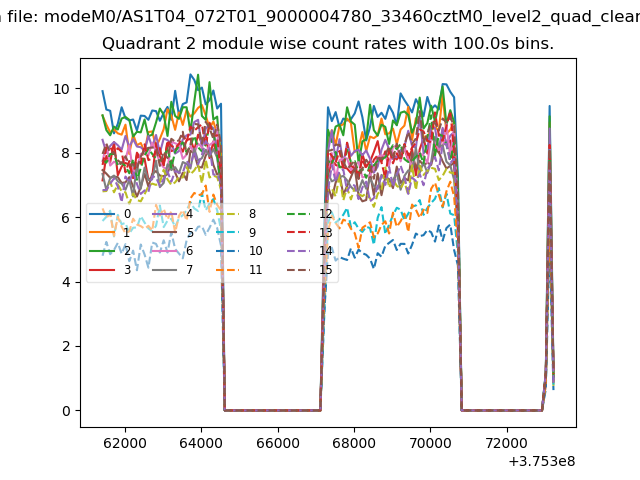
| Module-wise count rates for Quadrant B Data is divided into 100 sec bins |
 |
 |
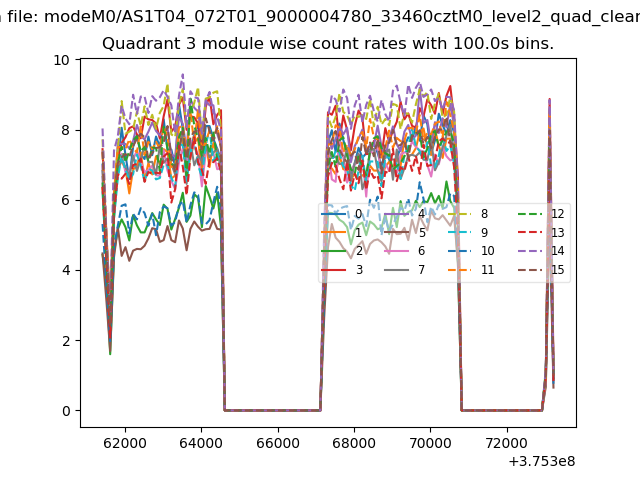
| Module-wise count rates for Quadrant C Data is divided into 100 sec bins |
 |
 |
| Module-wise count rates for Quadrant D Data is divided into 100 sec bins |
 |
 |
| Parameter | Plot |
|---|---|
| CZT HV Monitor | 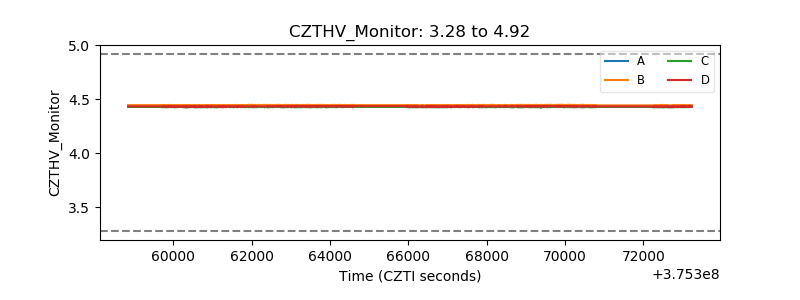 |
| D_VDD | 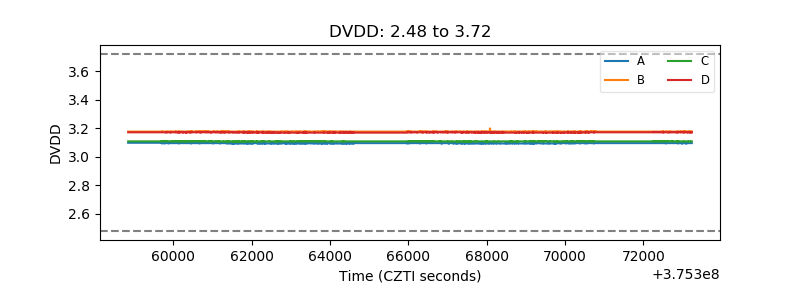 |
| Temperature 1 | 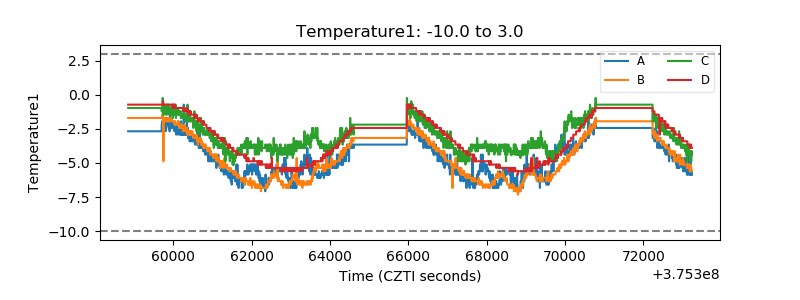 |
| Veto HV Monitor | 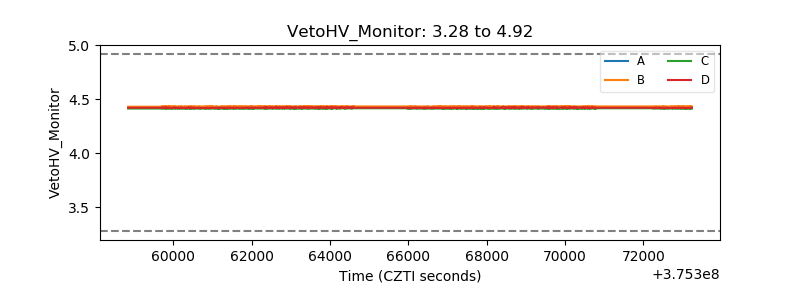 |
| Veto LLD | 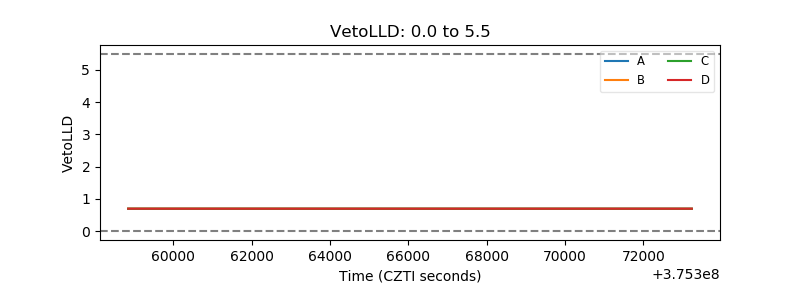 |
| Alpha Counter | 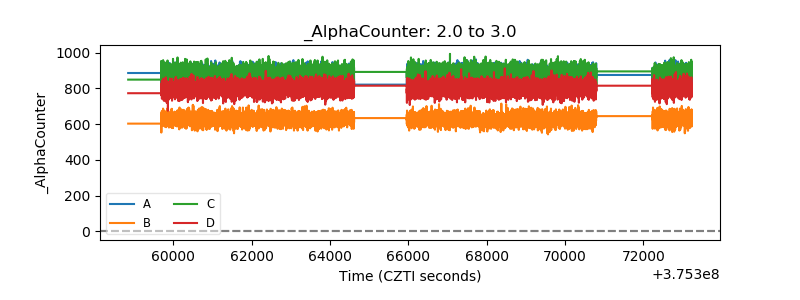 |
| _CPM_Rate | 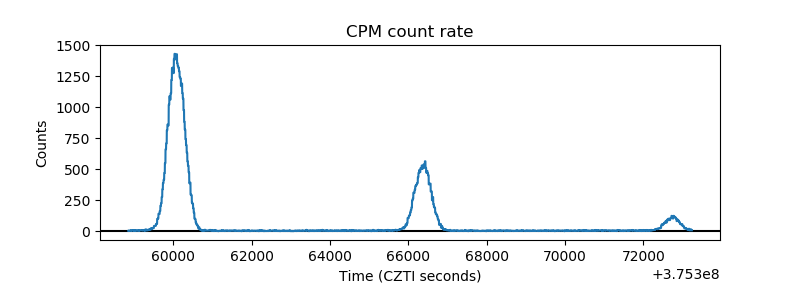 |
| CZT Counter | 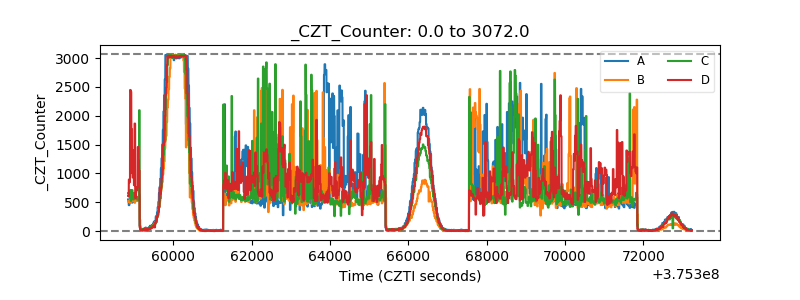 |
| +2.5 Volts monitor |  |
| +5 Volts monitor |  |
| _ROLL_ROT | 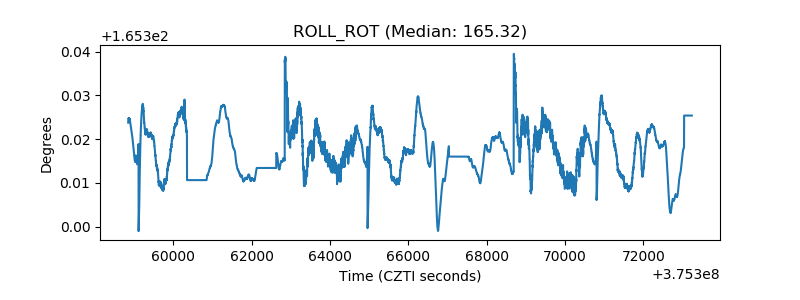 |
| _Roll_DEC | 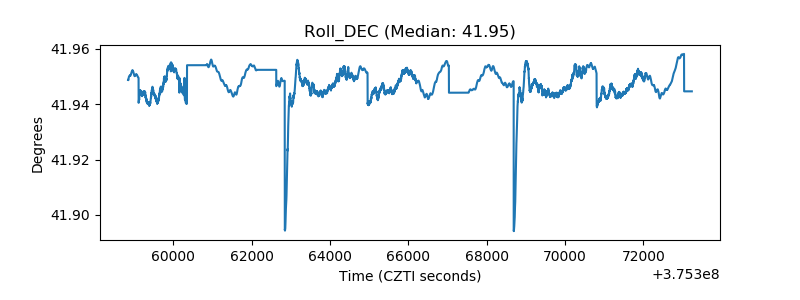 |
| _Roll_RA | 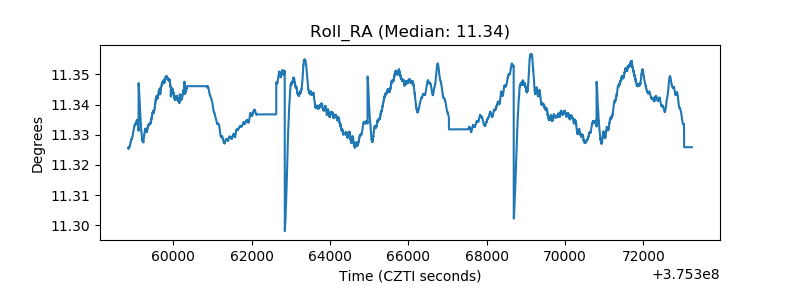 |
| Veto Counter | 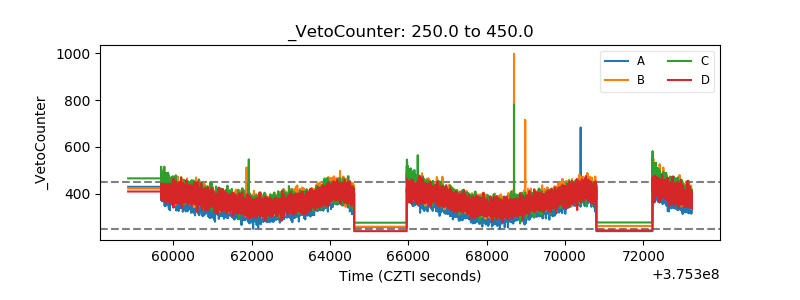 |