| Param | Original file | Final file |
|---|---|---|
| Filename | modeM0/AS1T04_071T01_9000004782cztM0_level2.fits | modeM0/AS1T04_071T01_9000004782cztM0_level2_quad_clean.evt |
| Size (bytes) | 780,022,080 | 690,255,360 |
| Size | 743.9 MB | 658.3 MB |
| Events in quadrant A | 4,955,394 | 4,251,095 |
| Events in quadrant B | 4,446,098 | 3,630,016 |
| Events in quadrant C | 4,583,126 | 3,855,414 |
| Events in quadrant D | 4,056,208 | 3,589,815 |
| Mode M0 | |||
|---|---|---|---|
| Quadrant | BADHDUFLAG | Total packets | Discarded packets |
| A | 0 | 184726 | 0 |
| B | 0 | 246617 | 0 |
| C | 0 | 247693 | 0 |
| D | 0 | 268351 | 0 |
| Mode SS | |||
|---|---|---|---|
| Quadrant | BADHDUFLAG | Total packets | Discarded packets |
| A | 0 | 1662 | 0 |
| B | 0 | 1662 | 0 |
| C | 0 | 1662 | 0 |
| D | 0 | 1662 | 0 |
| Mode M9 | |||
|---|---|---|---|
| Quadrant | BADHDUFLAG | Total packets | Discarded packets |
| A | 0 | 285 | 0 |
| B | 0 | 285 | 0 |
| C | 0 | 285 | 0 |
| D | 0 | 285 | 0 |
| Quadrant | Total seconds | Saturated seconds | Saturation percentage |
|---|---|---|---|
| A | 81318 | 1440 | 1.770826% |
| B | 81318 | 9905 | 12.180575% |
| C | 81318 | 4337 | 5.333383% |
| D | 81318 | 2971 | 3.653558% |
Noise dominated data is calculated using 1-second bins in cleaned event files. If a bin has >2000 counts, and if more than 50% of those come from <1% of pixels, then it is considered to be noise-dominated and hence unusable.
| Quadrant | # 1 sec bins | Bins with >0 counts | Bins with >2000 counts | High rate bins dominated by noise | Noise dominated (total time) | Noise dominated (detector-on time) | Marked lightcurve |
|---|---|---|---|---|---|---|---|
| A | 109939 | 81317 | 0 | 0 | 0.00% | 0.00% |  |
| B | 109939 | 81134 | 0 | 0 | 0.00% | 0.00% |  |
| C | 109939 | 81300 | 0 | 0 | 0.00% | 0.00% |  |
| D | 109939 | 81286 | 0 | 0 | 0.00% | 0.00% | 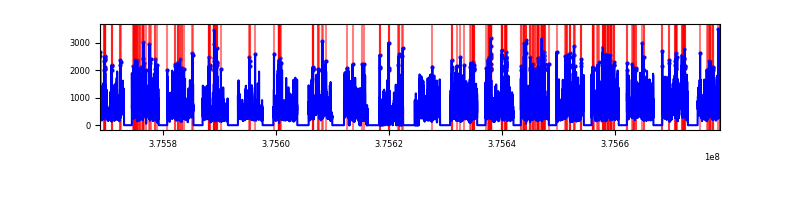 |
Top three noisy pixels from each quadrant. If the there are fewer than three noisy pixels in the level2.evt file, extra rows are filled as -1
| Pixel properties | Quadrant properties | ||||||
|---|---|---|---|---|---|---|---|
| Quadrant | DetID | PixID | Counts | Sigma | Mean | Median | Sigma |
| A | 0 | 29 | 4028 | 9.02 | 1291 | 1214 | 312.0 |
| A | 9 | 19 | 3912 | 8.65 | 1291 | 1214 | 312.0 |
| A | 7 | 110 | 3905 | 8.62 | 1291 | 1214 | 312.0 |
| B | 2 | 9 | 3690 | 10.92 | 1180 | 1129 | 234.4 |
| B | 3 | 80 | 3419 | 9.77 | 1180 | 1129 | 234.4 |
| B | 2 | 8 | 3082 | 8.33 | 1180 | 1129 | 234.4 |
| C | 1 | 81 | 3825 | 8.64 | 1213 | 1139 | 310.8 |
| C | 1 | 80 | 3753 | 8.41 | 1213 | 1139 | 310.8 |
| C | 3 | 187 | 3143 | 6.45 | 1213 | 1139 | 310.8 |
| D | 7 | 3 | 3051 | 6.38 | 1161 | 1059 | 312.0 |
| D | 3 | 14 | 2943 | 6.04 | 1161 | 1059 | 312.0 |
| D | 6 | 67 | 2916 | 5.95 | 1161 | 1059 | 312.0 |
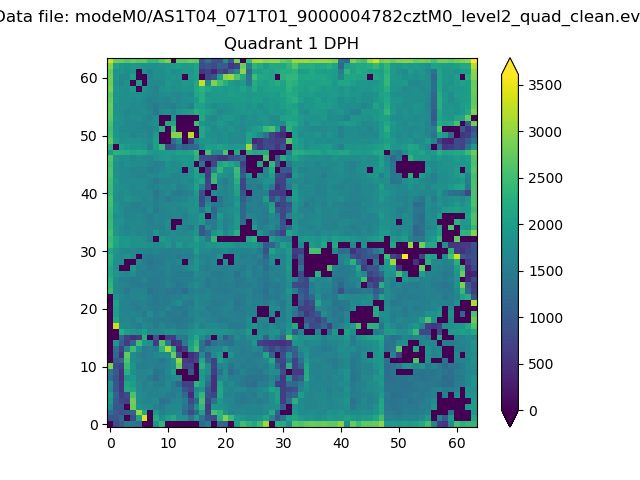
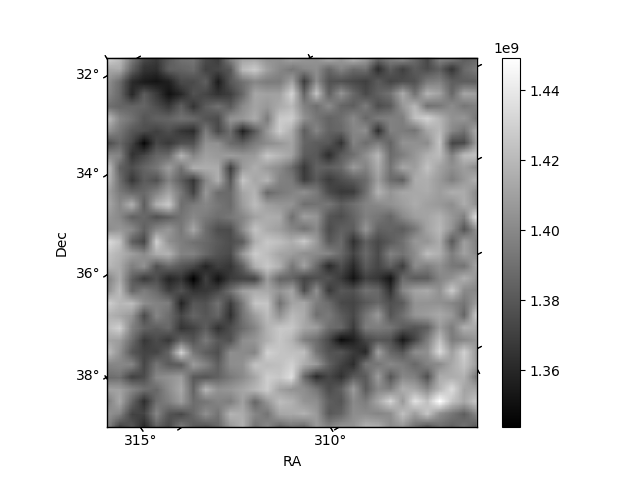
Histogram calculated using DETX and DETY for each event in the final _common_clean file
| Quadrant A |  |
 |
Quadrant B |
|---|---|---|---|
| Quadrant D | 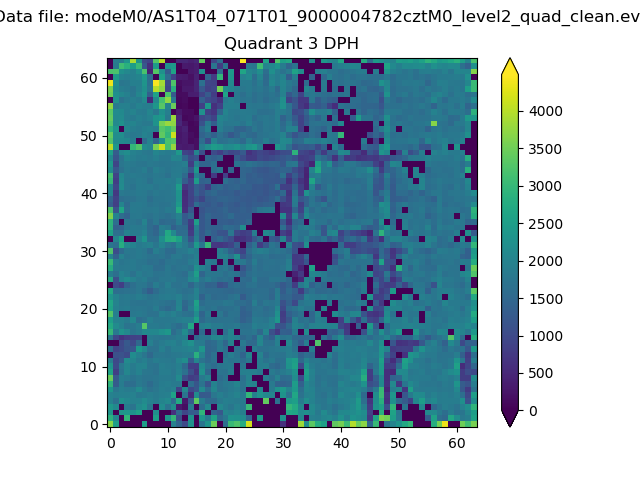 |
 |
Quadrant C |
| Plot type | Count rate plots | Images |
|---|---|---|
| Comparison with Poisson distribution Blue bars denote a histogram of data divided into 1 sec bins. Red curve is a Poisson curve with rate = median count rate of data. |
 |
 |
| Quadrant-wise count rates Data is divided into 100 sec bins |
 |
|
| Module-wise count rates for Quadrant A Data is divided into 100 sec bins |
 |
 |
| Module-wise count rates for Quadrant B Data is divided into 100 sec bins |
 |
 |
| Module-wise count rates for Quadrant C Data is divided into 100 sec bins |
 |
 |
| Module-wise count rates for Quadrant D Data is divided into 100 sec bins |
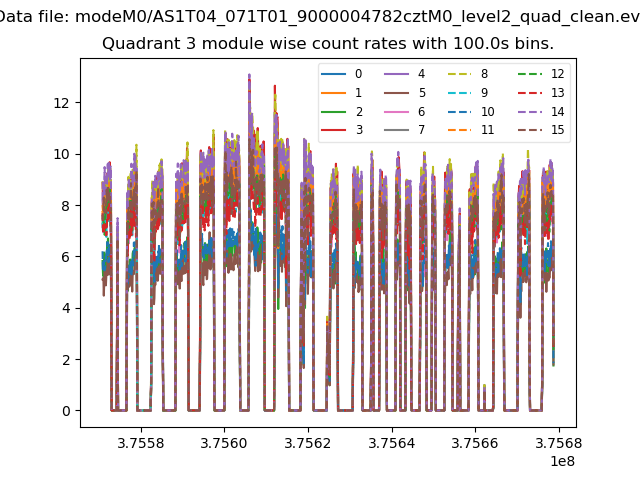 |
 |
| Parameter | Plot |
|---|---|
| CZT HV Monitor |  |
| D_VDD | 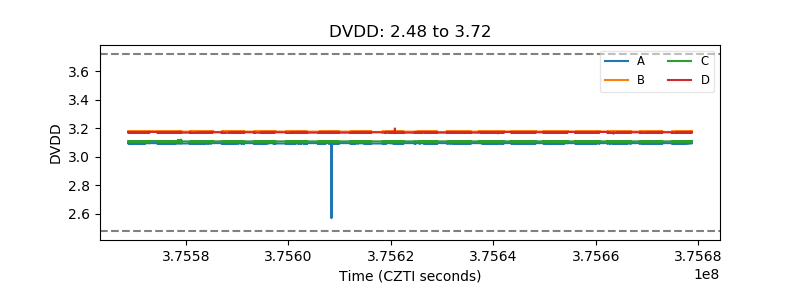 |
| Temperature 1 |  |
| Veto HV Monitor | 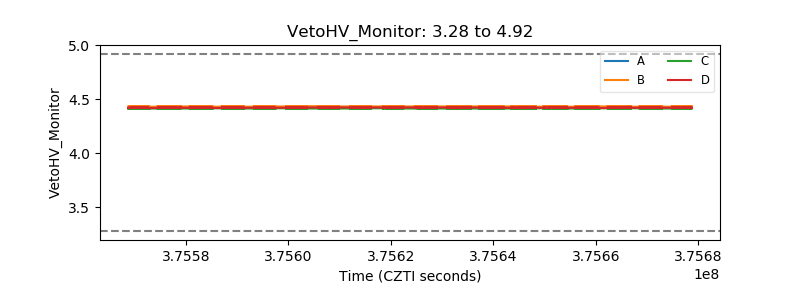 |
| Veto LLD | 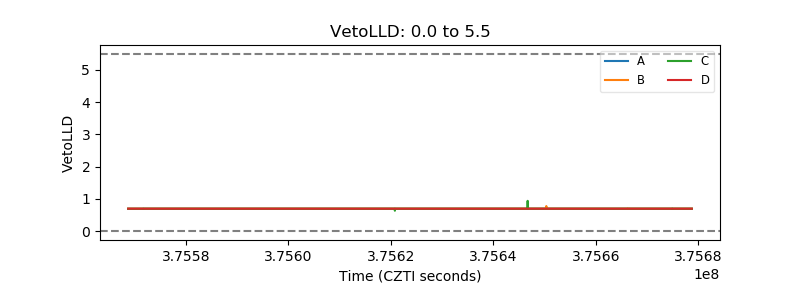 |
| Alpha Counter | 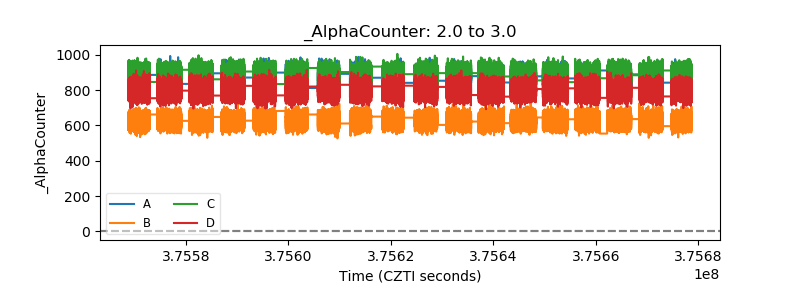 |
| _CPM_Rate |  |
| CZT Counter |  |
| +2.5 Volts monitor |  |
| +5 Volts monitor |  |
| _ROLL_ROT |  |
| _Roll_DEC |  |
| _Roll_RA |  |
| Veto Counter |  |