| Param | Original file | Final file |
|---|---|---|
| Filename | modeM0/AS1T04_071T01_9000004782_33316cztM0_level2.evt | modeM0/AS1T04_071T01_9000004782_33316cztM0_level2_quad_clean.evt |
| Size (bytes) | 569,125,440 | 57,669,120 |
| Size | 542.8 MB | 55.0 MB |
| Events in quadrant A | 3,115,158 | 349,714 |
| Events in quadrant B | 4,755,391 | 315,244 |
| Events in quadrant C | 3,433,818 | 343,088 |
| Events in quadrant D | 5,533,781 | 326,581 |
| Mode M0 | |||
|---|---|---|---|
| Quadrant | BADHDUFLAG | Total packets | Discarded packets |
| A | 0 | 12979 | 3 |
| B | 0 | 17909 | 2 |
| C | 0 | 13604 | 2 |
| D | 0 | 20383 | 2 |
| Mode SS | |||
|---|---|---|---|
| Quadrant | BADHDUFLAG | Total packets | Discarded packets |
| A | 0 | 122 | 0 |
| B | 0 | 122 | 0 |
| C | 0 | 122 | 0 |
| D | 0 | 122 | 0 |
| Mode M9 | |||
|---|---|---|---|
| Quadrant | BADHDUFLAG | Total packets | Discarded packets |
| A | 0 | 29 | 0 |
| B | 0 | 29 | 0 |
| C | 0 | 29 | 0 |
| D | 0 | 29 | 0 |
| Quadrant | Total seconds | Saturated seconds | Saturation percentage |
|---|---|---|---|
| A | 5876 | 72 | 1.225323% |
| B | 5876 | 839 | 14.278421% |
| C | 5876 | 62 | 1.055140% |
| D | 5876 | 356 | 6.058543% |
Noise dominated data is calculated using 1-second bins in cleaned event files. If a bin has >2000 counts, and if more than 50% of those come from <1% of pixels, then it is considered to be noise-dominated and hence unusable.
| Quadrant | # 1 sec bins | Bins with >0 counts | Bins with >2000 counts | High rate bins dominated by noise | Noise dominated (total time) | Noise dominated (detector-on time) | Marked lightcurve |
|---|---|---|---|---|---|---|---|
| A | 8802 | 5878 | 63 | 63 | 0.72% | 1.07% | 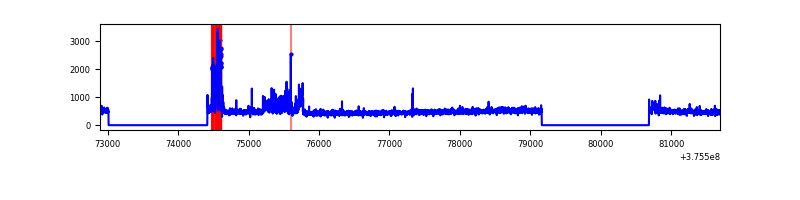 |
| B | 8802 | 5878 | 482 | 482 | 5.48% | 8.20% | 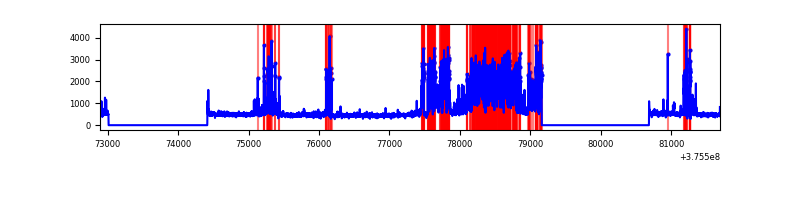 |
| C | 8802 | 5878 | 52 | 52 | 0.59% | 0.88% | 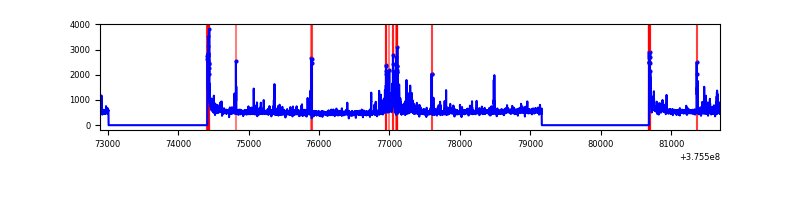 |
| D | 8802 | 5878 | 278 | 278 | 3.16% | 4.73% | 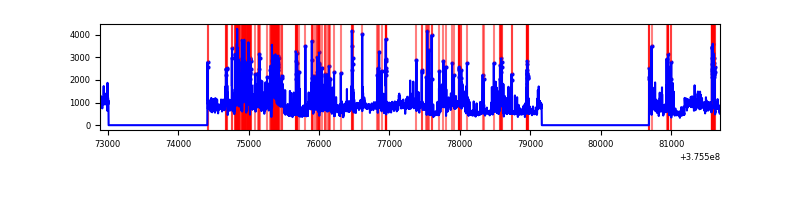 |
Top three noisy pixels from each quadrant. If the there are fewer than three noisy pixels in the level2.evt file, extra rows are filled as -1
| Pixel properties | Quadrant properties | ||||||
|---|---|---|---|---|---|---|---|
| Quadrant | DetID | PixID | Counts | Sigma | Mean | Median | Sigma |
| A | 15 | 169 | 408755 | 2909.09 | 697 | 682 | 140.3 |
| A | 13 | 6 | 9219 | 60.86 | 697 | 682 | 140.3 |
| A | 13 | 254 | 6759 | 43.32 | 697 | 682 | 140.3 |
| B | 5 | 172 | 1314297 | 10257.3 | 663 | 645 | 128.1 |
| B | 0 | 219 | 708425 | 5526.51 | 663 | 645 | 128.1 |
| B | 0 | 190 | 55813 | 430.76 | 663 | 645 | 128.1 |
| C | 15 | 214 | 272834 | 1720.14 | 677 | 682 | 158.2 |
| C | 10 | 49 | 245624 | 1548.16 | 677 | 682 | 158.2 |
| C | 0 | 10 | 102872 | 645.89 | 677 | 682 | 158.2 |
| D | 8 | 195 | 1575495 | 8790.62 | 658 | 644 | 179.2 |
| D | 2 | 249 | 677179 | 3776.33 | 658 | 644 | 179.2 |
| D | 13 | 249 | 281688 | 1568.75 | 658 | 644 | 179.2 |
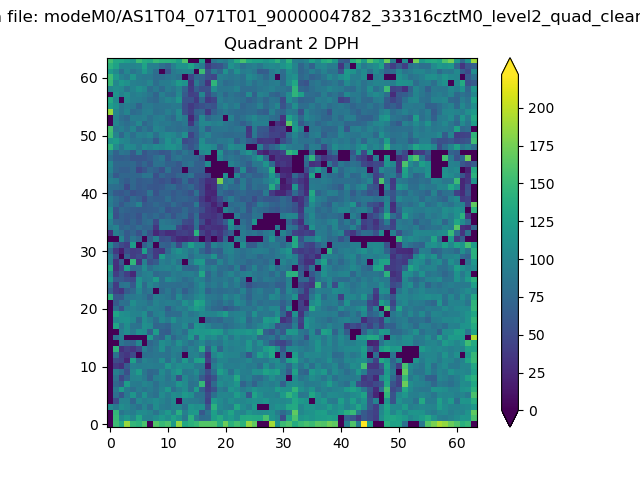
Histogram calculated using DETX and DETY for each event in the final _common_clean file
| Quadrant A | 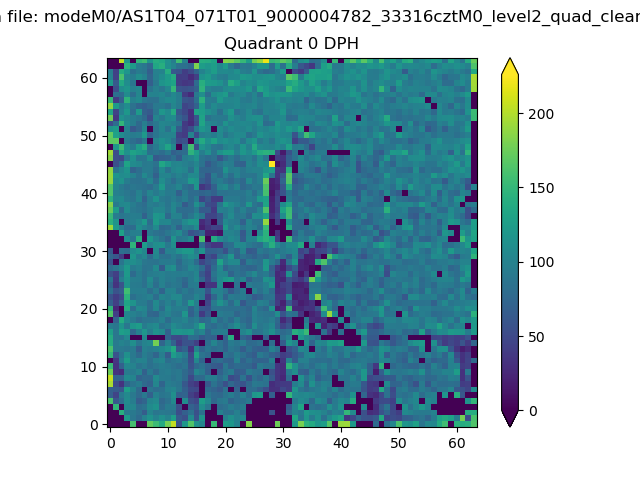 |
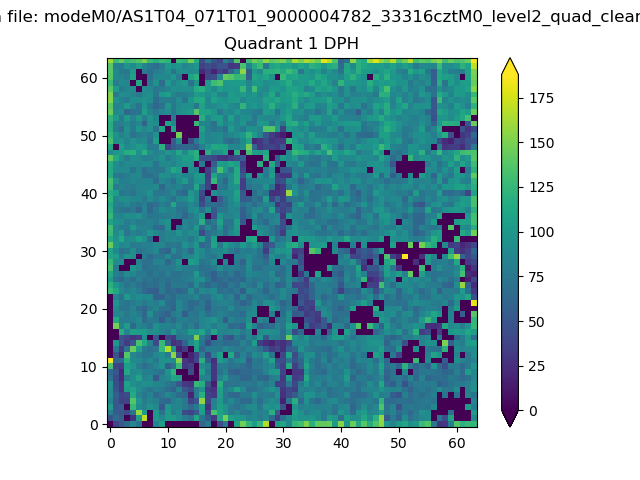 |
Quadrant B |
|---|---|---|---|
| Quadrant D | 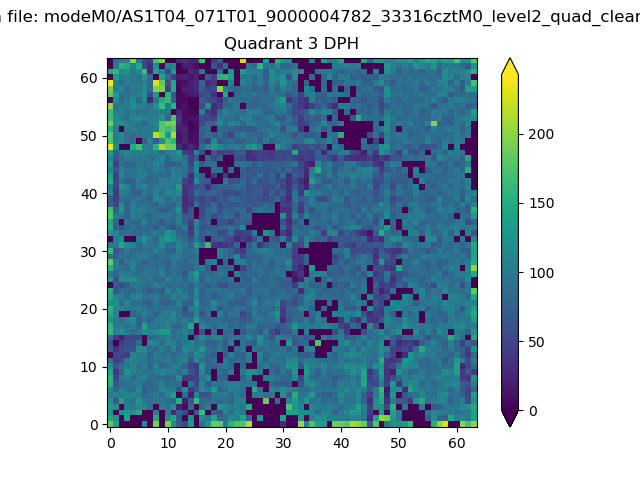 |
 |
Quadrant C |
| Plot type | Count rate plots | Images |
|---|---|---|
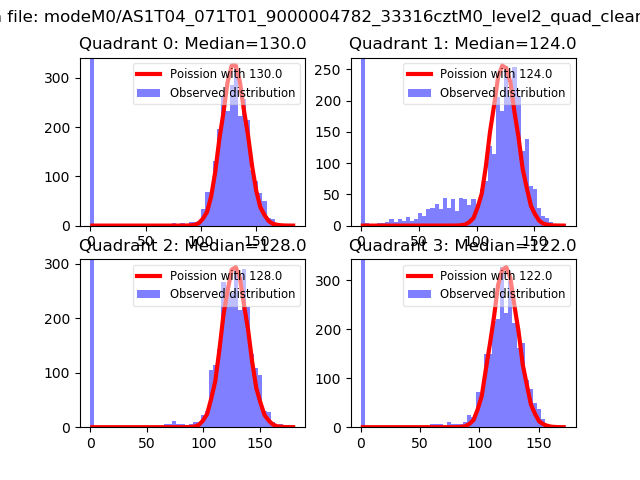
| Comparison with Poisson distribution Blue bars denote a histogram of data divided into 1 sec bins. Red curve is a Poisson curve with rate = median count rate of data. |
 |
 |
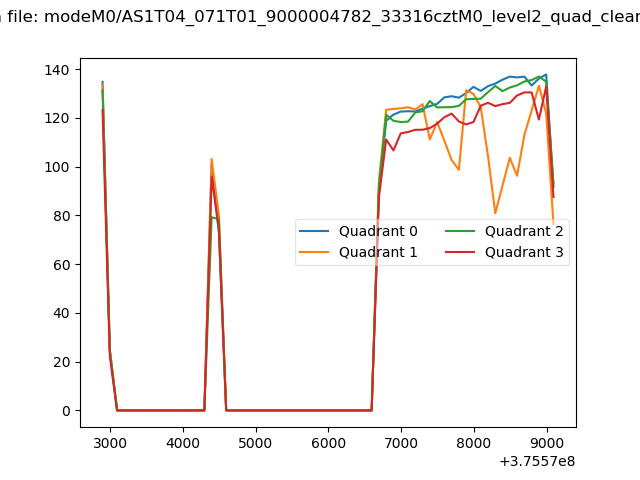
| Quadrant-wise count rates Data is divided into 100 sec bins |
 |
|
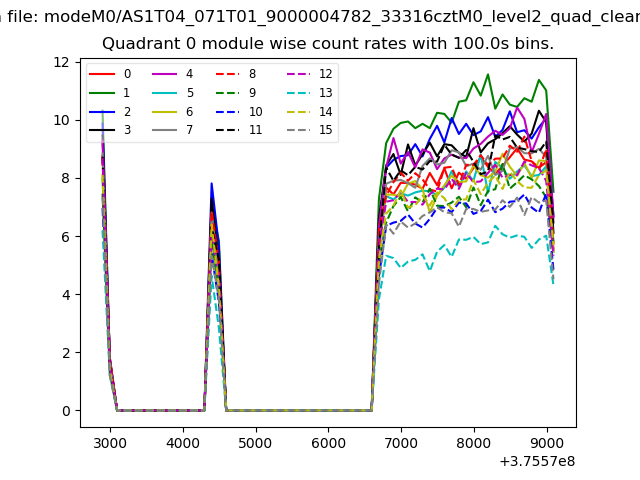
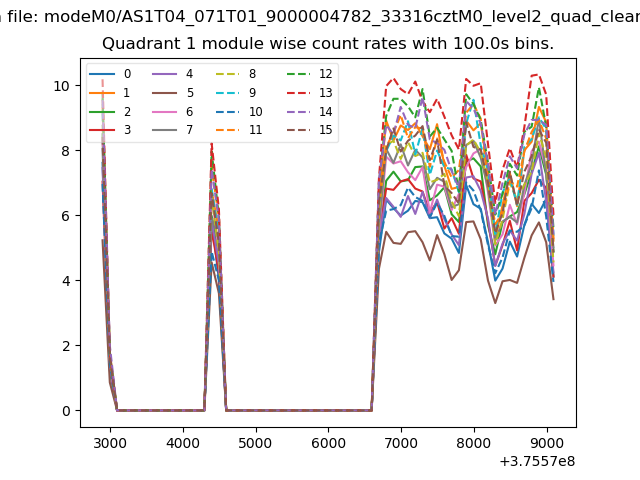
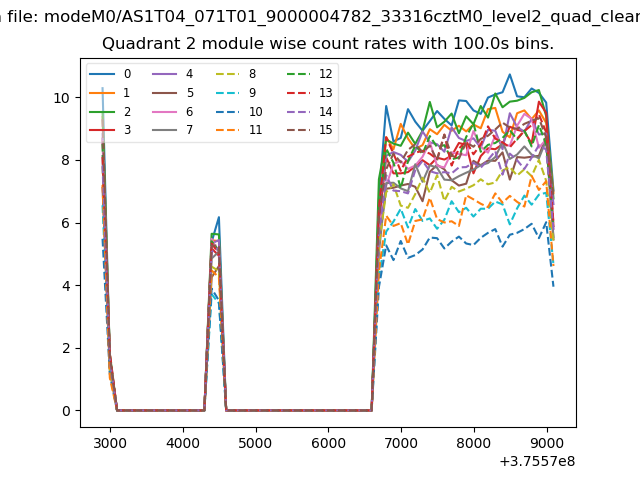
| Module-wise count rates for Quadrant A Data is divided into 100 sec bins |
 |
 |
| Module-wise count rates for Quadrant B Data is divided into 100 sec bins |
 |
 |
| Module-wise count rates for Quadrant C Data is divided into 100 sec bins |
 |
 |
| Module-wise count rates for Quadrant D Data is divided into 100 sec bins |
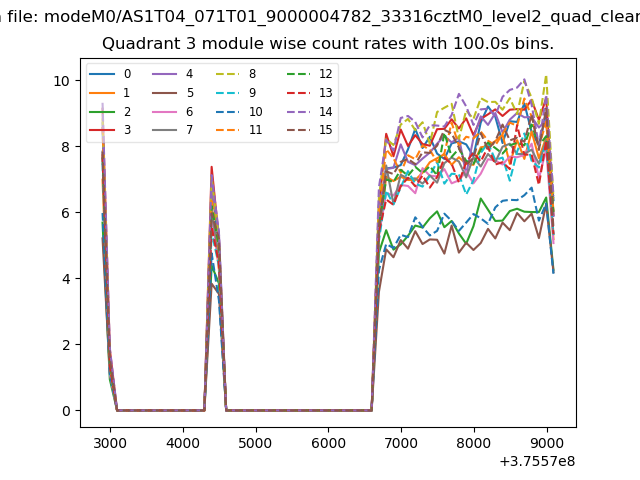 |
 |
| Parameter | Plot |
|---|---|
| CZT HV Monitor | 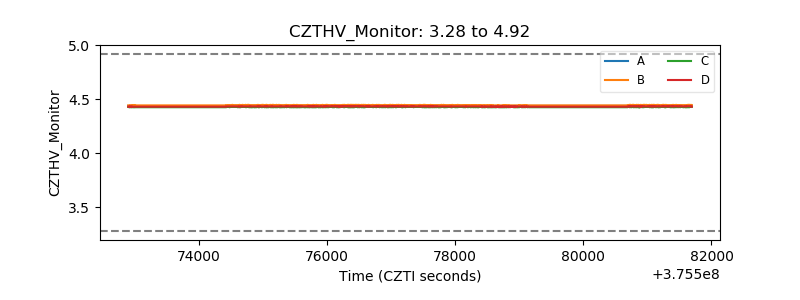 |
| D_VDD | 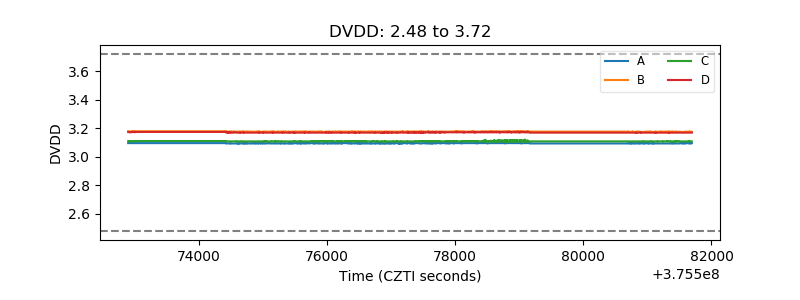 |
| Temperature 1 | 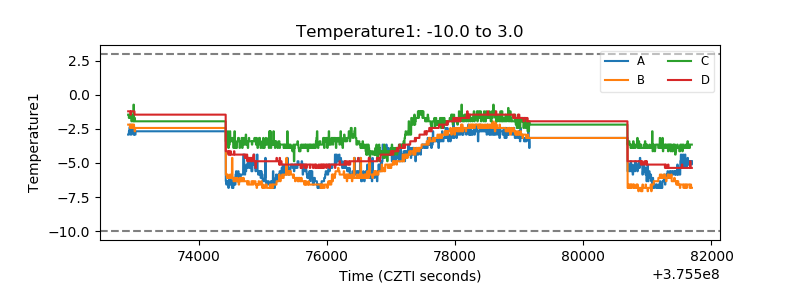 |
| Veto HV Monitor | 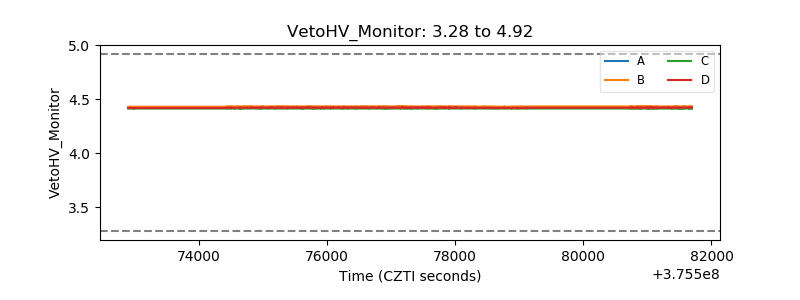 |
| Veto LLD | 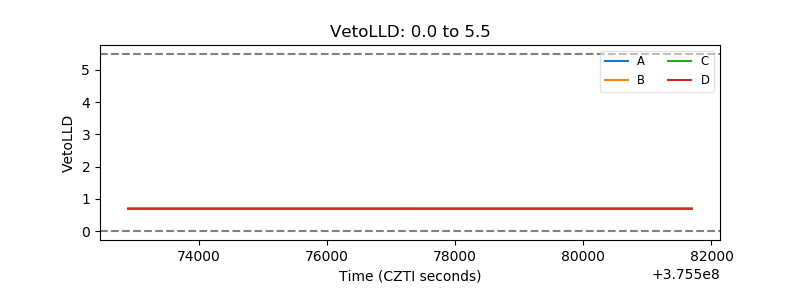 |
| Alpha Counter | 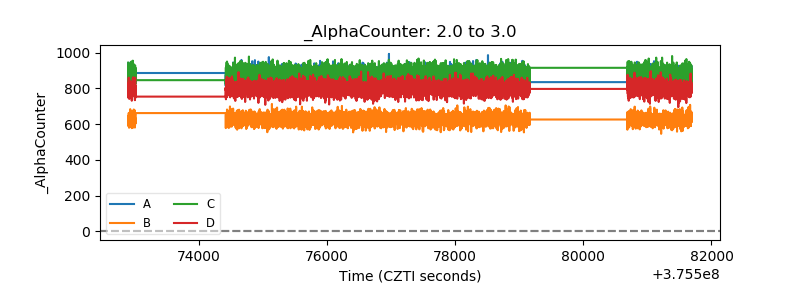 |
| _CPM_Rate | 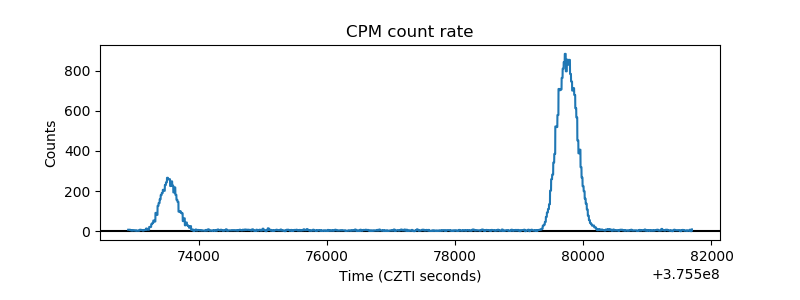 |
| CZT Counter | 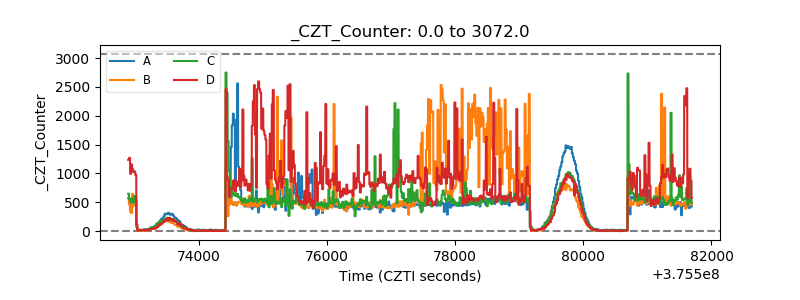 |
| +2.5 Volts monitor | 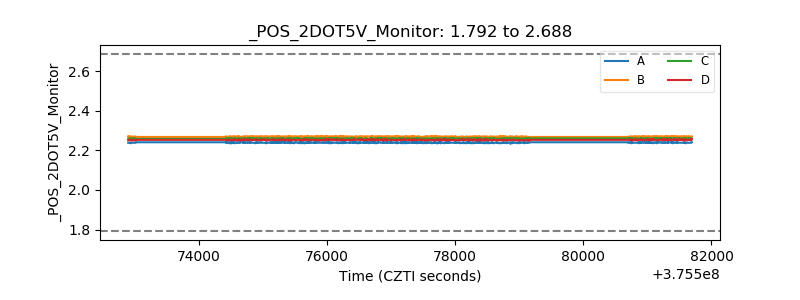 |
| +5 Volts monitor |  |
| _ROLL_ROT | 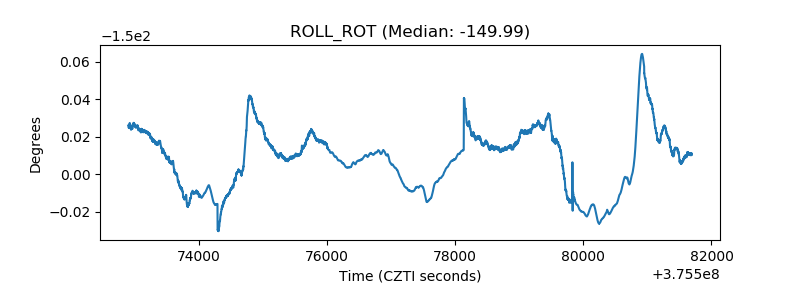 |
| _Roll_DEC | 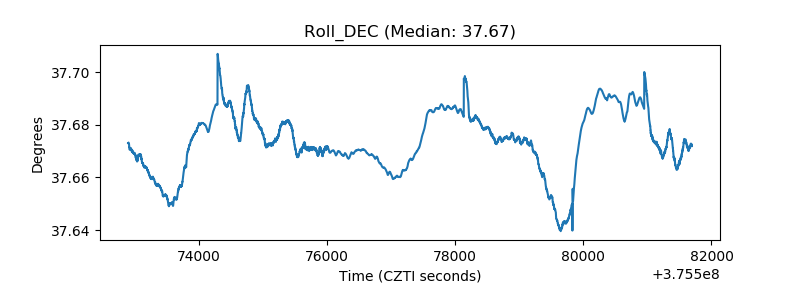 |
| _Roll_RA | 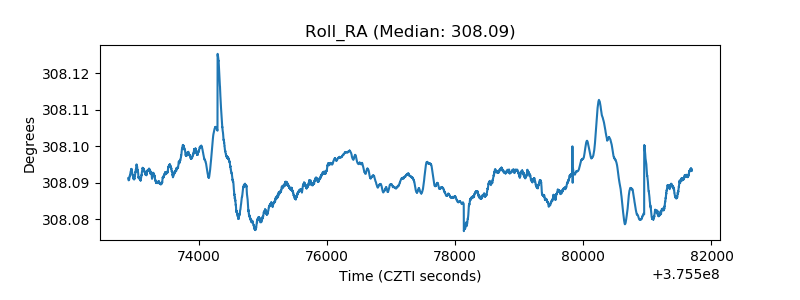 |
| Veto Counter | 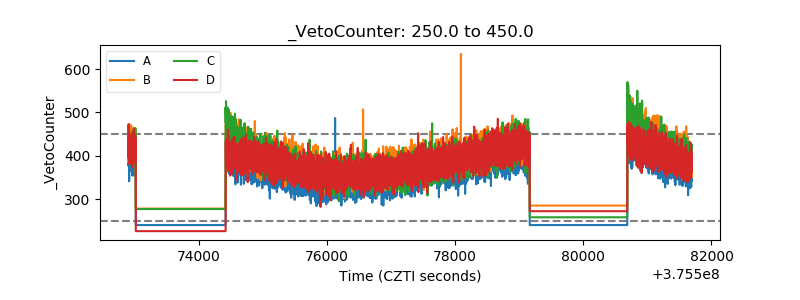 |