| Param | Original file | Final file |
|---|---|---|
| Filename | modeM0/AS1T04_071T01_9000004782_33317cztM0_level2.evt | modeM0/AS1T04_071T01_9000004782_33317cztM0_level2_quad_clean.evt |
| Size (bytes) | 580,472,640 | 56,393,280 |
| Size | 553.6 MB | 53.8 MB |
| Events in quadrant A | 2,806,087 | 354,433 |
| Events in quadrant B | 5,161,884 | 292,557 |
| Events in quadrant C | 4,365,480 | 343,725 |
| Events in quadrant D | 4,872,619 | 329,675 |
| Mode M0 | |||
|---|---|---|---|
| Quadrant | BADHDUFLAG | Total packets | Discarded packets |
| A | 0 | 11753 | 3 |
| B | 0 | 18959 | 2 |
| C | 0 | 16605 | 2 |
| D | 0 | 18344 | 2 |
| Mode SS | |||
|---|---|---|---|
| Quadrant | BADHDUFLAG | Total packets | Discarded packets |
| A | 0 | 112 | 0 |
| B | 0 | 112 | 0 |
| C | 0 | 112 | 0 |
| D | 0 | 112 | 0 |
| Mode M9 | |||
|---|---|---|---|
| Quadrant | BADHDUFLAG | Total packets | Discarded packets |
| A | 0 | 22 | 0 |
| B | 0 | 22 | 0 |
| C | 0 | 22 | 0 |
| D | 0 | 23 | 0 |
| Quadrant | Total seconds | Saturated seconds | Saturation percentage |
|---|---|---|---|
| A | 5521 | 37 | 0.670168% |
| B | 5521 | 1154 | 20.902011% |
| C | 5521 | 239 | 4.328926% |
| D | 5521 | 139 | 2.517660% |
Noise dominated data is calculated using 1-second bins in cleaned event files. If a bin has >2000 counts, and if more than 50% of those come from <1% of pixels, then it is considered to be noise-dominated and hence unusable.
| Quadrant | # 1 sec bins | Bins with >0 counts | Bins with >2000 counts | High rate bins dominated by noise | Noise dominated (total time) | Noise dominated (detector-on time) | Marked lightcurve |
|---|---|---|---|---|---|---|---|
| A | 7164 | 5522 | 19 | 19 | 0.27% | 0.34% | 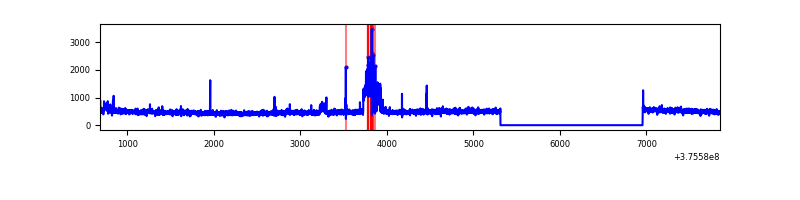 |
| B | 7164 | 5522 | 751 | 751 | 10.48% | 13.60% | 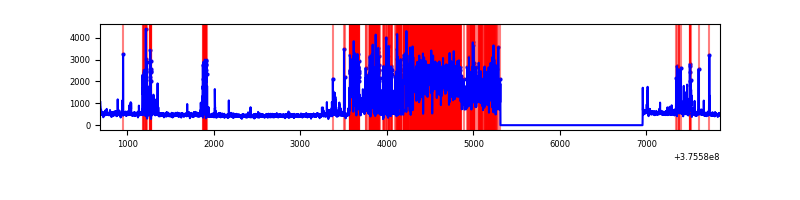 |
| C | 7164 | 5522 | 193 | 193 | 2.69% | 3.50% | 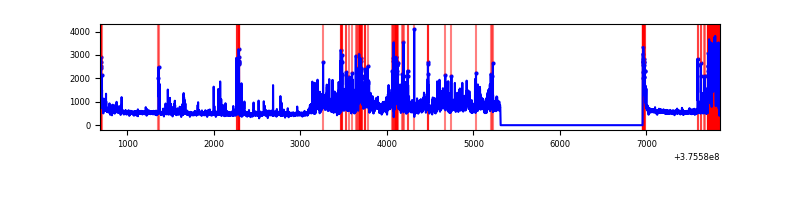 |
| D | 7164 | 5522 | 121 | 121 | 1.69% | 2.19% | 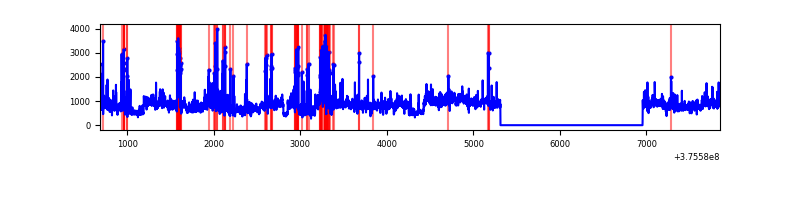 |
Top three noisy pixels from each quadrant. If the there are fewer than three noisy pixels in the level2.evt file, extra rows are filled as -1
| Pixel properties | Quadrant properties | ||||||
|---|---|---|---|---|---|---|---|
| Quadrant | DetID | PixID | Counts | Sigma | Mean | Median | Sigma |
| A | 15 | 169 | 204224 | 1507.88 | 667 | 653 | 135.0 |
| A | 15 | 174 | 14799 | 104.78 | 667 | 653 | 135.0 |
| A | 13 | 6 | 10235 | 70.98 | 667 | 653 | 135.0 |
| B | 0 | 219 | 1441668 | 12205.93 | 608 | 591 | 118.1 |
| B | 5 | 172 | 1124883 | 9522.76 | 608 | 591 | 118.1 |
| B | 5 | 200 | 93294 | 785.2 | 608 | 591 | 118.1 |
| C | 10 | 49 | 1102774 | 7520.28 | 633 | 638 | 146.6 |
| C | 1 | 23 | 387738 | 2641.33 | 633 | 638 | 146.6 |
| C | 15 | 214 | 254544 | 1732.49 | 633 | 638 | 146.6 |
| D | 8 | 195 | 1691491 | 9935.34 | 630 | 616 | 170.2 |
| D | 13 | 249 | 309645 | 1815.81 | 630 | 616 | 170.2 |
| D | 2 | 250 | 273820 | 1605.31 | 630 | 616 | 170.2 |
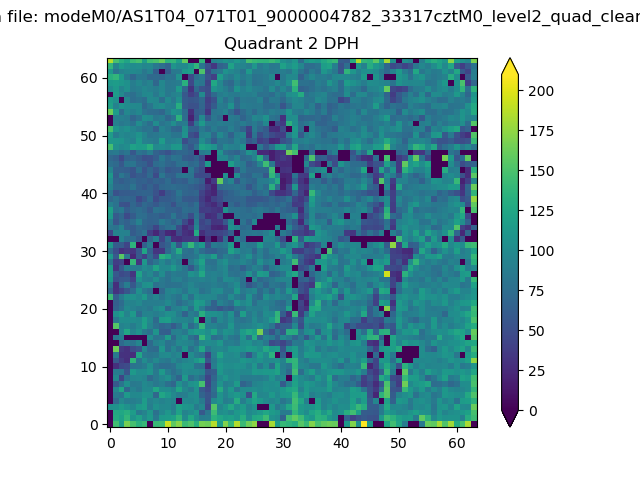
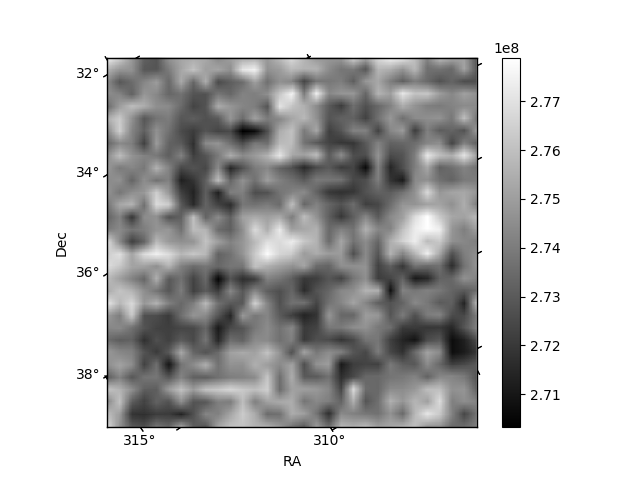
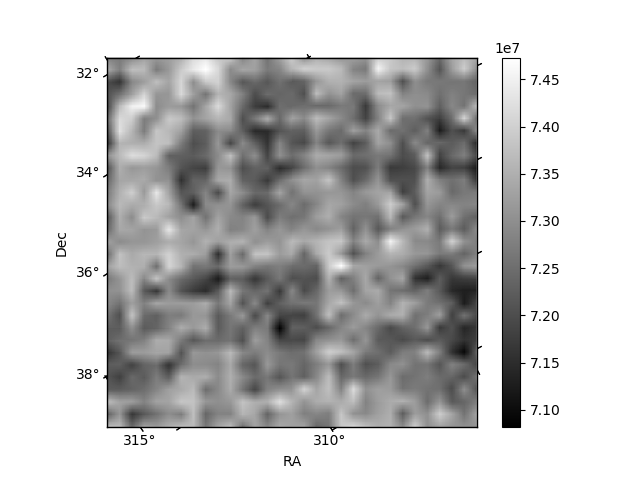
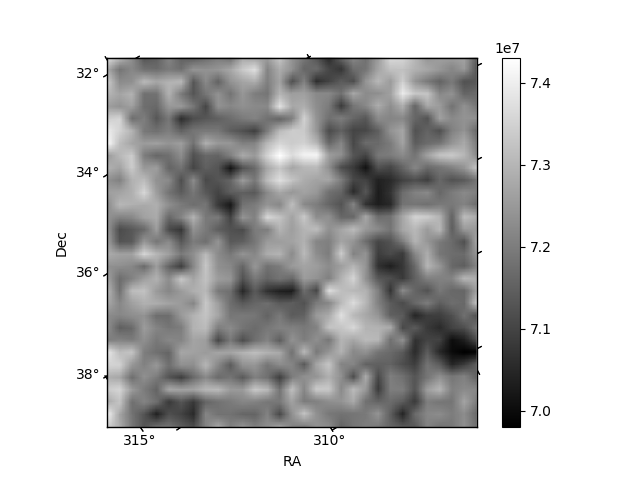
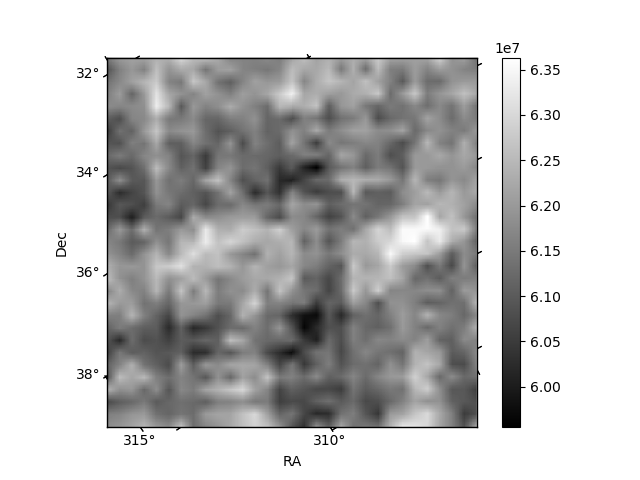
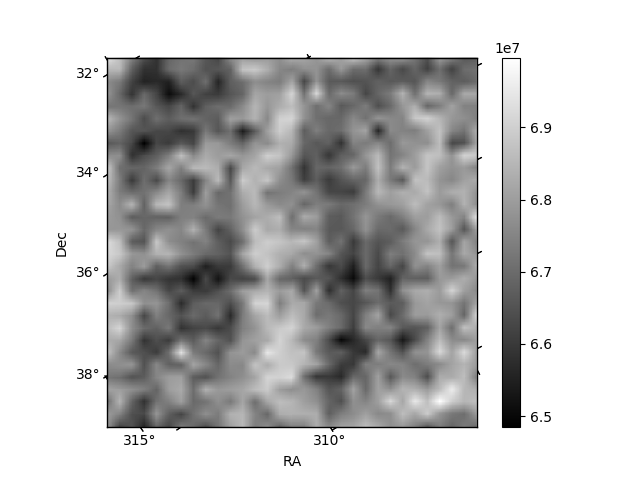
Histogram calculated using DETX and DETY for each event in the final _common_clean file
| Quadrant A | 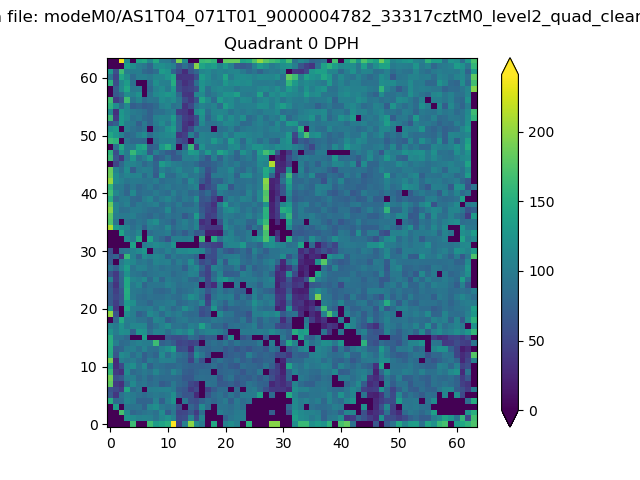 |
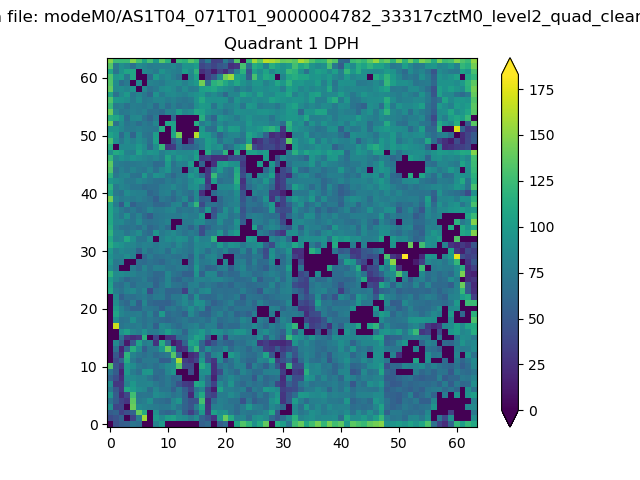 |
Quadrant B |
|---|---|---|---|
| Quadrant D | 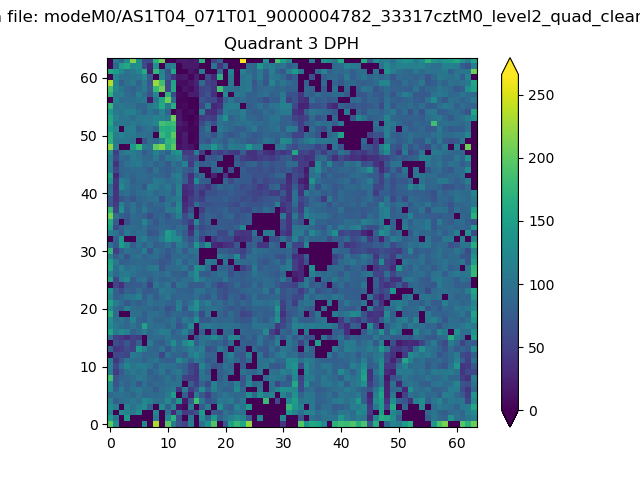 |
 |
Quadrant C |
| Plot type | Count rate plots | Images |
|---|---|---|
| Comparison with Poisson distribution Blue bars denote a histogram of data divided into 1 sec bins. Red curve is a Poisson curve with rate = median count rate of data. |
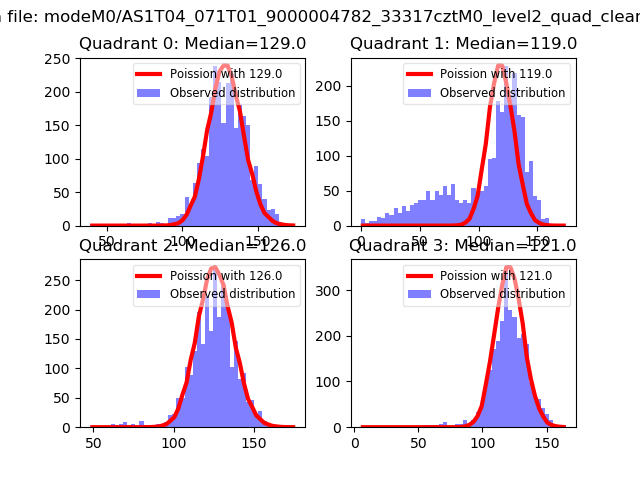 |
 |
| Quadrant-wise count rates Data is divided into 100 sec bins |
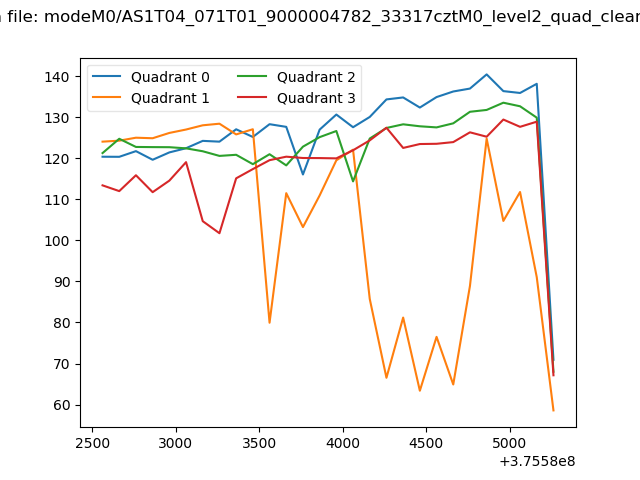 |
|
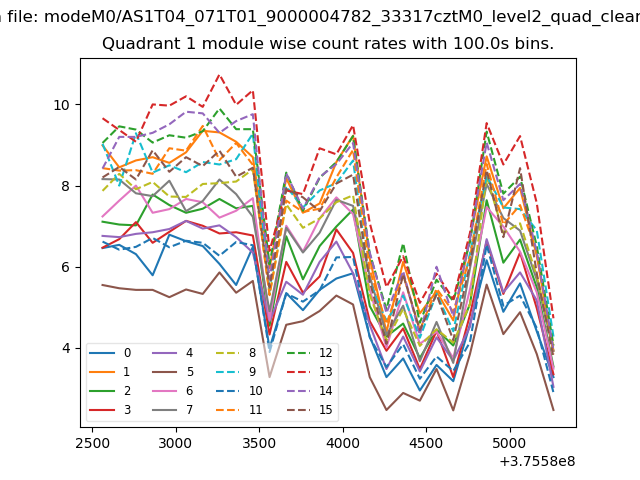
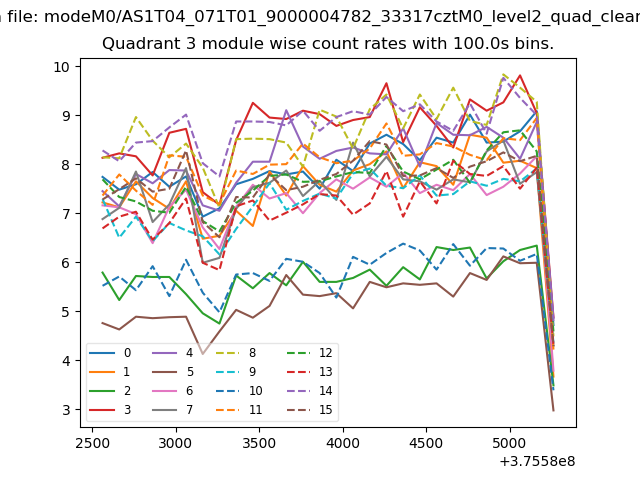
| Module-wise count rates for Quadrant A Data is divided into 100 sec bins |
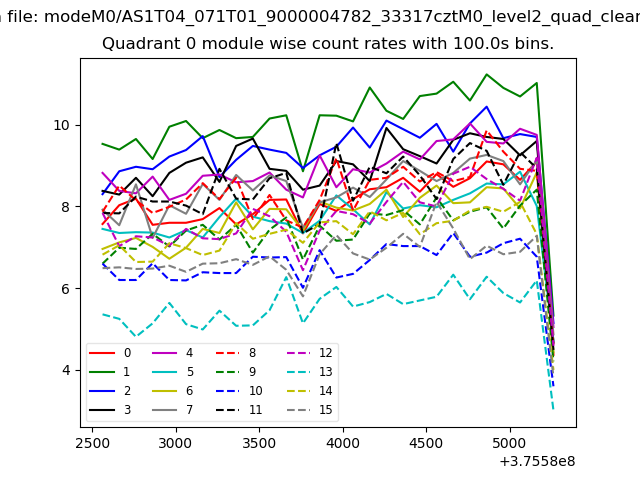 |
 |
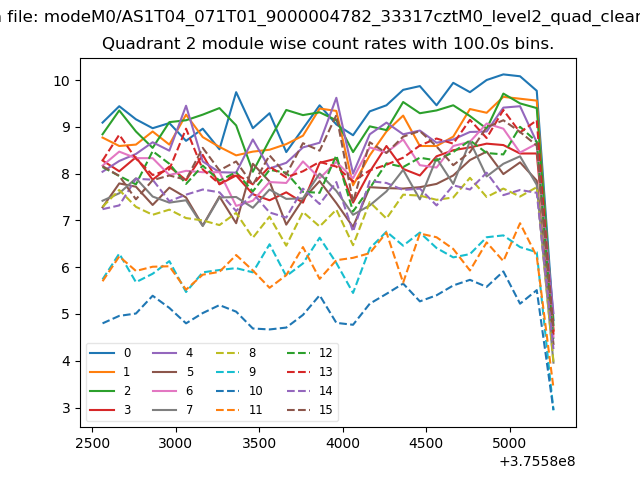
| Module-wise count rates for Quadrant B Data is divided into 100 sec bins |
 |
 |
| Module-wise count rates for Quadrant C Data is divided into 100 sec bins |
 |
 |
| Module-wise count rates for Quadrant D Data is divided into 100 sec bins |
 |
 |
| Parameter | Plot |
|---|---|
| CZT HV Monitor | 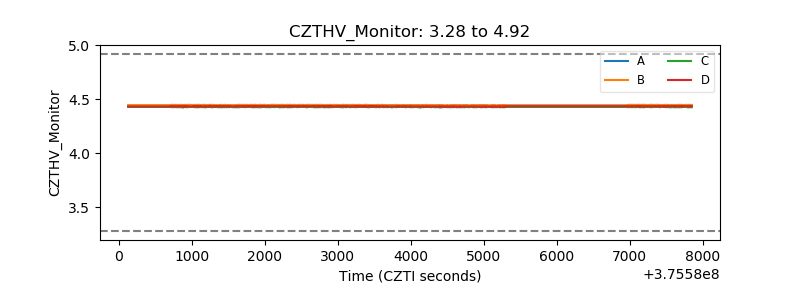 |
| D_VDD | 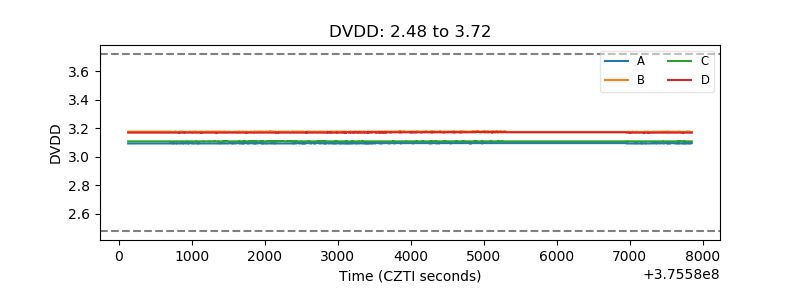 |
| Temperature 1 | 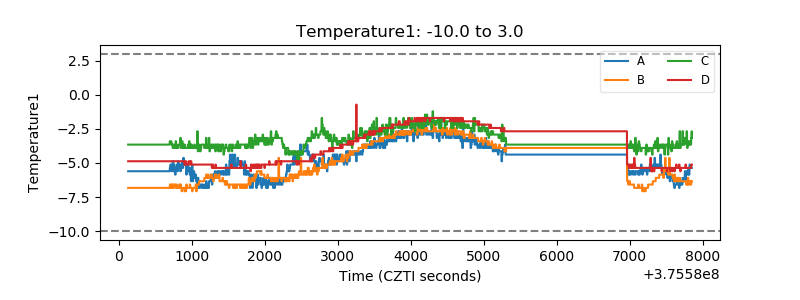 |
| Veto HV Monitor | 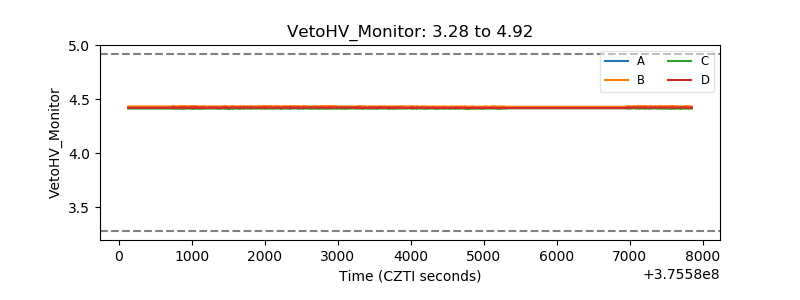 |
| Veto LLD | 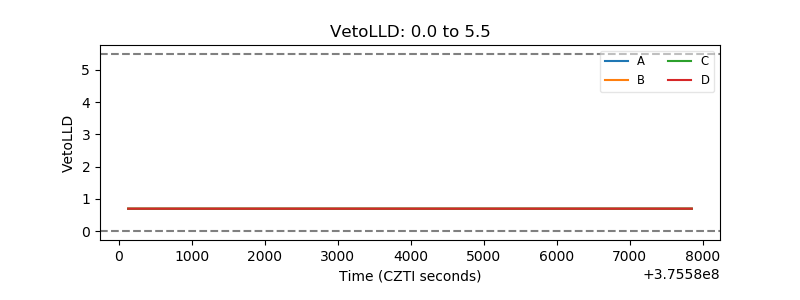 |
| Alpha Counter | 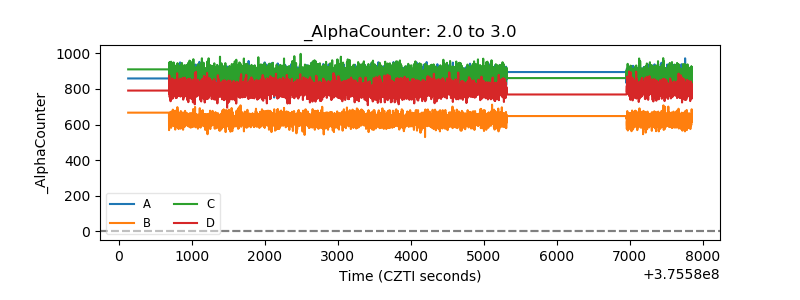 |
| _CPM_Rate | 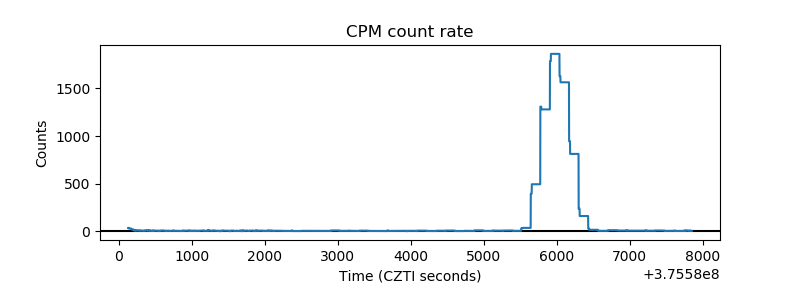 |
| CZT Counter | 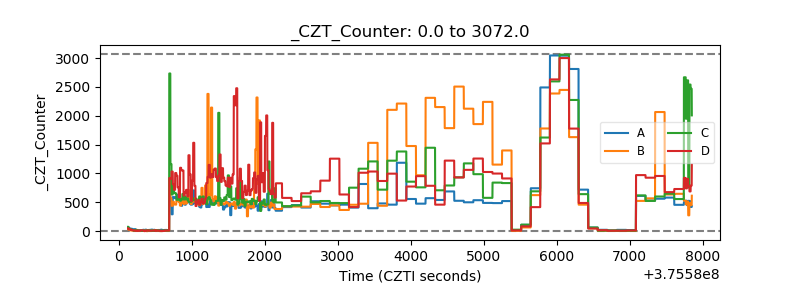 |
| +2.5 Volts monitor |  |
| +5 Volts monitor |  |
| _ROLL_ROT | 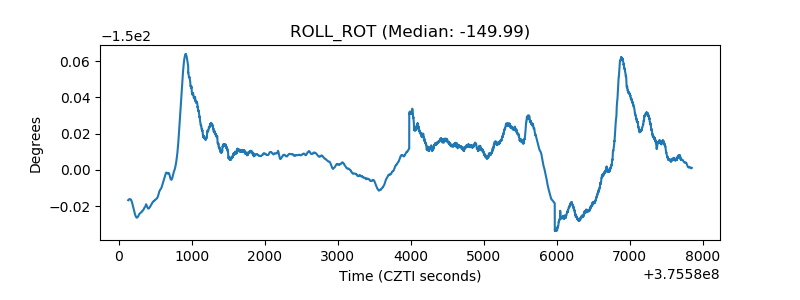 |
| _Roll_DEC | 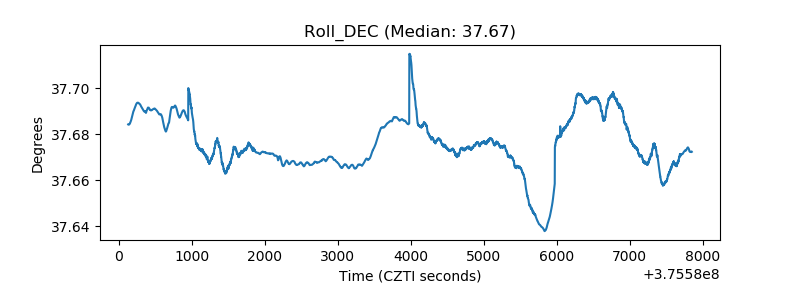 |
| _Roll_RA |  |
| Veto Counter | 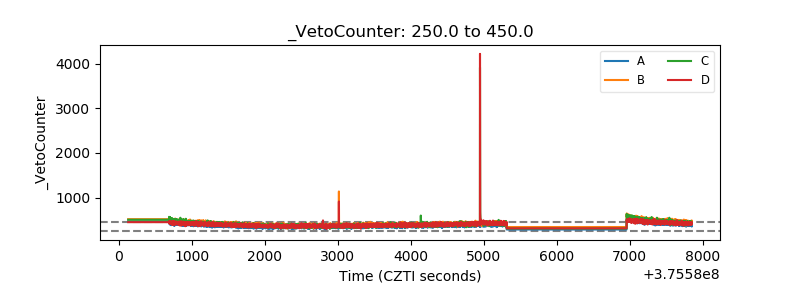 |