| Param | Original file | Final file |
|---|---|---|
| Filename | modeM0/AS1T04_071T01_9000004782_33319cztM0_level2.evt | modeM0/AS1T04_071T01_9000004782_33319cztM0_level2_quad_clean.evt |
| Size (bytes) | 595,825,920 | 62,078,400 |
| Size | 568.2 MB | 59.2 MB |
| Events in quadrant A | 3,115,079 | 398,916 |
| Events in quadrant B | 4,914,609 | 357,616 |
| Events in quadrant C | 5,648,312 | 374,032 |
| Events in quadrant D | 4,003,745 | 373,110 |
| Mode M0 | |||
|---|---|---|---|
| Quadrant | BADHDUFLAG | Total packets | Discarded packets |
| A | 0 | 12544 | 2 |
| B | 0 | 18089 | 1 |
| C | 0 | 20491 | 1 |
| D | 0 | 15815 | 1 |
| Mode SS | |||
|---|---|---|---|
| Quadrant | BADHDUFLAG | Total packets | Discarded packets |
| A | 0 | 108 | 0 |
| B | 0 | 108 | 0 |
| C | 0 | 108 | 0 |
| D | 0 | 108 | 0 |
| Mode M9 | |||
|---|---|---|---|
| Quadrant | BADHDUFLAG | Total packets | Discarded packets |
| A | 0 | 30 | 0 |
| B | 0 | 30 | 0 |
| C | 0 | 30 | 0 |
| D | 0 | 31 | 0 |
| Quadrant | Total seconds | Saturated seconds | Saturation percentage |
|---|---|---|---|
| A | 5369 | 169 | 3.147700% |
| B | 5369 | 879 | 16.371764% |
| C | 5369 | 686 | 12.777053% |
| D | 5369 | 140 | 2.607562% |
Noise dominated data is calculated using 1-second bins in cleaned event files. If a bin has >2000 counts, and if more than 50% of those come from <1% of pixels, then it is considered to be noise-dominated and hence unusable.
| Quadrant | # 1 sec bins | Bins with >0 counts | Bins with >2000 counts | High rate bins dominated by noise | Noise dominated (total time) | Noise dominated (detector-on time) | Marked lightcurve |
|---|---|---|---|---|---|---|---|
| A | 7163 | 5370 | 128 | 128 | 1.79% | 2.38% | 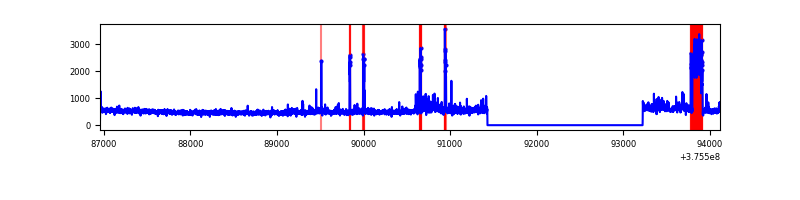 |
| B | 7163 | 5370 | 670 | 670 | 9.35% | 12.48% | 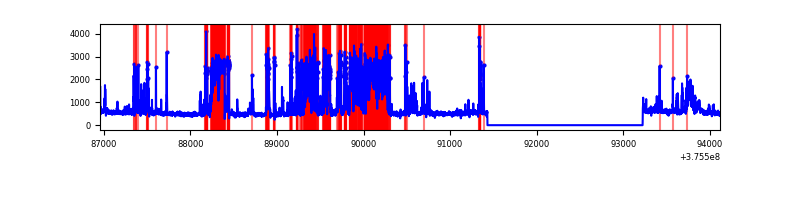 |
| C | 7163 | 5370 | 596 | 596 | 8.32% | 11.10% | 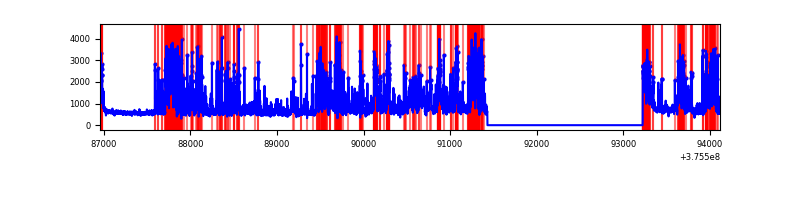 |
| D | 7163 | 5370 | 120 | 120 | 1.68% | 2.23% | 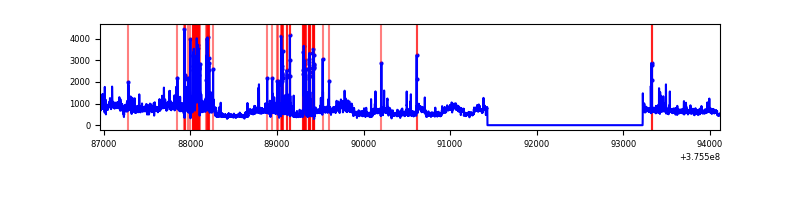 |
Top three noisy pixels from each quadrant. If the there are fewer than three noisy pixels in the level2.evt file, extra rows are filled as -1
| Pixel properties | Quadrant properties | ||||||
|---|---|---|---|---|---|---|---|
| Quadrant | DetID | PixID | Counts | Sigma | Mean | Median | Sigma |
| A | 15 | 169 | 548290 | 4157.56 | 660 | 647 | 131.7 |
| A | 13 | 6 | 9813 | 69.59 | 660 | 647 | 131.7 |
| A | 13 | 254 | 8192 | 57.28 | 660 | 647 | 131.7 |
| B | 5 | 172 | 1246718 | 10536.64 | 619 | 604 | 118.3 |
| B | 0 | 219 | 620050 | 5237.79 | 619 | 604 | 118.3 |
| B | 5 | 200 | 464975 | 3926.53 | 619 | 604 | 118.3 |
| C | 1 | 23 | 2384780 | 16889.27 | 611 | 616 | 141.2 |
| C | 10 | 49 | 496589 | 3513.44 | 611 | 616 | 141.2 |
| C | 15 | 214 | 238604 | 1685.89 | 611 | 616 | 141.2 |
| D | 8 | 195 | 942577 | 6053.78 | 636 | 619 | 155.6 |
| D | 2 | 250 | 249000 | 1596.3 | 636 | 619 | 155.6 |
| D | 13 | 249 | 197369 | 1264.47 | 636 | 619 | 155.6 |
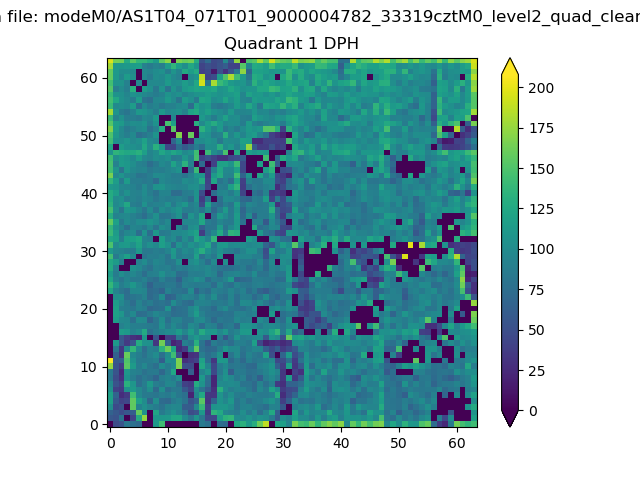
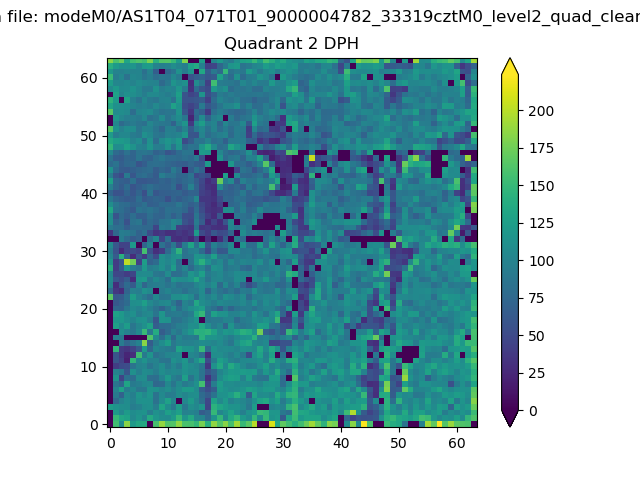
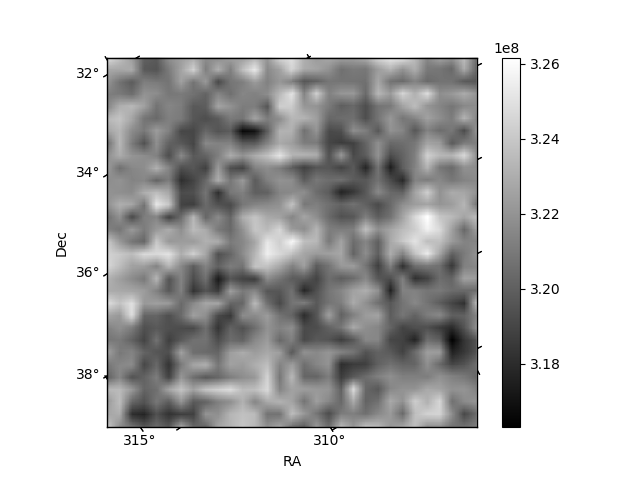
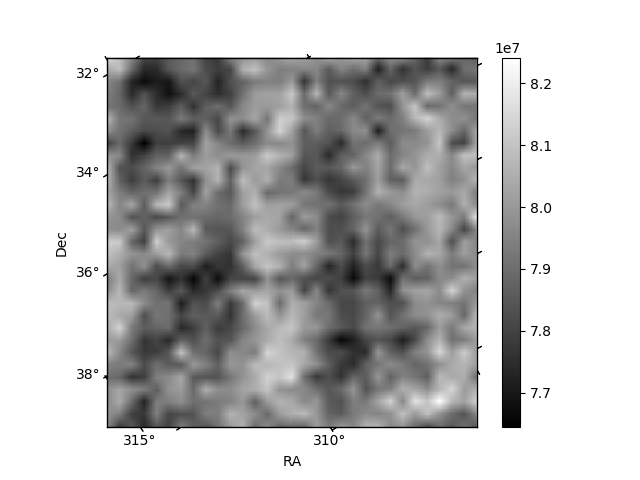
Histogram calculated using DETX and DETY for each event in the final _common_clean file
| Quadrant A |  |
 |
Quadrant B |
|---|---|---|---|
| Quadrant D | 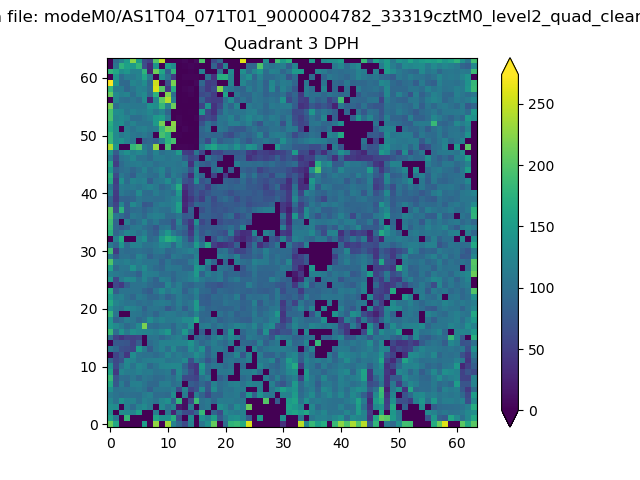 |
 |
Quadrant C |
| Plot type | Count rate plots | Images |
|---|---|---|
| Comparison with Poisson distribution Blue bars denote a histogram of data divided into 1 sec bins. Red curve is a Poisson curve with rate = median count rate of data. |
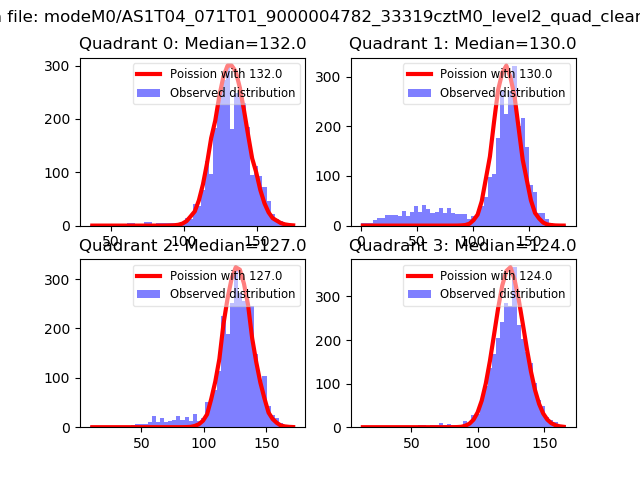 |
 |
| Quadrant-wise count rates Data is divided into 100 sec bins |
 |
|
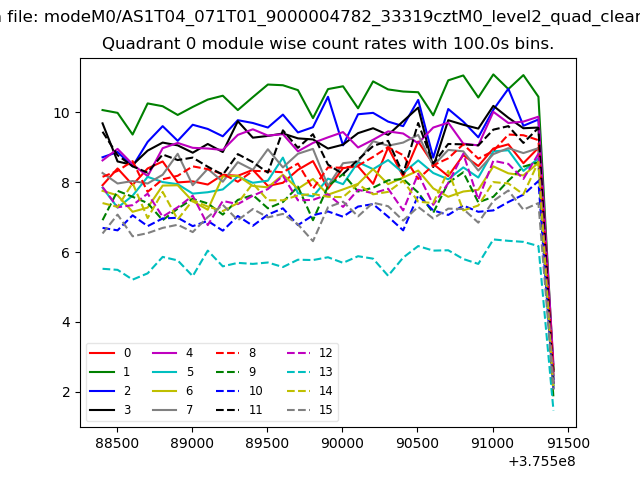
| Module-wise count rates for Quadrant A Data is divided into 100 sec bins |
 |
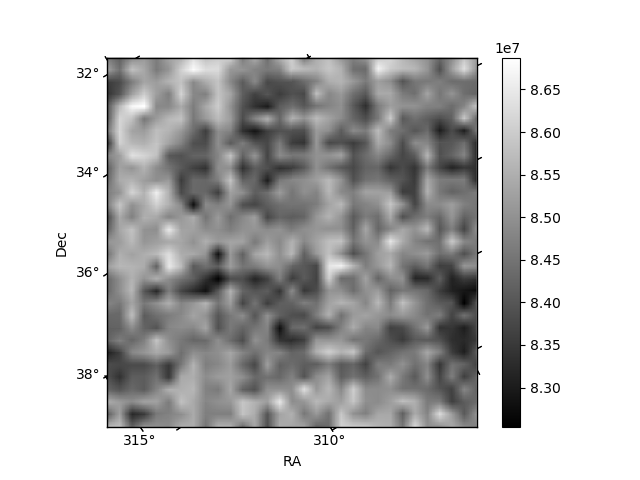 |
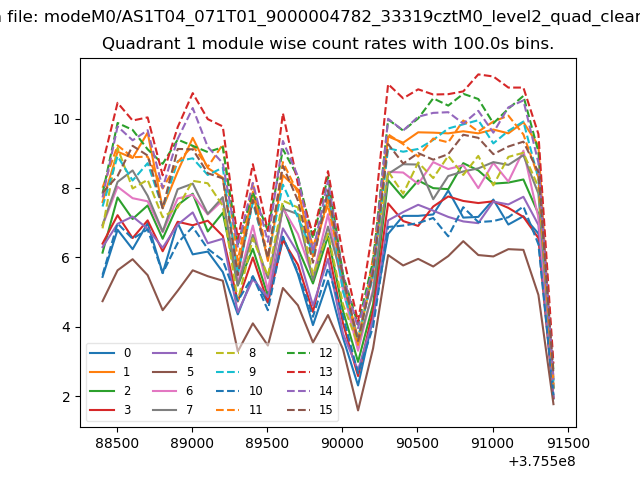
| Module-wise count rates for Quadrant B Data is divided into 100 sec bins |
 |
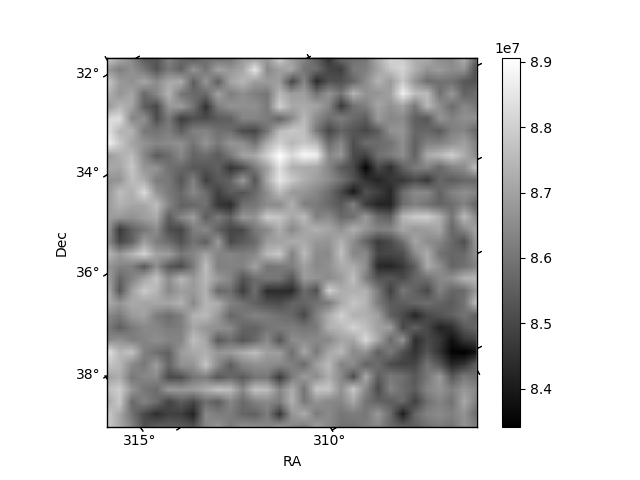 |
| Module-wise count rates for Quadrant C Data is divided into 100 sec bins |
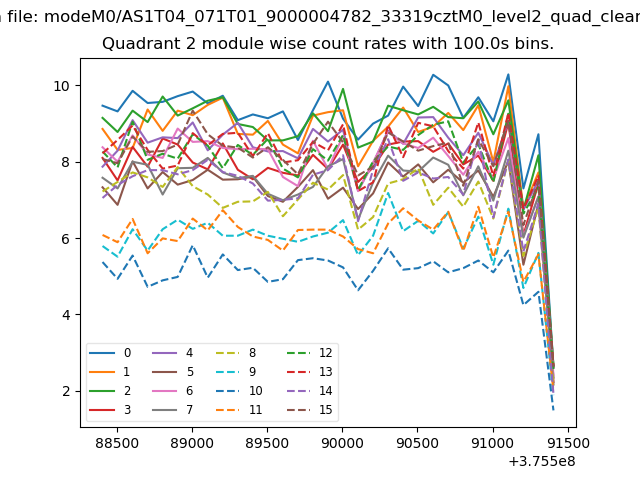 |
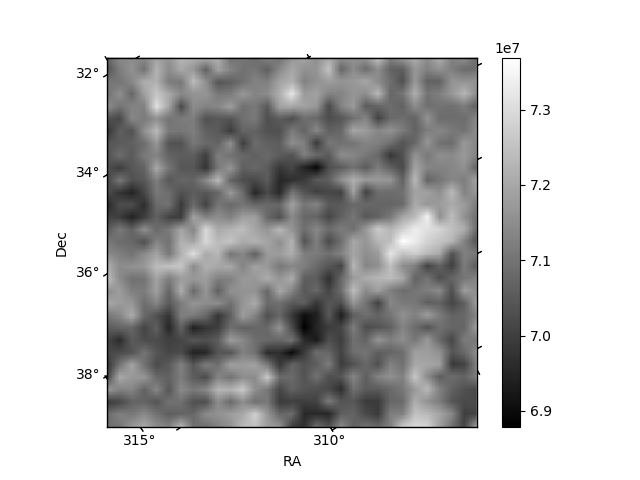 |
| Module-wise count rates for Quadrant D Data is divided into 100 sec bins |
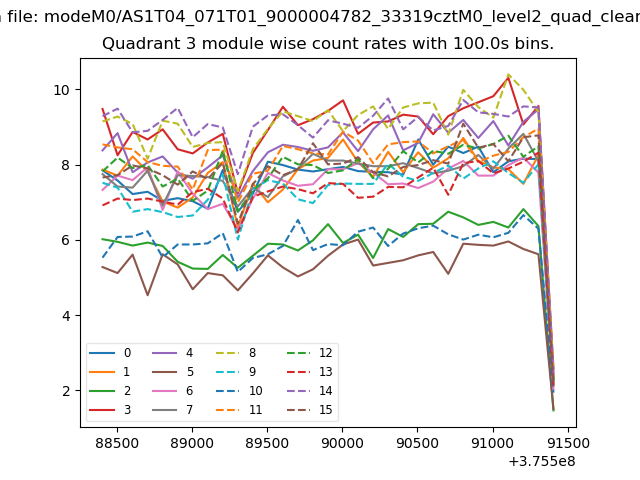 |
 |
| Parameter | Plot |
|---|---|
| CZT HV Monitor | 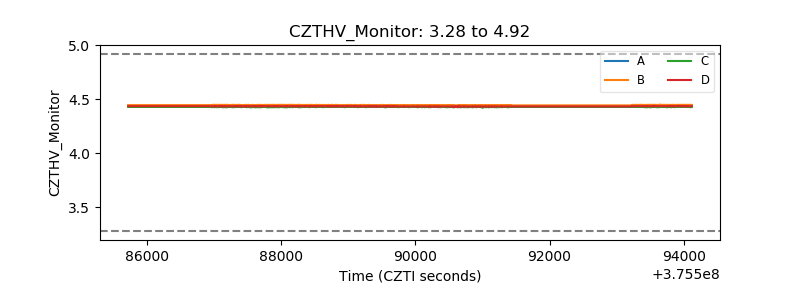 |
| D_VDD | 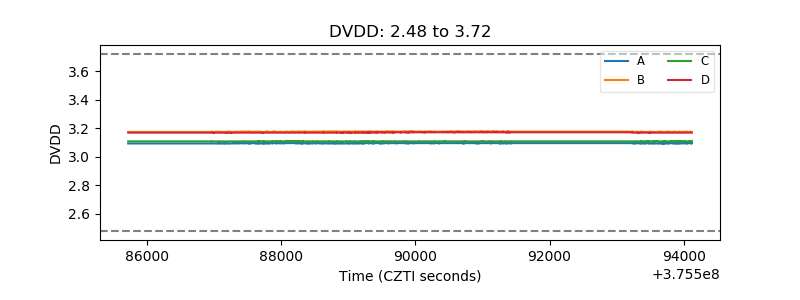 |
| Temperature 1 | 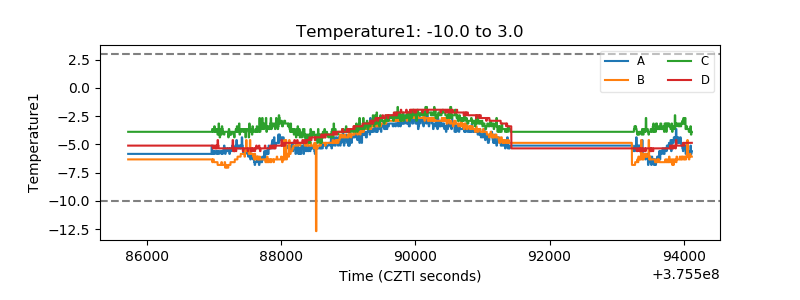 |
| Veto HV Monitor | 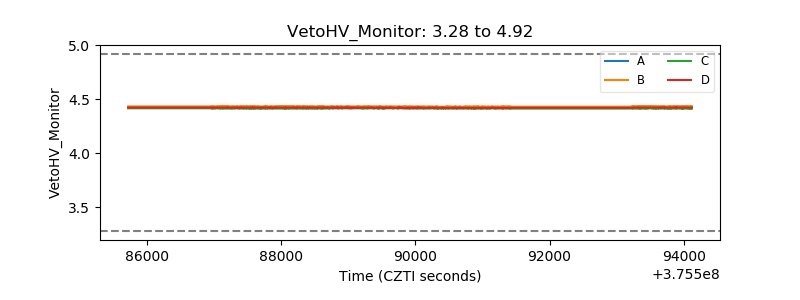 |
| Veto LLD | 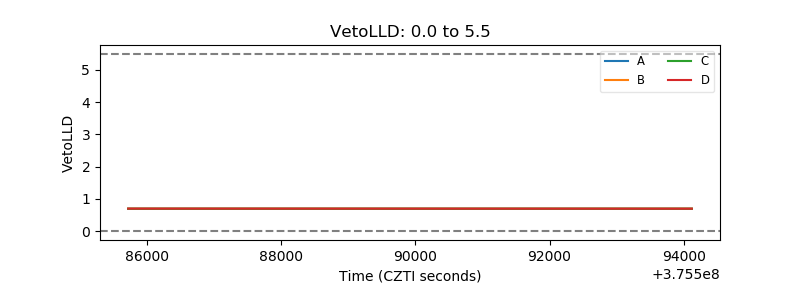 |
| Alpha Counter | 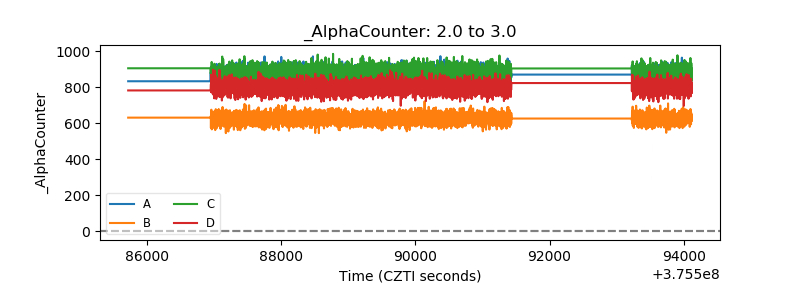 |
| _CPM_Rate |  |
| CZT Counter | 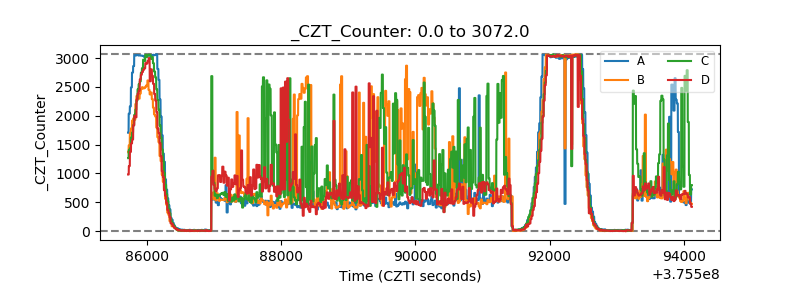 |
| +2.5 Volts monitor |  |
| +5 Volts monitor |  |
| _ROLL_ROT | 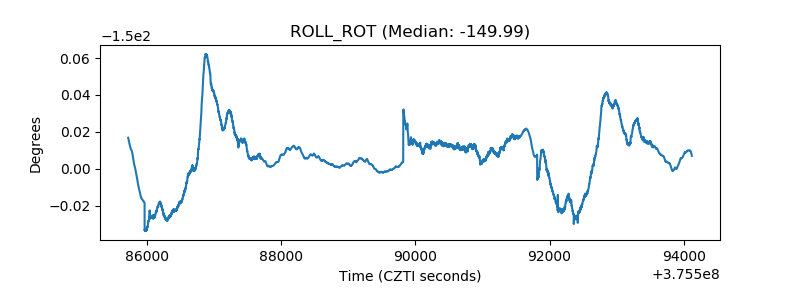 |
| _Roll_DEC | 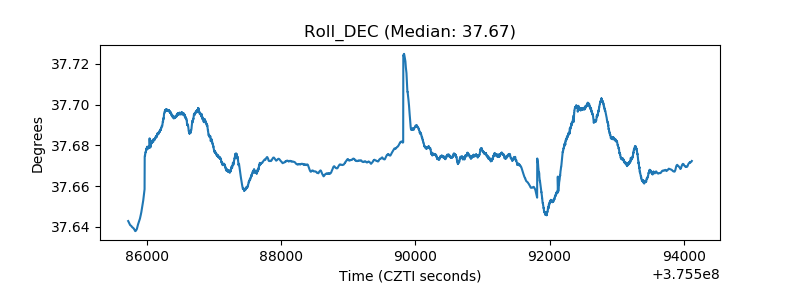 |
| _Roll_RA | 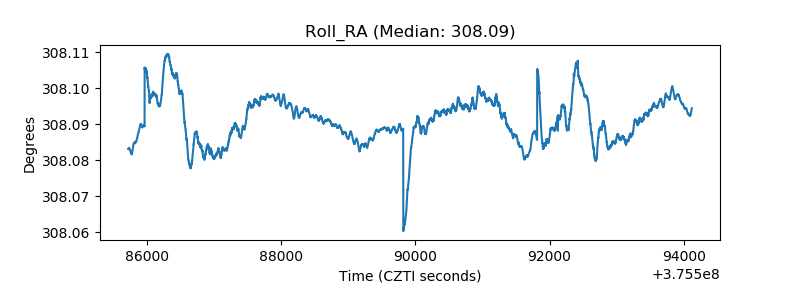 |
| Veto Counter | 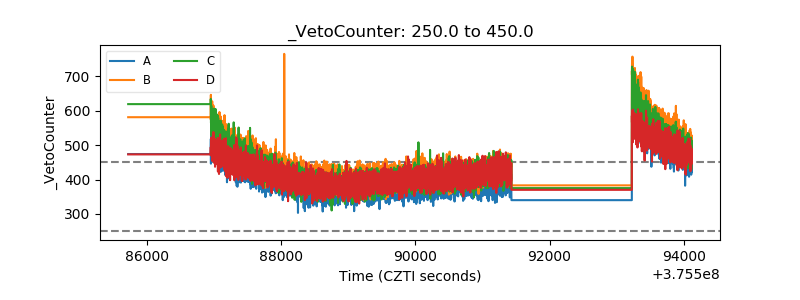 |