| Param | Original file | Final file |
|---|---|---|
| Filename | modeM0/AS1T04_071T01_9000004782_33320cztM0_level2.evt | modeM0/AS1T04_071T01_9000004782_33320cztM0_level2_quad_clean.evt |
| Size (bytes) | 562,705,920 | 76,040,640 |
| Size | 536.6 MB | 72.5 MB |
| Events in quadrant A | 4,007,473 | 500,330 |
| Events in quadrant B | 4,097,397 | 483,042 |
| Events in quadrant C | 4,959,390 | 483,220 |
| Events in quadrant D | 3,625,887 | 471,794 |
| Mode M0 | |||
|---|---|---|---|
| Quadrant | BADHDUFLAG | Total packets | Discarded packets |
| A | 0 | 15246 | 2 |
| B | 0 | 15557 | 1 |
| C | 0 | 18358 | 1 |
| D | 0 | 14750 | 1 |
| Mode SS | |||
|---|---|---|---|
| Quadrant | BADHDUFLAG | Total packets | Discarded packets |
| A | 0 | 106 | 0 |
| B | 0 | 106 | 0 |
| C | 0 | 106 | 0 |
| D | 0 | 106 | 0 |
| Mode M9 | |||
|---|---|---|---|
| Quadrant | BADHDUFLAG | Total packets | Discarded packets |
| A | 0 | 27 | 0 |
| B | 0 | 27 | 0 |
| C | 0 | 27 | 0 |
| D | 0 | 28 | 0 |
| Quadrant | Total seconds | Saturated seconds | Saturation percentage |
|---|---|---|---|
| A | 5197 | 420 | 8.081586% |
| B | 5197 | 482 | 9.274581% |
| C | 5197 | 514 | 9.890321% |
| D | 5197 | 51 | 0.981335% |
Noise dominated data is calculated using 1-second bins in cleaned event files. If a bin has >2000 counts, and if more than 50% of those come from <1% of pixels, then it is considered to be noise-dominated and hence unusable.
| Quadrant | # 1 sec bins | Bins with >0 counts | Bins with >2000 counts | High rate bins dominated by noise | Noise dominated (total time) | Noise dominated (detector-on time) | Marked lightcurve |
|---|---|---|---|---|---|---|---|
| A | 7110 | 5198 | 272 | 272 | 3.83% | 5.23% | 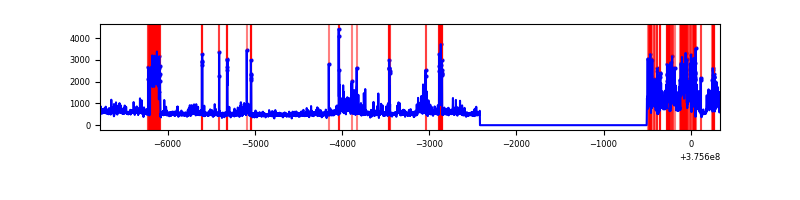 |
| B | 7110 | 5198 | 354 | 354 | 4.98% | 6.81% | 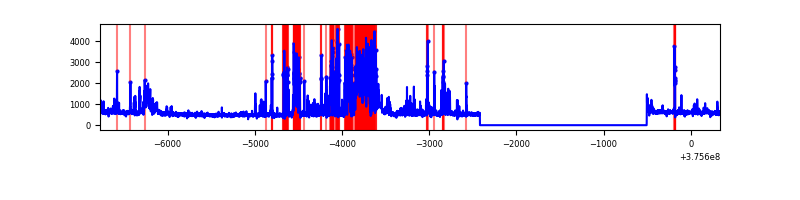 |
| C | 7110 | 5198 | 442 | 442 | 6.22% | 8.50% | 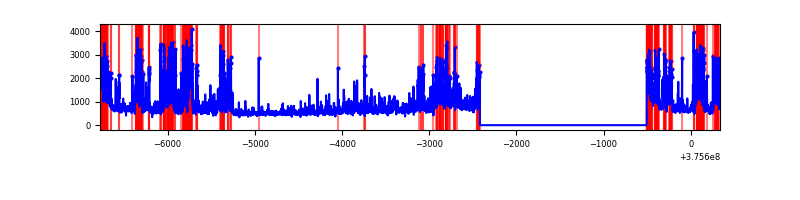 |
| D | 7110 | 5198 | 35 | 35 | 0.49% | 0.67% | 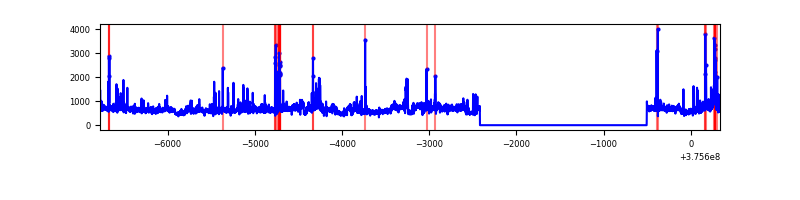 |
Top three noisy pixels from each quadrant. If the there are fewer than three noisy pixels in the level2.evt file, extra rows are filled as -1
| Pixel properties | Quadrant properties | ||||||
|---|---|---|---|---|---|---|---|
| Quadrant | DetID | PixID | Counts | Sigma | Mean | Median | Sigma |
| A | 15 | 169 | 1445034 | 11085.73 | 658 | 646 | 130.3 |
| A | 3 | 252 | 9172 | 65.43 | 658 | 646 | 130.3 |
| A | 13 | 6 | 7196 | 50.27 | 658 | 646 | 130.3 |
| B | 0 | 219 | 788993 | 6402.65 | 650 | 635 | 123.1 |
| B | 5 | 172 | 512152 | 4154.29 | 650 | 635 | 123.1 |
| B | 5 | 200 | 139223 | 1125.54 | 650 | 635 | 123.1 |
| C | 1 | 23 | 1538845 | 10717.71 | 623 | 628 | 143.5 |
| C | 10 | 49 | 562662 | 3916.04 | 623 | 628 | 143.5 |
| C | 15 | 214 | 237589 | 1651.05 | 623 | 628 | 143.5 |
| D | 8 | 195 | 753471 | 4759.8 | 648 | 631 | 158.2 |
| D | 2 | 250 | 212038 | 1336.61 | 648 | 631 | 158.2 |
| D | 13 | 249 | 54648 | 341.52 | 648 | 631 | 158.2 |
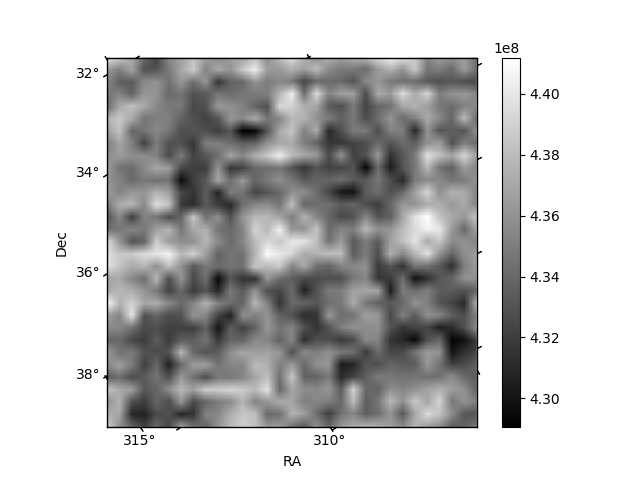
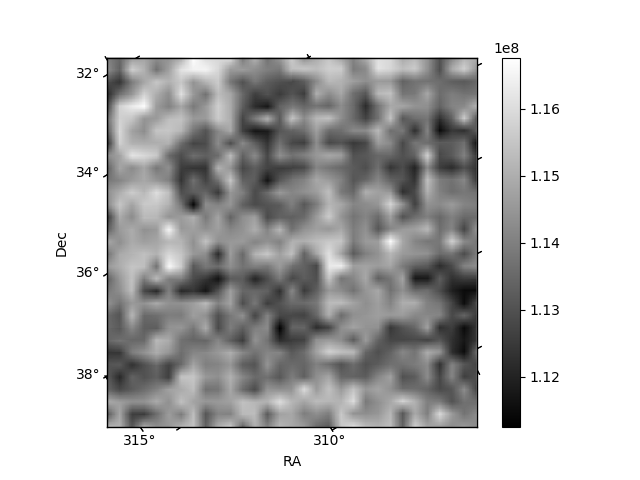
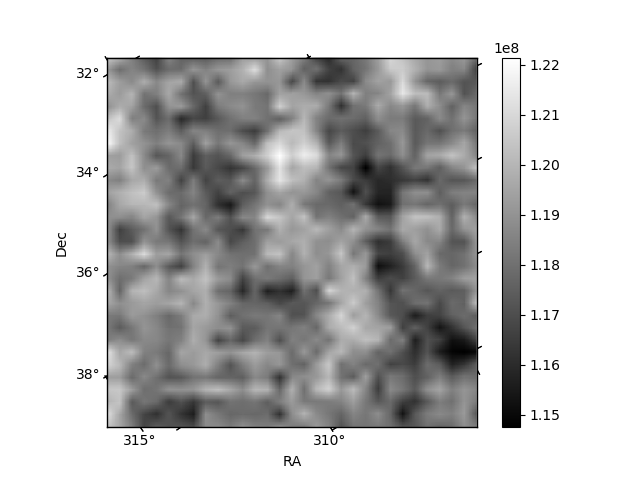
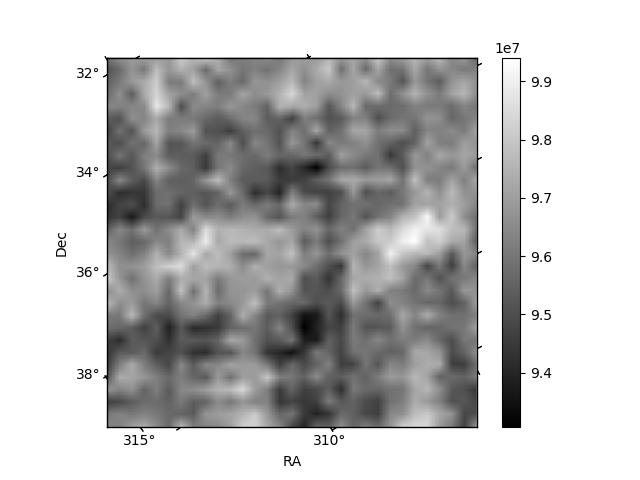
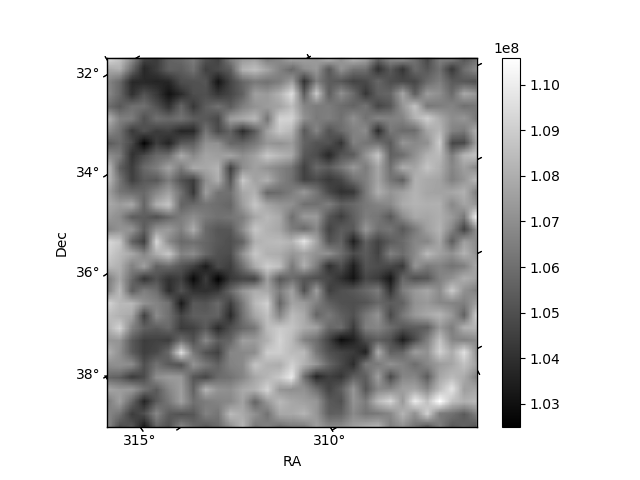
Histogram calculated using DETX and DETY for each event in the final _common_clean file
| Quadrant A | 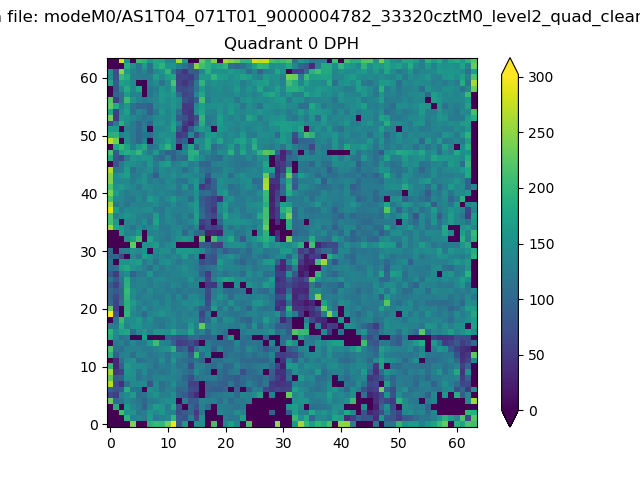 |
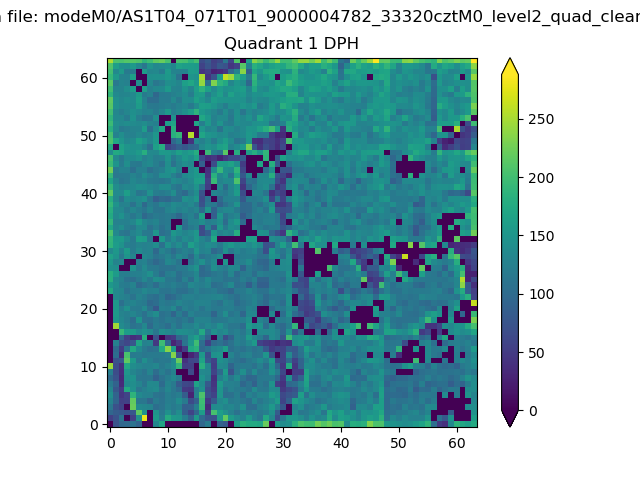 |
Quadrant B |
|---|---|---|---|
| Quadrant D | 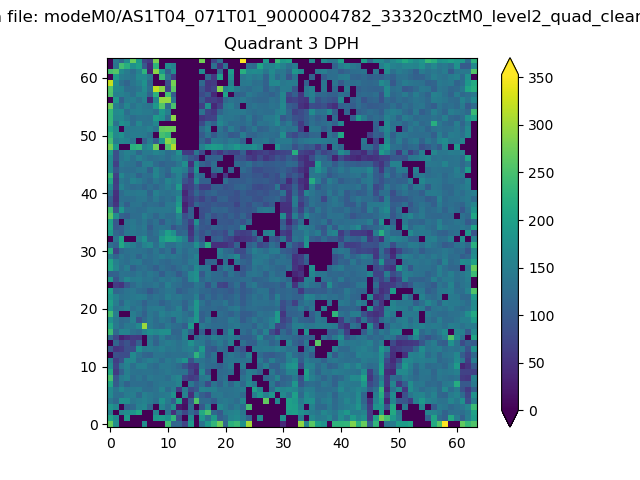 |
 |
Quadrant C |
| Plot type | Count rate plots | Images |
|---|---|---|
| Comparison with Poisson distribution Blue bars denote a histogram of data divided into 1 sec bins. Red curve is a Poisson curve with rate = median count rate of data. |
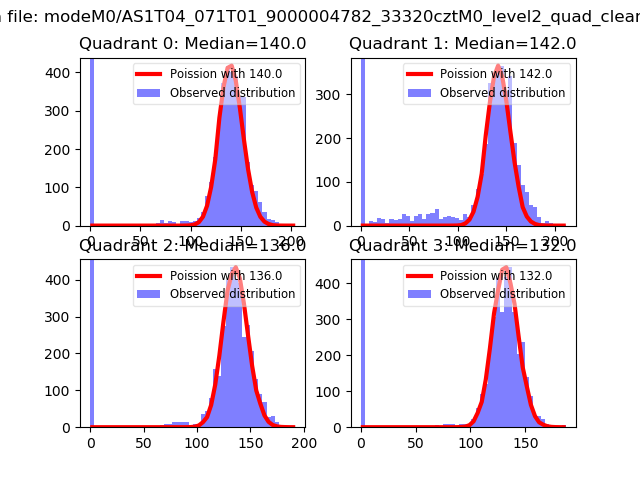 |
 |
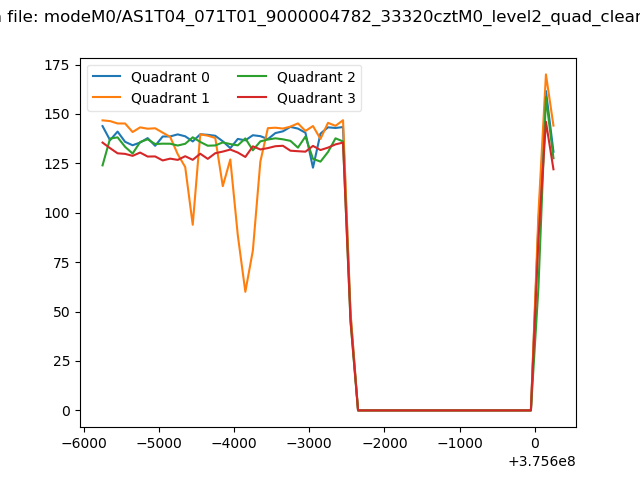
| Quadrant-wise count rates Data is divided into 100 sec bins |
 |
|
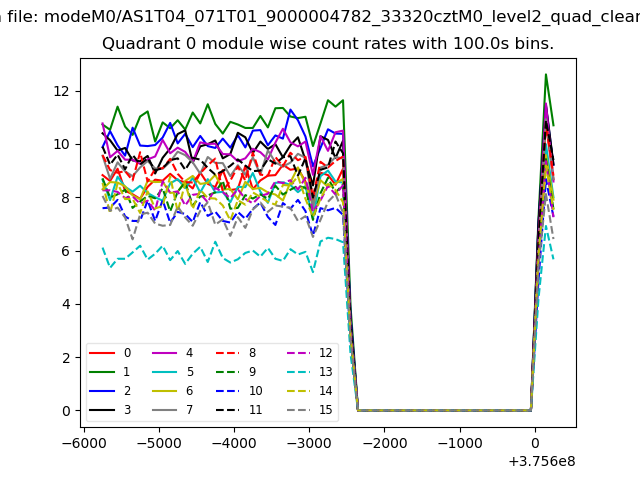
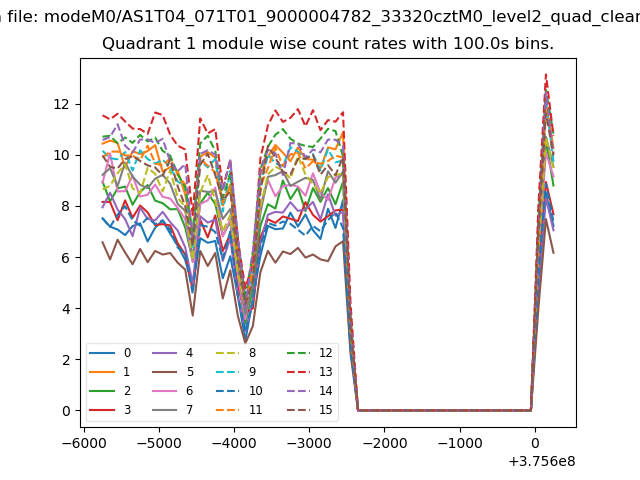
| Module-wise count rates for Quadrant A Data is divided into 100 sec bins |
 |
 |
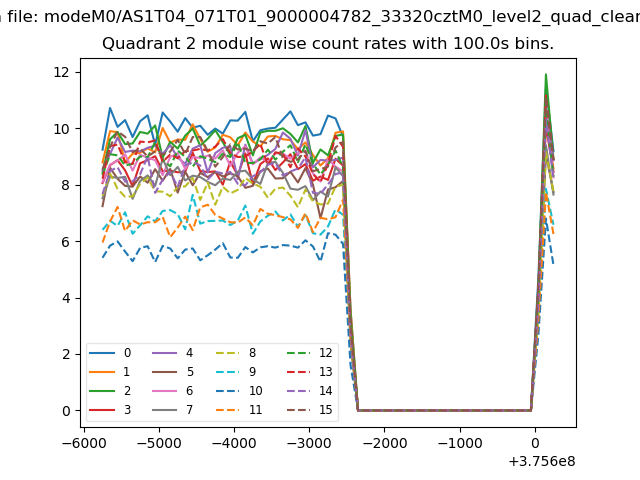
| Module-wise count rates for Quadrant B Data is divided into 100 sec bins |
 |
 |
| Module-wise count rates for Quadrant C Data is divided into 100 sec bins |
 |
 |
| Module-wise count rates for Quadrant D Data is divided into 100 sec bins |
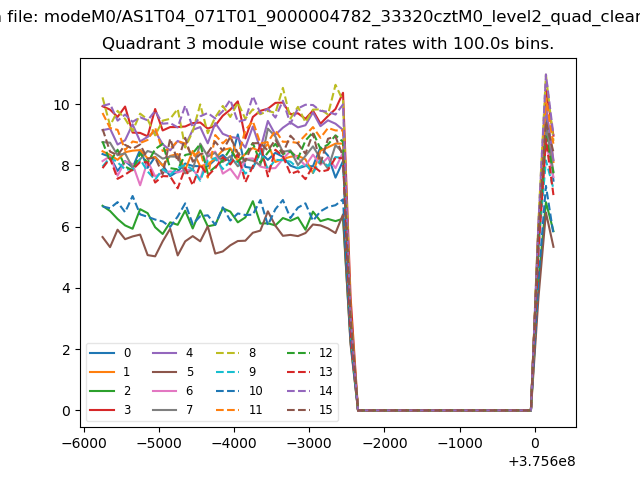 |
 |
| Parameter | Plot |
|---|---|
| CZT HV Monitor | 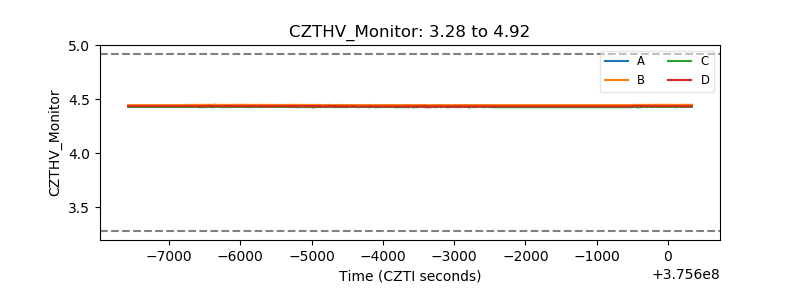 |
| D_VDD | 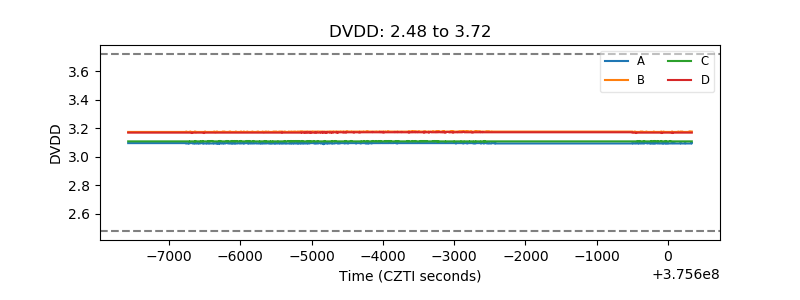 |
| Temperature 1 | 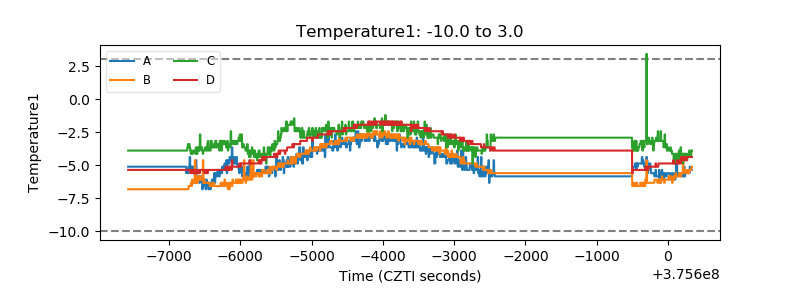 |
| Veto HV Monitor | 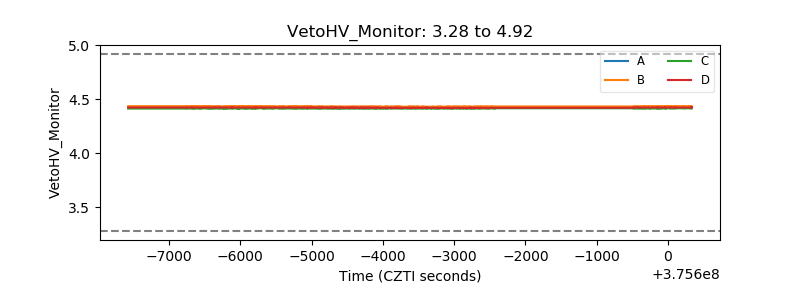 |
| Veto LLD | 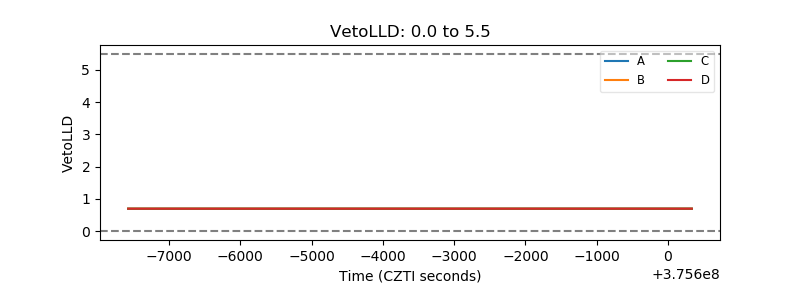 |
| Alpha Counter | 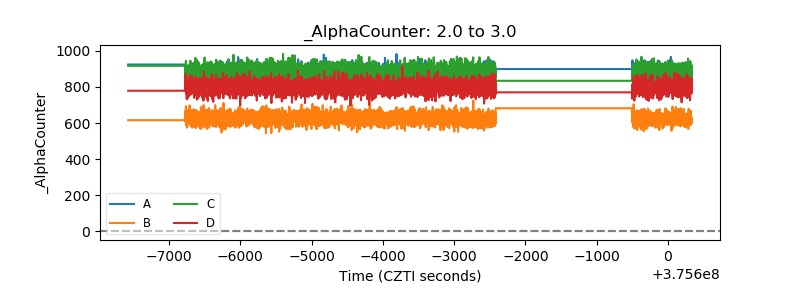 |
| _CPM_Rate | 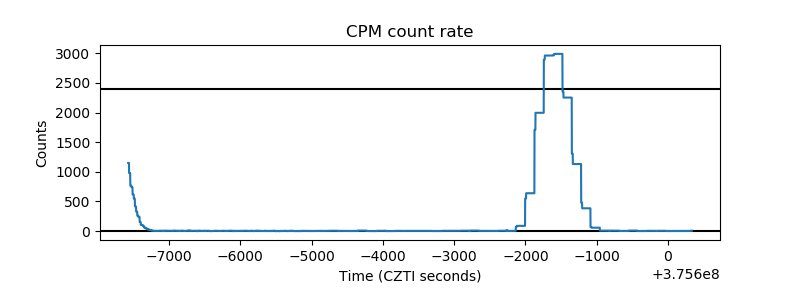 |
| CZT Counter | 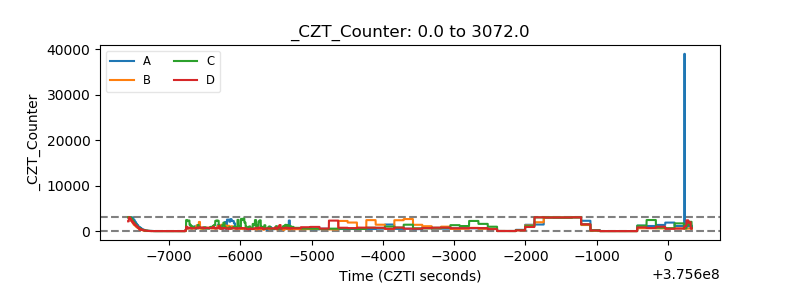 |
| +2.5 Volts monitor |  |
| +5 Volts monitor |  |
| _ROLL_ROT | 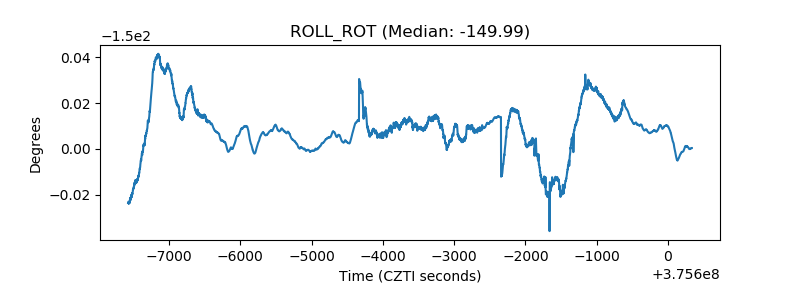 |
| _Roll_DEC |  |
| _Roll_RA | 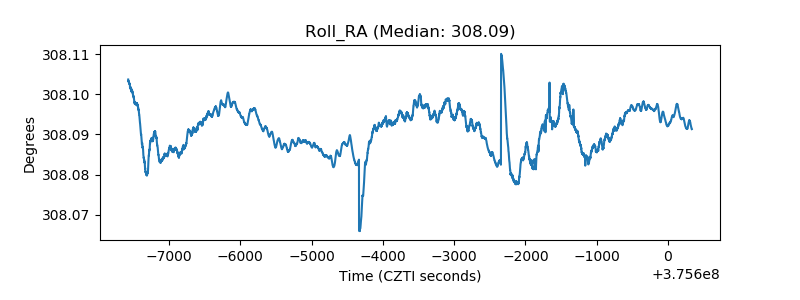 |
| Veto Counter | 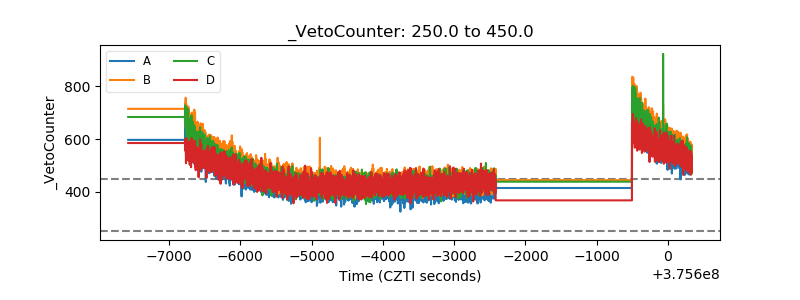 |