| Param | Original file | Final file |
|---|---|---|
| Filename | modeM0/AS1T04_071T01_9000004782_33321cztM0_level2.evt | modeM0/AS1T04_071T01_9000004782_33321cztM0_level2_quad_clean.evt |
| Size (bytes) | 582,122,880 | 93,611,520 |
| Size | 555.2 MB | 89.3 MB |
| Events in quadrant A | 3,900,213 | 655,196 |
| Events in quadrant B | 3,971,970 | 635,984 |
| Events in quadrant C | 5,403,179 | 594,599 |
| Events in quadrant D | 4,013,651 | 595,254 |
| Mode M0 | |||
|---|---|---|---|
| Quadrant | BADHDUFLAG | Total packets | Discarded packets |
| A | 0 | 15067 | 3 |
| B | 0 | 15045 | 2 |
| C | 0 | 19468 | 2 |
| D | 0 | 15633 | 2 |
| Mode SS | |||
|---|---|---|---|
| Quadrant | BADHDUFLAG | Total packets | Discarded packets |
| A | 0 | 104 | 0 |
| B | 0 | 104 | 0 |
| C | 0 | 104 | 0 |
| D | 0 | 104 | 0 |
| Mode M9 | |||
|---|---|---|---|
| Quadrant | BADHDUFLAG | Total packets | Discarded packets |
| A | 0 | 20 | 0 |
| B | 0 | 20 | 0 |
| C | 0 | 20 | 0 |
| D | 0 | 21 | 0 |
| Quadrant | Total seconds | Saturated seconds | Saturation percentage |
|---|---|---|---|
| A | 5038 | 259 | 5.140929% |
| B | 5038 | 439 | 8.713775% |
| C | 5038 | 707 | 14.033347% |
| D | 5038 | 152 | 3.017070% |
Noise dominated data is calculated using 1-second bins in cleaned event files. If a bin has >2000 counts, and if more than 50% of those come from <1% of pixels, then it is considered to be noise-dominated and hence unusable.
| Quadrant | # 1 sec bins | Bins with >0 counts | Bins with >2000 counts | High rate bins dominated by noise | Noise dominated (total time) | Noise dominated (detector-on time) | Marked lightcurve |
|---|---|---|---|---|---|---|---|
| A | 7072 | 5039 | 140 | 140 | 1.98% | 2.78% | 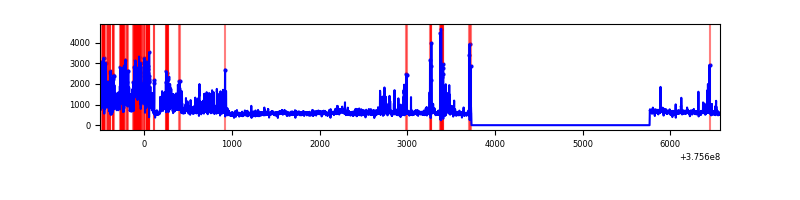 |
| B | 7072 | 5039 | 331 | 331 | 4.68% | 6.57% | 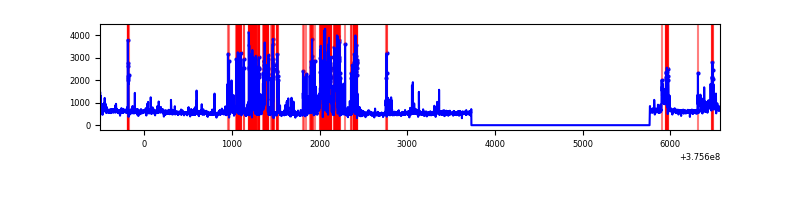 |
| C | 7072 | 5039 | 598 | 598 | 8.46% | 11.87% | 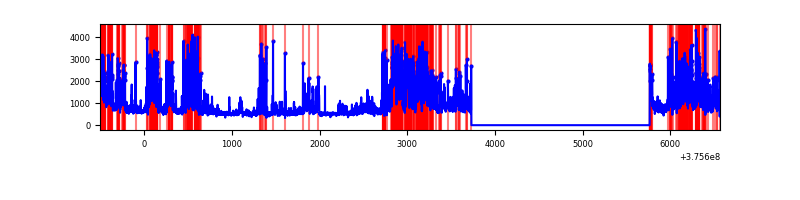 |
| D | 7072 | 5039 | 134 | 134 | 1.89% | 2.66% | 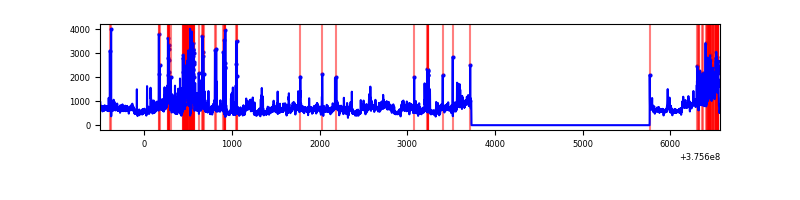 |
Top three noisy pixels from each quadrant. If the there are fewer than three noisy pixels in the level2.evt file, extra rows are filled as -1
| Pixel properties | Quadrant properties | ||||||
|---|---|---|---|---|---|---|---|
| Quadrant | DetID | PixID | Counts | Sigma | Mean | Median | Sigma |
| A | 15 | 169 | 1277258 | 9599.47 | 672 | 662 | 133.0 |
| A | 15 | 17 | 21814 | 159.05 | 672 | 662 | 133.0 |
| A | 13 | 6 | 8751 | 60.83 | 672 | 662 | 133.0 |
| B | 5 | 172 | 732226 | 6010.16 | 652 | 640 | 121.7 |
| B | 0 | 219 | 413493 | 3391.69 | 652 | 640 | 121.7 |
| B | 5 | 200 | 194089 | 1589.23 | 652 | 640 | 121.7 |
| C | 1 | 23 | 1789121 | 12893.18 | 611 | 617 | 138.7 |
| C | 10 | 49 | 685226 | 4935.29 | 611 | 617 | 138.7 |
| C | 15 | 214 | 228699 | 1644.22 | 611 | 617 | 138.7 |
| D | 8 | 195 | 759890 | 4829.42 | 644 | 628 | 157.2 |
| D | 2 | 250 | 530747 | 3371.91 | 644 | 628 | 157.2 |
| D | 2 | 249 | 63921 | 402.59 | 644 | 628 | 157.2 |
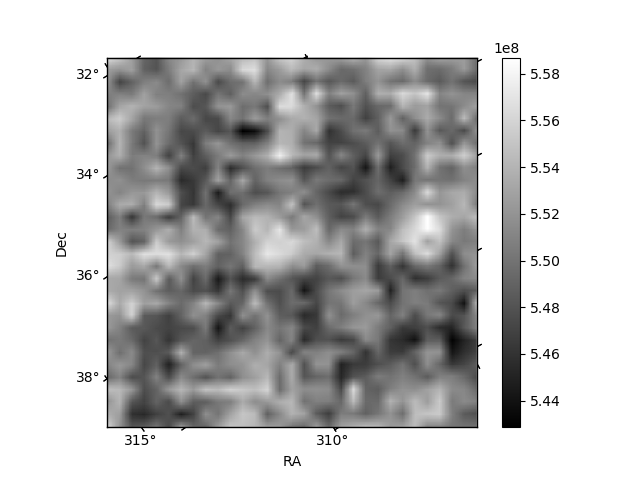
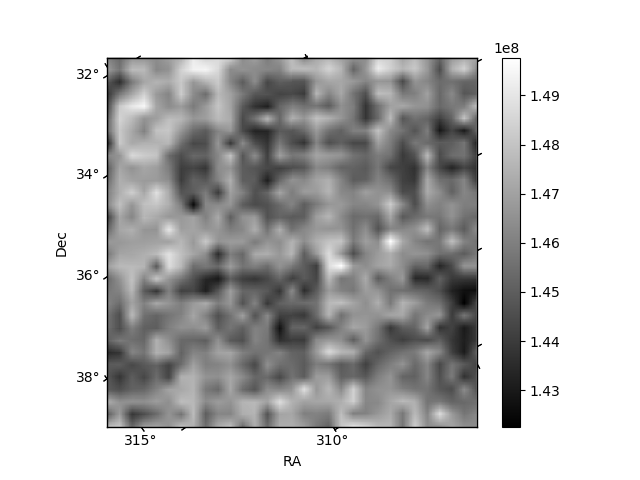
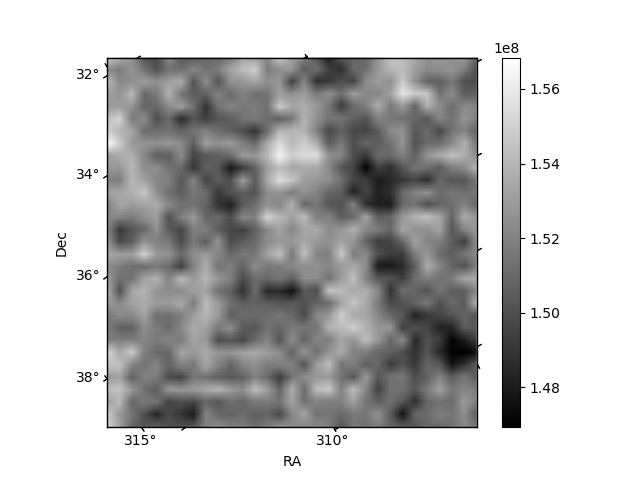
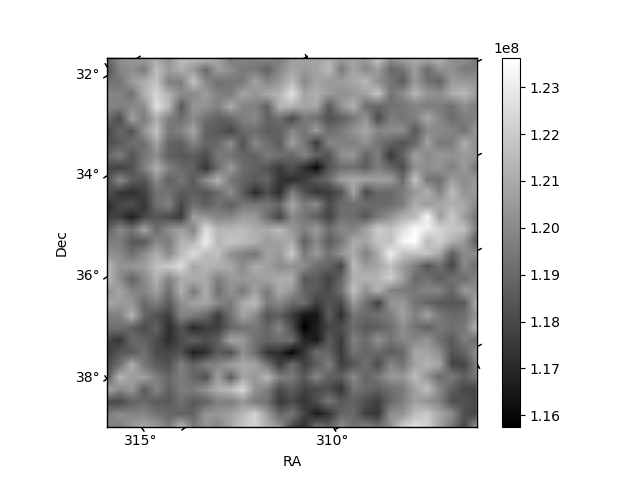
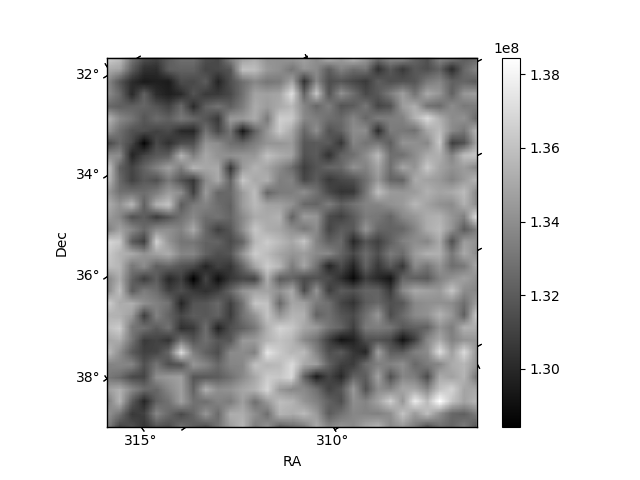
Histogram calculated using DETX and DETY for each event in the final _common_clean file
| Quadrant A | 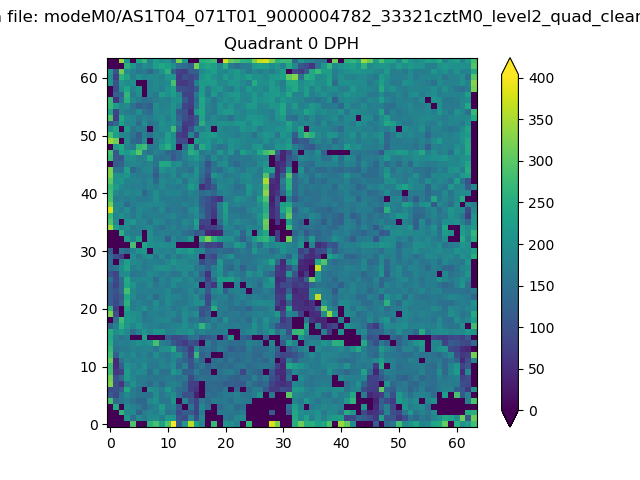 |
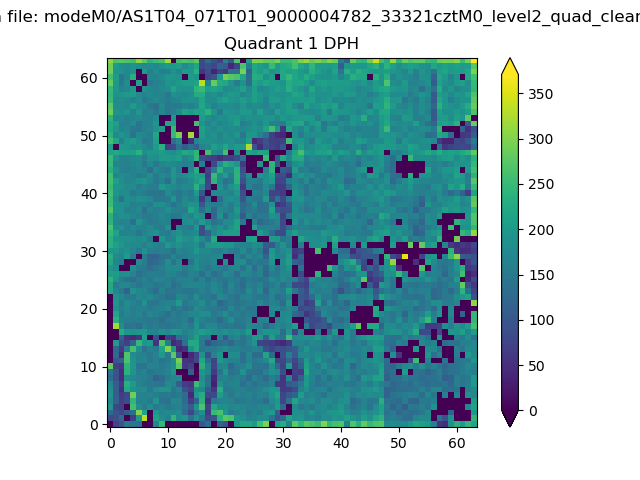 |
Quadrant B |
|---|---|---|---|
| Quadrant D | 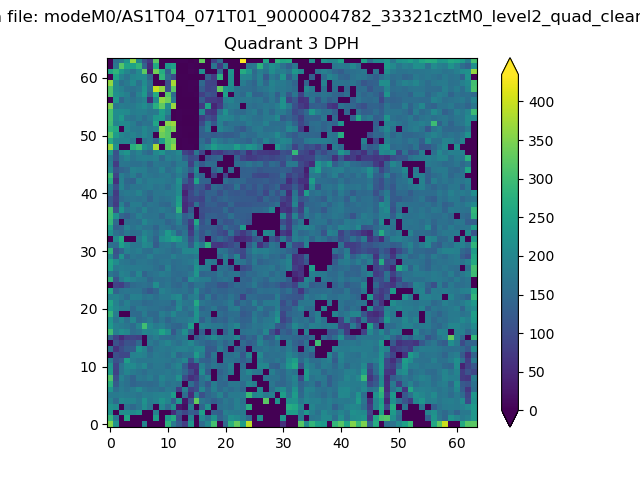 |
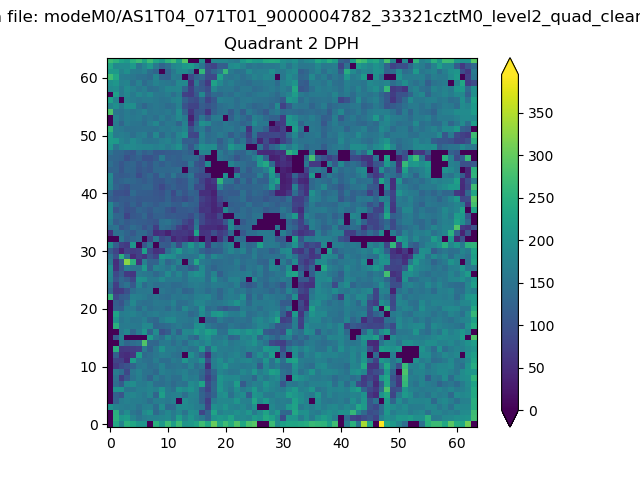 |
Quadrant C |
| Plot type | Count rate plots | Images |
|---|---|---|
| Comparison with Poisson distribution Blue bars denote a histogram of data divided into 1 sec bins. Red curve is a Poisson curve with rate = median count rate of data. |
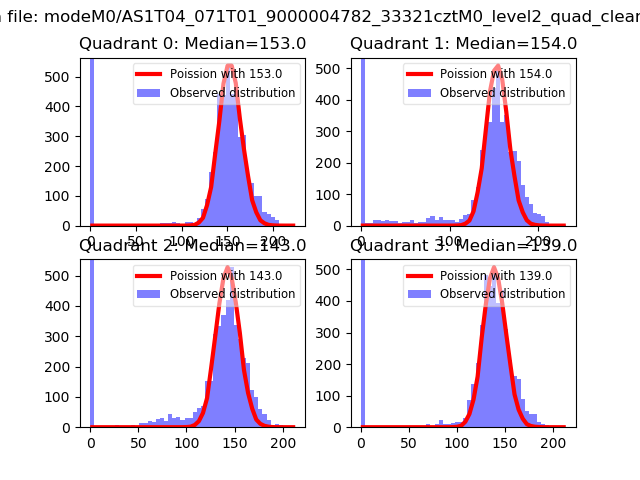 |
 |
| Quadrant-wise count rates Data is divided into 100 sec bins |
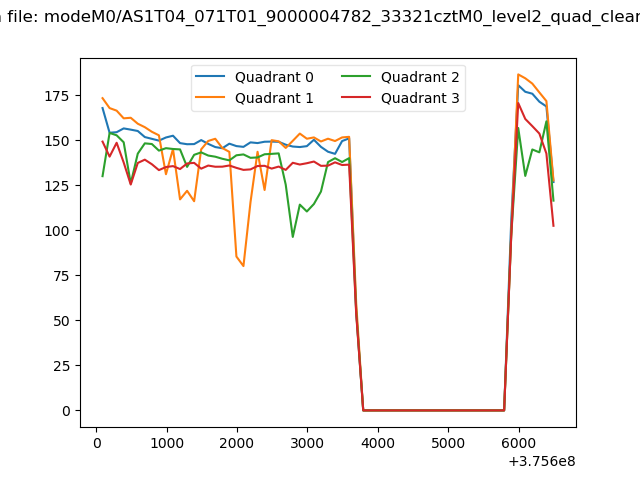 |
|
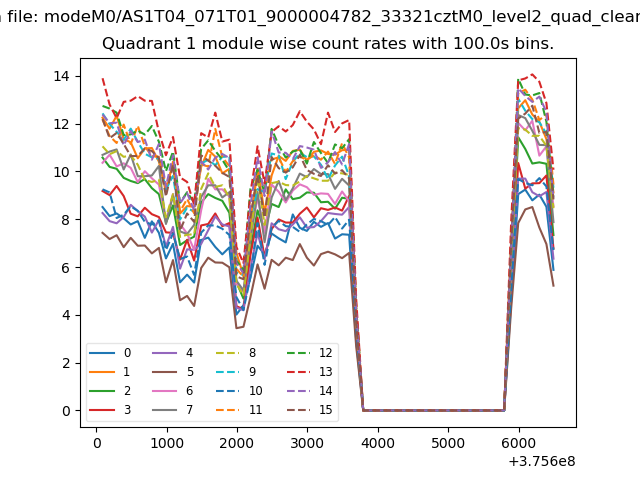
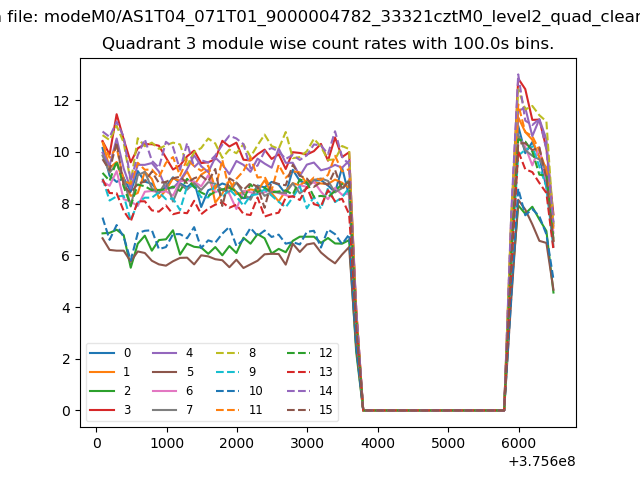
| Module-wise count rates for Quadrant A Data is divided into 100 sec bins |
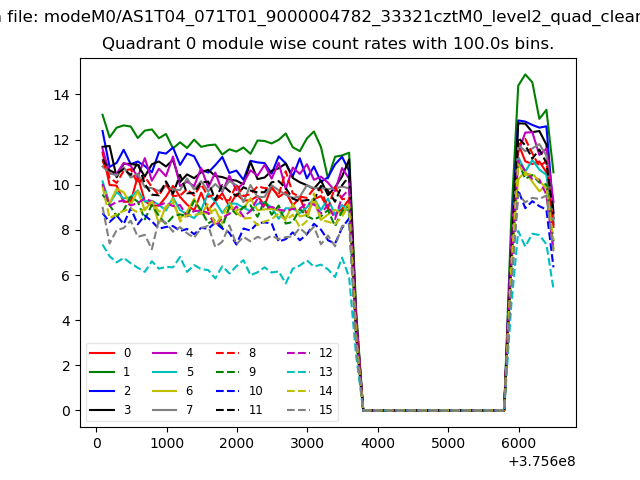 |
 |
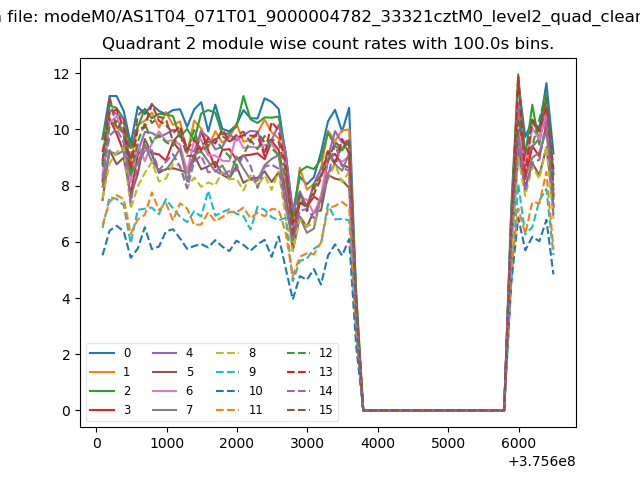
| Module-wise count rates for Quadrant B Data is divided into 100 sec bins |
 |
 |
| Module-wise count rates for Quadrant C Data is divided into 100 sec bins |
 |
 |
| Module-wise count rates for Quadrant D Data is divided into 100 sec bins |
 |
 |
| Parameter | Plot |
|---|---|
| CZT HV Monitor | 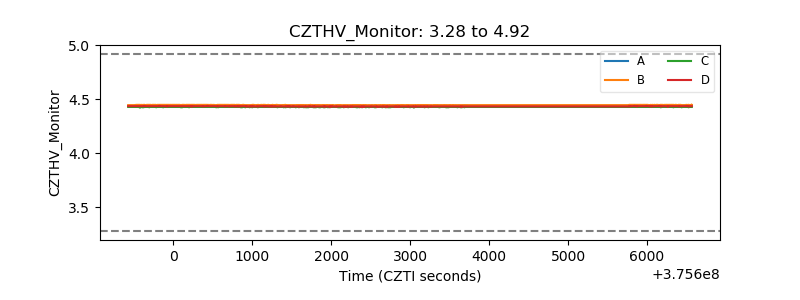 |
| D_VDD | 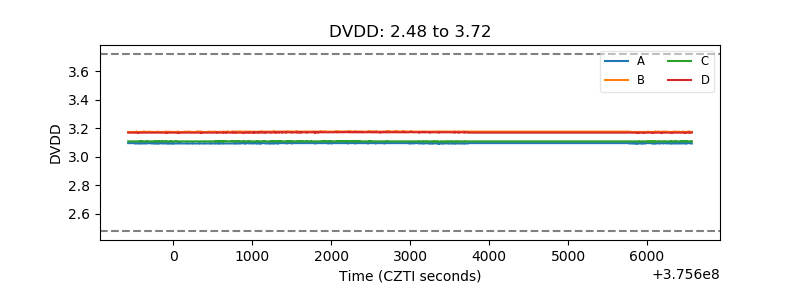 |
| Temperature 1 | 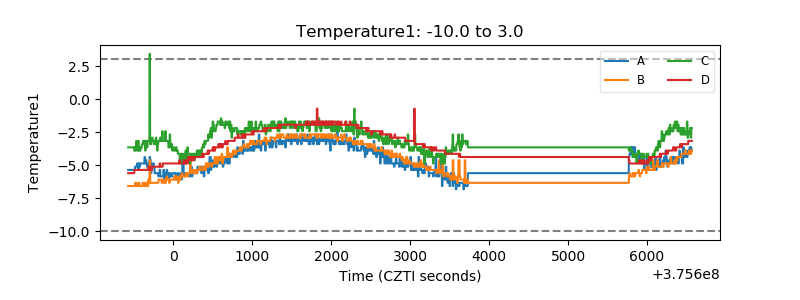 |
| Veto HV Monitor | 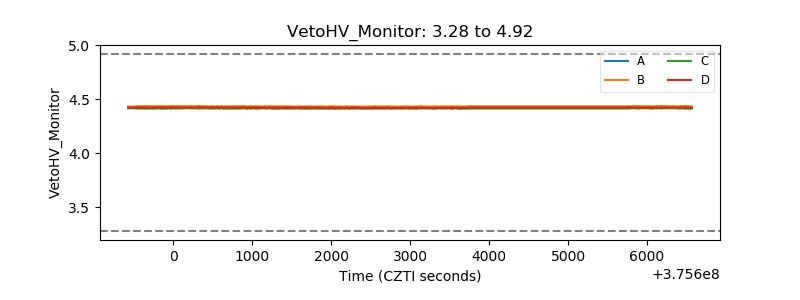 |
| Veto LLD | 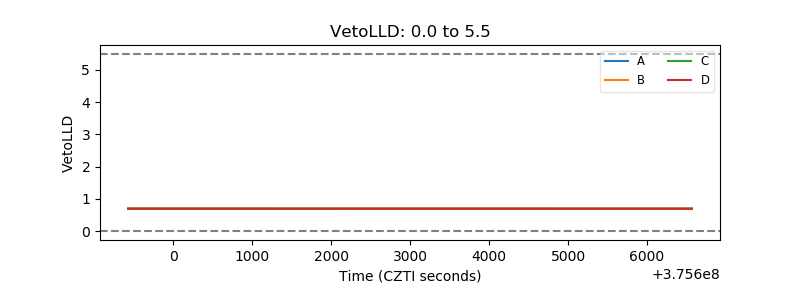 |
| Alpha Counter | 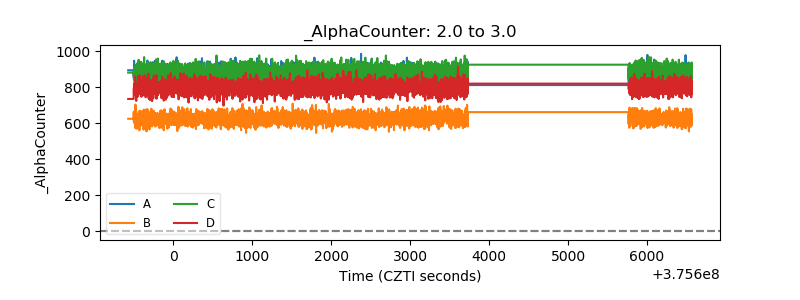 |
| _CPM_Rate | 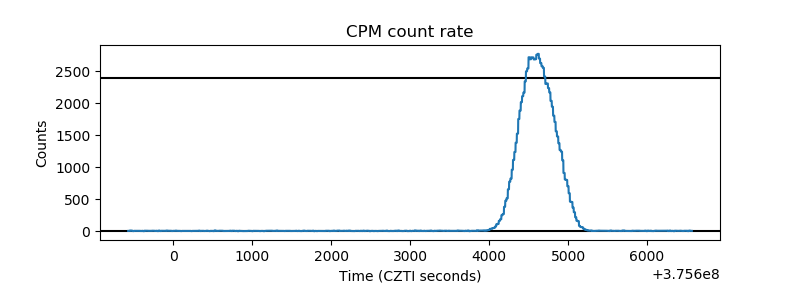 |
| CZT Counter | 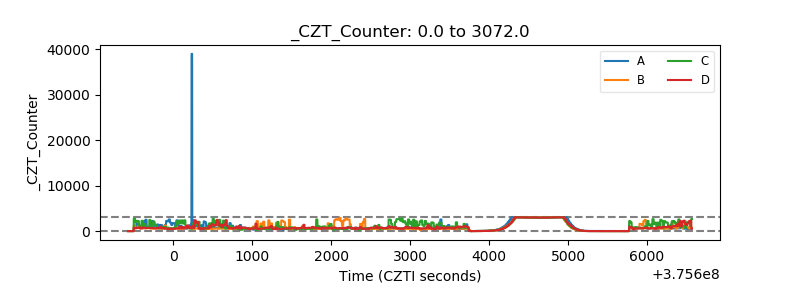 |
| +2.5 Volts monitor | 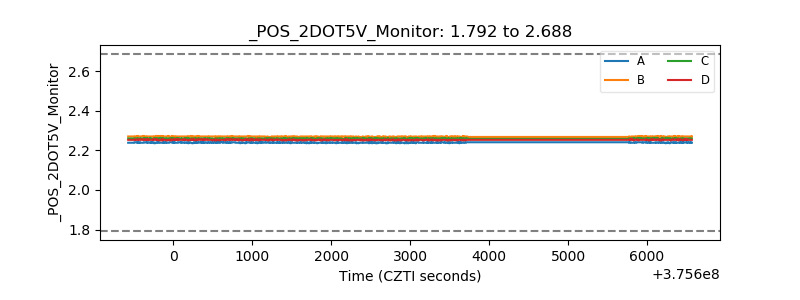 |
| +5 Volts monitor |  |
| _ROLL_ROT | 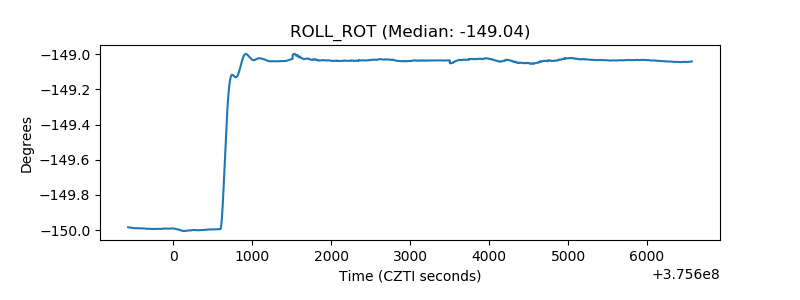 |
| _Roll_DEC | 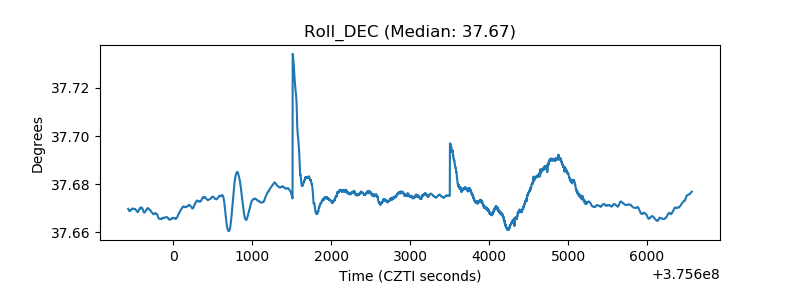 |
| _Roll_RA | 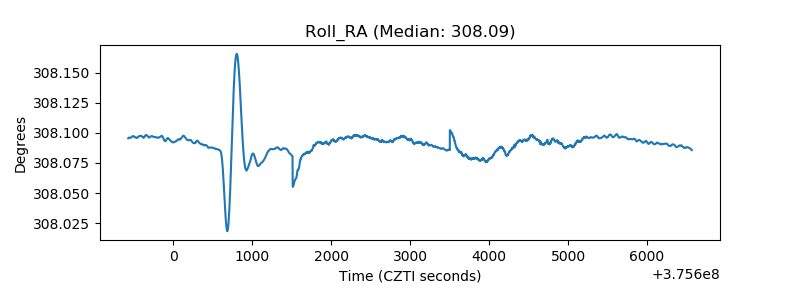 |
| Veto Counter | 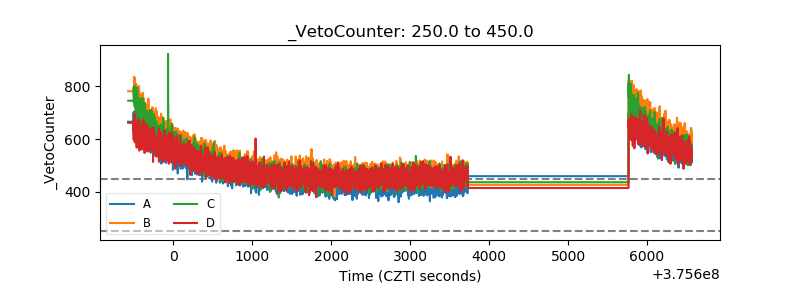 |