| Param | Original file | Final file |
|---|---|---|
| Filename | modeM0/AS1T04_071T01_9000004782_33323cztM0_level2.evt | modeM0/AS1T04_071T01_9000004782_33323cztM0_level2_quad_clean.evt |
| Size (bytes) | 494,386,560 | 90,757,440 |
| Size | 471.5 MB | 86.6 MB |
| Events in quadrant A | 2,553,712 | 636,727 |
| Events in quadrant B | 3,964,687 | 610,275 |
| Events in quadrant C | 4,281,207 | 583,802 |
| Events in quadrant D | 3,844,972 | 577,585 |
| Mode M0 | |||
|---|---|---|---|
| Quadrant | BADHDUFLAG | Total packets | Discarded packets |
| A | 0 | 10214 | 3 |
| B | 0 | 14891 | 2 |
| C | 0 | 15941 | 2 |
| D | 0 | 14644 | 2 |
| Mode SS | |||
|---|---|---|---|
| Quadrant | BADHDUFLAG | Total packets | Discarded packets |
| A | 0 | 100 | 0 |
| B | 0 | 100 | 0 |
| C | 0 | 100 | 0 |
| D | 0 | 100 | 0 |
| Mode M9 | |||
|---|---|---|---|
| Quadrant | BADHDUFLAG | Total packets | Discarded packets |
| A | 0 | 21 | 0 |
| B | 0 | 21 | 0 |
| C | 0 | 21 | 0 |
| D | 0 | 21 | 0 |
| Quadrant | Total seconds | Saturated seconds | Saturation percentage |
|---|---|---|---|
| A | 4840 | 5 | 0.103306% |
| B | 4840 | 393 | 8.119835% |
| C | 4840 | 348 | 7.190083% |
| D | 4840 | 60 | 1.239669% |
Noise dominated data is calculated using 1-second bins in cleaned event files. If a bin has >2000 counts, and if more than 50% of those come from <1% of pixels, then it is considered to be noise-dominated and hence unusable.
| Quadrant | # 1 sec bins | Bins with >0 counts | Bins with >2000 counts | High rate bins dominated by noise | Noise dominated (total time) | Noise dominated (detector-on time) | Marked lightcurve |
|---|---|---|---|---|---|---|---|
| A | 6963 | 4841 | 0 | 0 | 0.00% | 0.00% | 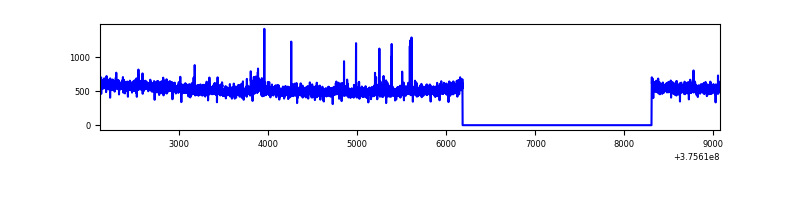 |
| B | 6963 | 4841 | 266 | 266 | 3.82% | 5.49% | 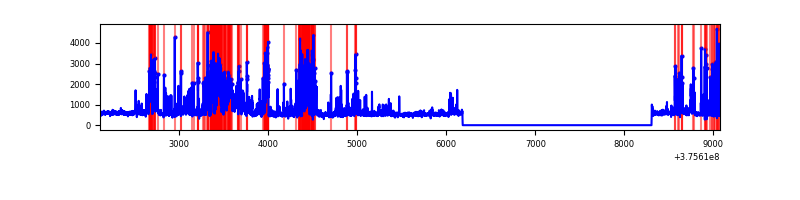 |
| C | 6963 | 4841 | 295 | 295 | 4.24% | 6.09% | 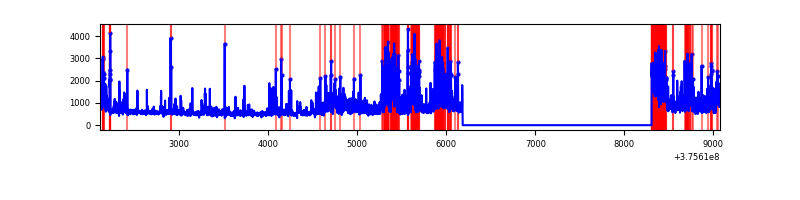 |
| D | 6963 | 4841 | 45 | 45 | 0.65% | 0.93% | 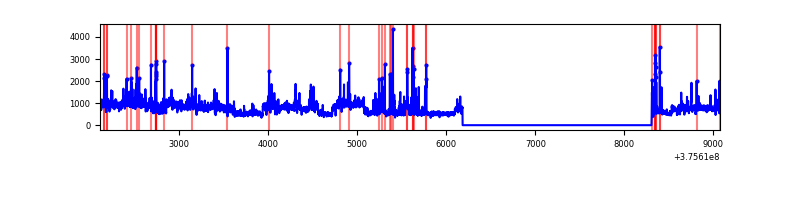 |
Top three noisy pixels from each quadrant. If the there are fewer than three noisy pixels in the level2.evt file, extra rows are filled as -1
| Pixel properties | Quadrant properties | ||||||
|---|---|---|---|---|---|---|---|
| Quadrant | DetID | PixID | Counts | Sigma | Mean | Median | Sigma |
| A | 15 | 169 | 99863 | 794.57 | 633 | 625 | 124.9 |
| A | 13 | 6 | 7761 | 57.14 | 633 | 625 | 124.9 |
| A | 13 | 254 | 7277 | 53.26 | 633 | 625 | 124.9 |
| B | 5 | 172 | 881066 | 7736.19 | 605 | 592 | 113.8 |
| B | 0 | 219 | 595843 | 5230.11 | 605 | 592 | 113.8 |
| B | 15 | 85 | 39585 | 342.61 | 605 | 592 | 113.8 |
| C | 1 | 23 | 797114 | 6004.37 | 579 | 585 | 132.7 |
| C | 10 | 49 | 660548 | 4974.92 | 579 | 585 | 132.7 |
| C | 15 | 214 | 220484 | 1657.64 | 579 | 585 | 132.7 |
| D | 8 | 195 | 1084349 | 7356.96 | 602 | 587 | 147.3 |
| D | 2 | 250 | 123943 | 837.38 | 602 | 587 | 147.3 |
| D | 13 | 249 | 97942 | 660.88 | 602 | 587 | 147.3 |
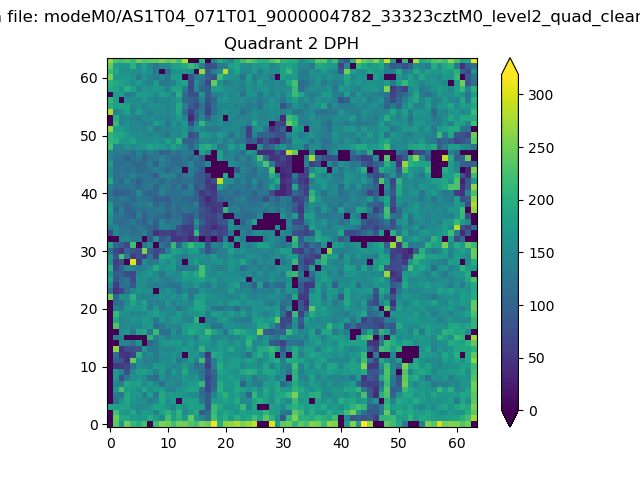
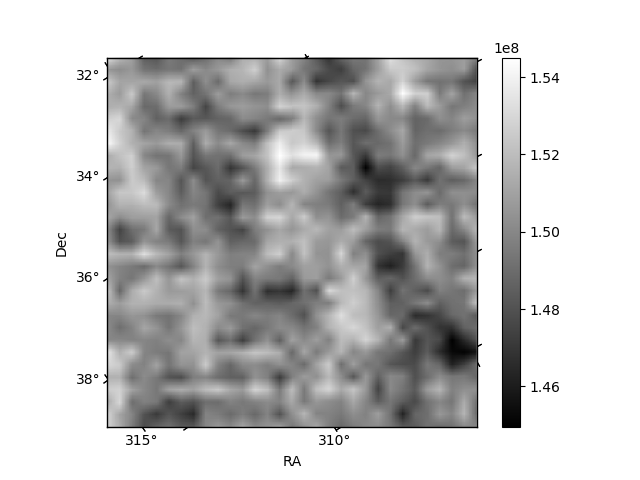
Histogram calculated using DETX and DETY for each event in the final _common_clean file
| Quadrant A | 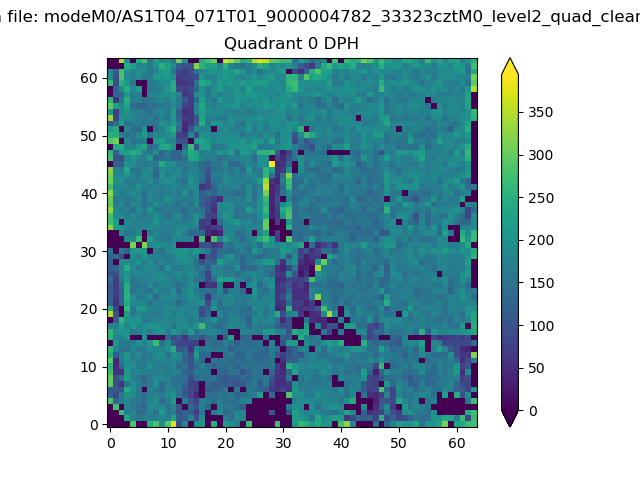 |
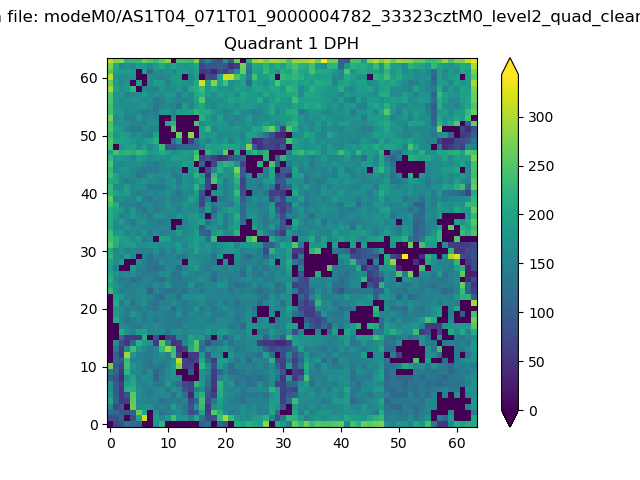 |
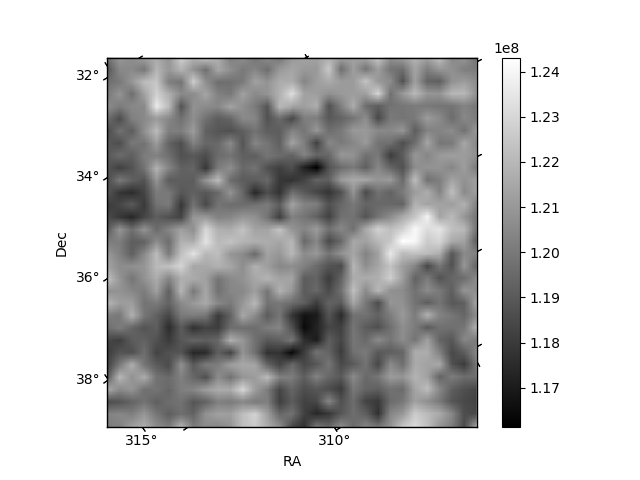
Quadrant B |
|---|---|---|---|
| Quadrant D | 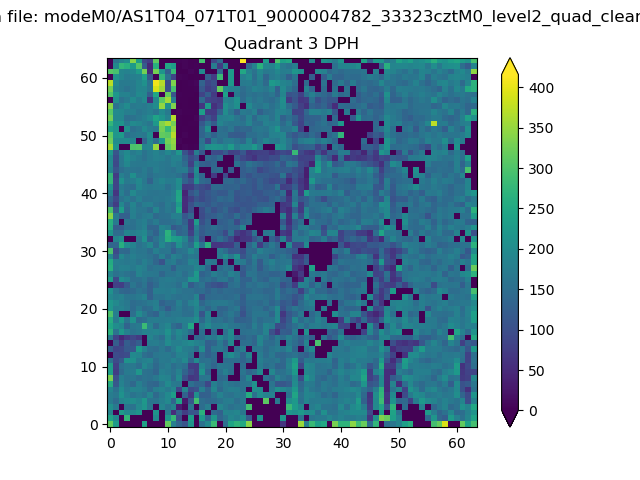 |
 |
Quadrant C |
| Plot type | Count rate plots | Images |
|---|---|---|
| Comparison with Poisson distribution Blue bars denote a histogram of data divided into 1 sec bins. Red curve is a Poisson curve with rate = median count rate of data. |
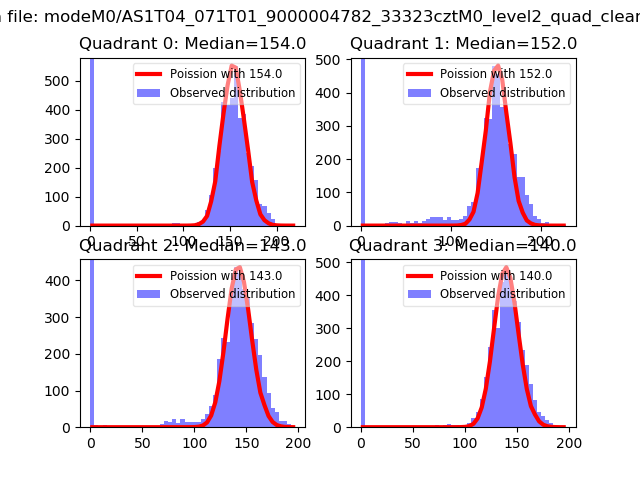 |
 |
| Quadrant-wise count rates Data is divided into 100 sec bins |
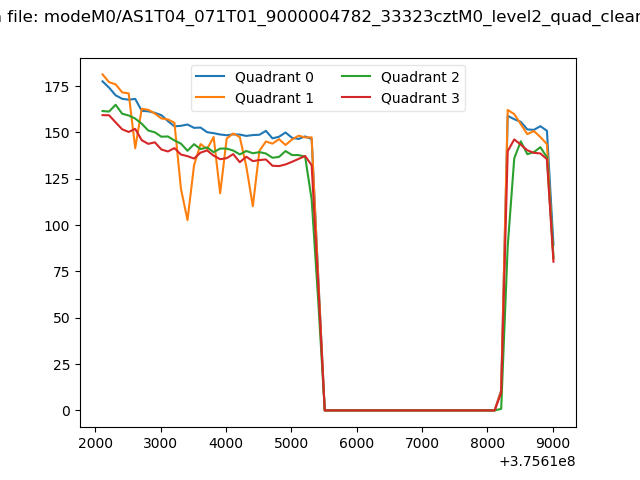 |
|
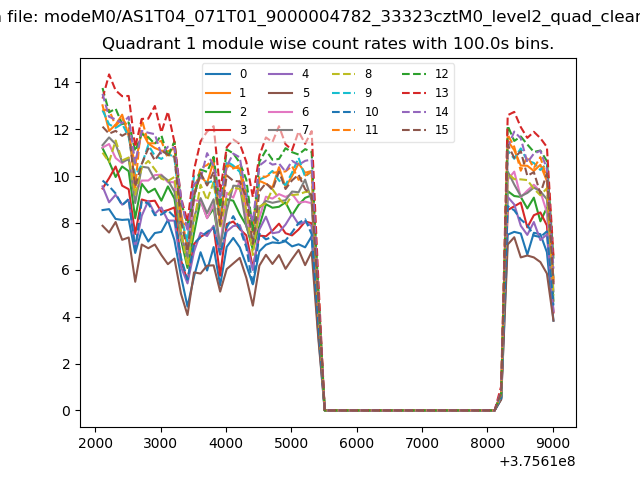
| Module-wise count rates for Quadrant A Data is divided into 100 sec bins |
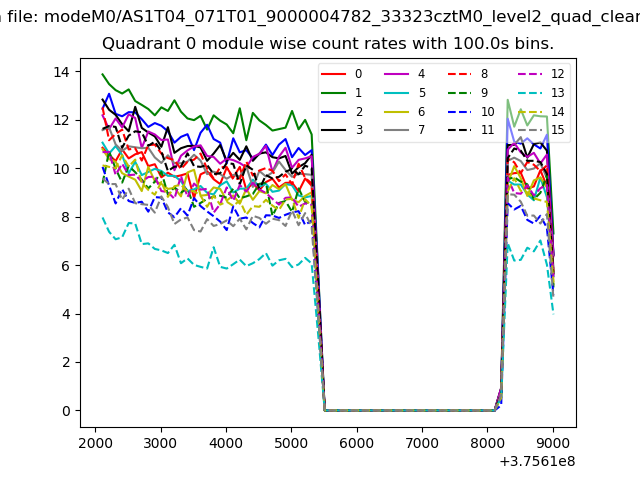 |
 |
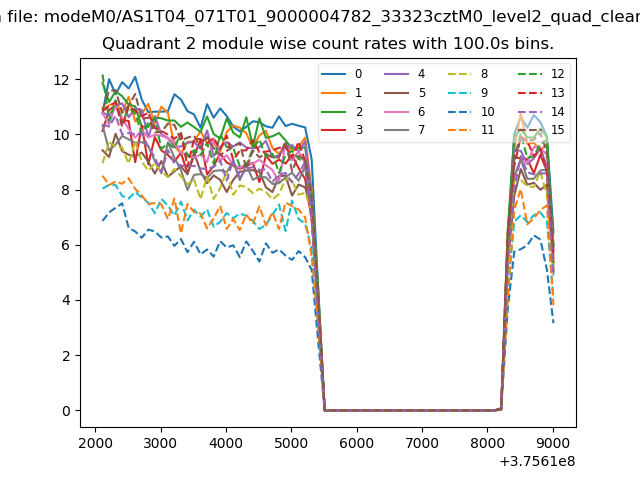
| Module-wise count rates for Quadrant B Data is divided into 100 sec bins |
 |
 |
| Module-wise count rates for Quadrant C Data is divided into 100 sec bins |
 |
 |
| Module-wise count rates for Quadrant D Data is divided into 100 sec bins |
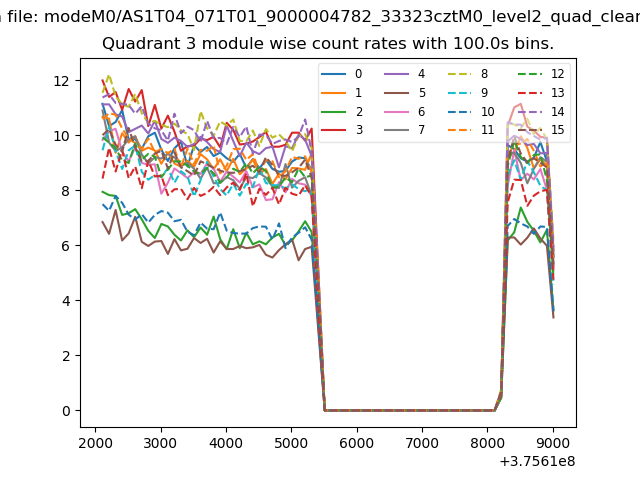 |
 |
| Parameter | Plot |
|---|---|
| CZT HV Monitor | 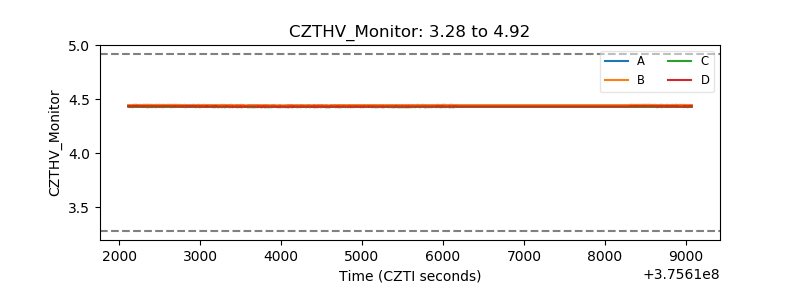 |
| D_VDD | 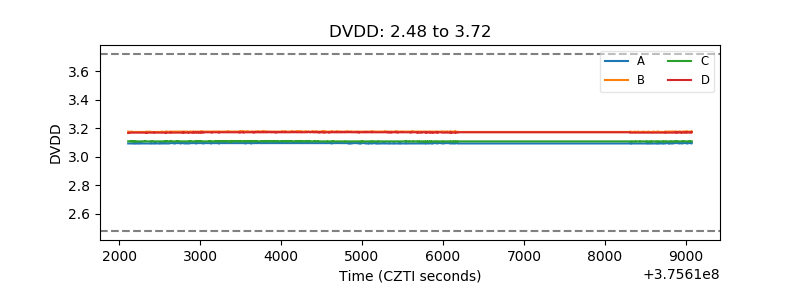 |
| Temperature 1 | 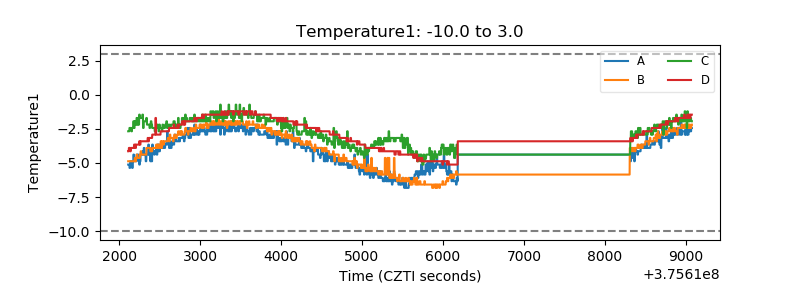 |
| Veto HV Monitor | 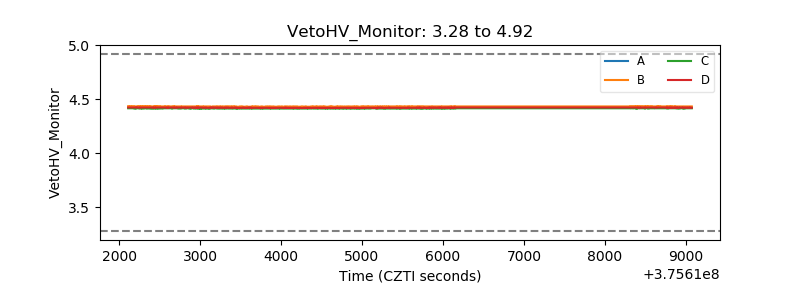 |
| Veto LLD | 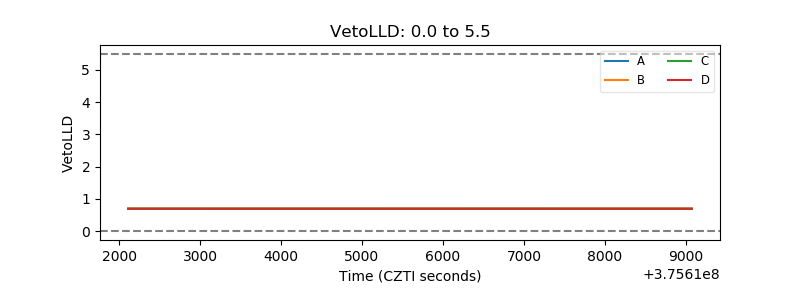 |
| Alpha Counter | 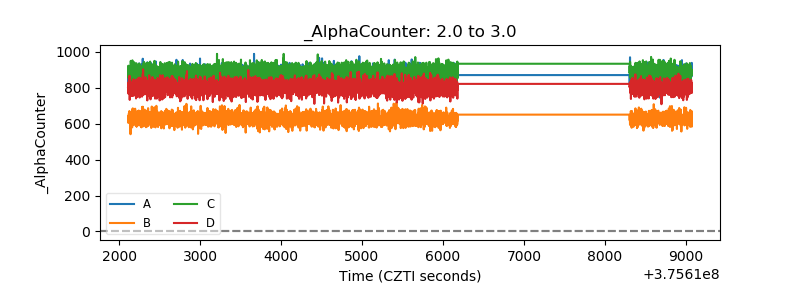 |
| _CPM_Rate | 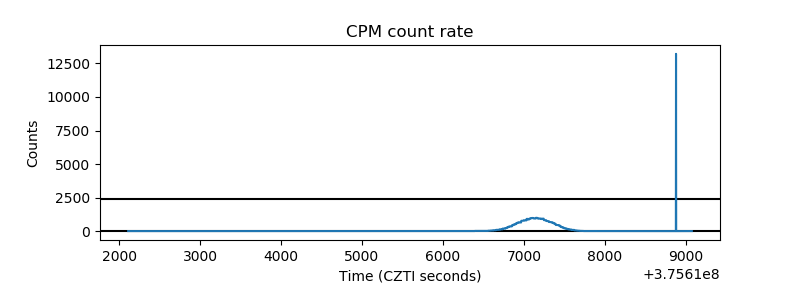 |
| CZT Counter |  |
| +2.5 Volts monitor |  |
| +5 Volts monitor |  |
| _ROLL_ROT | 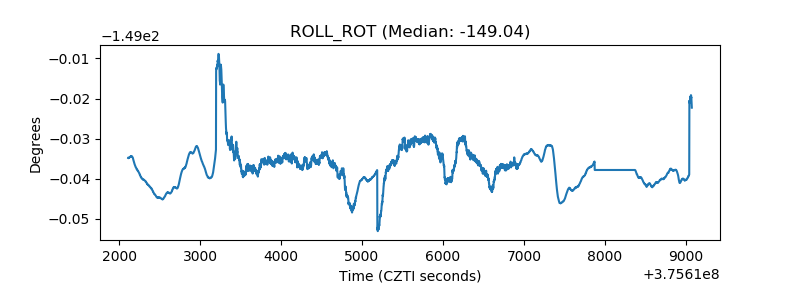 |
| _Roll_DEC | 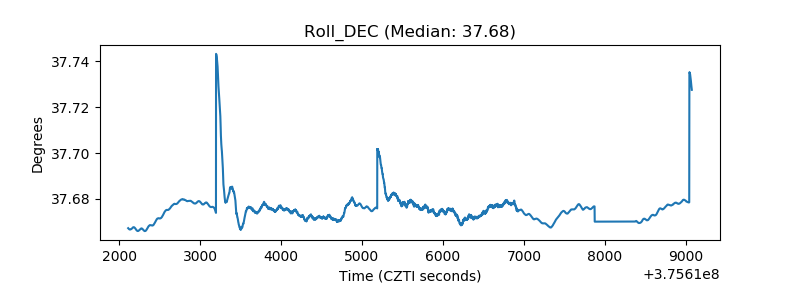 |
| _Roll_RA | 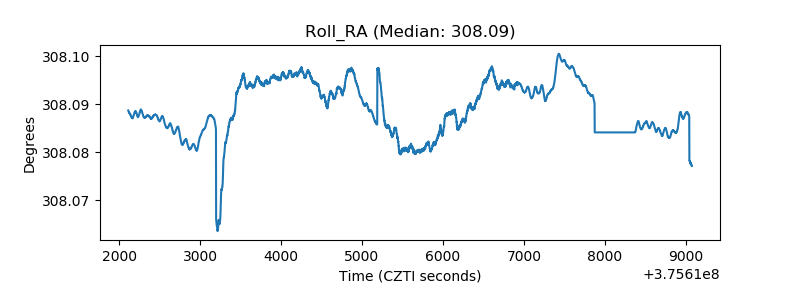 |
| Veto Counter | 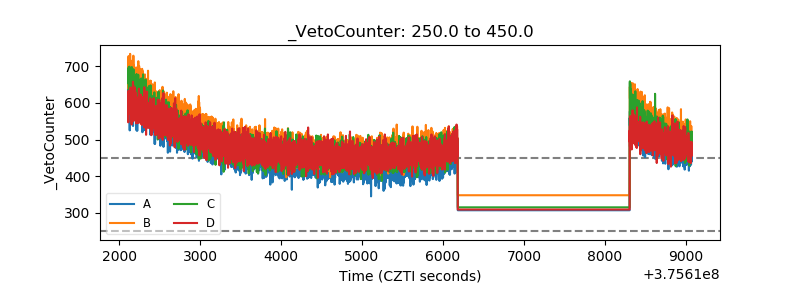 |