| Param | Original file | Final file |
|---|---|---|
| Filename | modeM0/AS1T04_071T01_9000004782_33324cztM0_level2.evt | modeM0/AS1T04_071T01_9000004782_33324cztM0_level2_quad_clean.evt |
| Size (bytes) | 544,014,720 | 76,256,640 |
| Size | 518.8 MB | 72.7 MB |
| Events in quadrant A | 2,762,081 | 524,581 |
| Events in quadrant B | 4,546,674 | 478,520 |
| Events in quadrant C | 4,909,576 | 475,470 |
| Events in quadrant D | 3,926,145 | 486,500 |
| Mode M0 | |||
|---|---|---|---|
| Quadrant | BADHDUFLAG | Total packets | Discarded packets |
| A | 0 | 11014 | 2 |
| B | 0 | 16652 | 1 |
| C | 0 | 17892 | 1 |
| D | 0 | 15063 | 1 |
| Mode SS | |||
|---|---|---|---|
| Quadrant | BADHDUFLAG | Total packets | Discarded packets |
| A | 0 | 100 | 0 |
| B | 0 | 100 | 0 |
| C | 0 | 100 | 0 |
| D | 0 | 100 | 0 |
| Mode M9 | |||
|---|---|---|---|
| Quadrant | BADHDUFLAG | Total packets | Discarded packets |
| A | 0 | 21 | 0 |
| B | 0 | 21 | 0 |
| C | 0 | 21 | 0 |
| D | 0 | 21 | 0 |
| Quadrant | Total seconds | Saturated seconds | Saturation percentage |
|---|---|---|---|
| A | 4896 | 48 | 0.980392% |
| B | 4896 | 730 | 14.910131% |
| C | 4896 | 454 | 9.272876% |
| D | 4896 | 69 | 1.409314% |
Noise dominated data is calculated using 1-second bins in cleaned event files. If a bin has >2000 counts, and if more than 50% of those come from <1% of pixels, then it is considered to be noise-dominated and hence unusable.
| Quadrant | # 1 sec bins | Bins with >0 counts | Bins with >2000 counts | High rate bins dominated by noise | Noise dominated (total time) | Noise dominated (detector-on time) | Marked lightcurve |
|---|---|---|---|---|---|---|---|
| A | 6958 | 4897 | 38 | 38 | 0.55% | 0.78% | 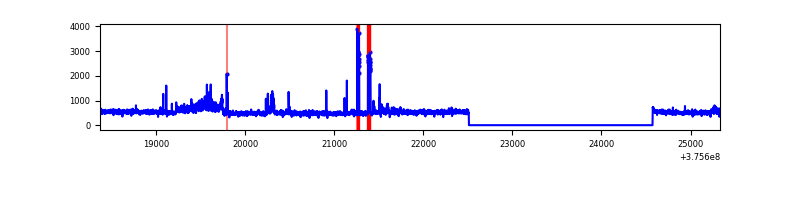 |
| B | 6958 | 4897 | 526 | 526 | 7.56% | 10.74% | 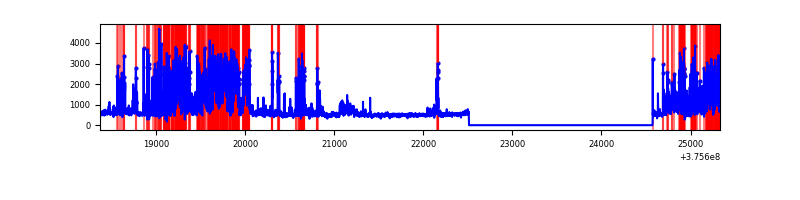 |
| C | 6958 | 4897 | 413 | 413 | 5.94% | 8.43% | 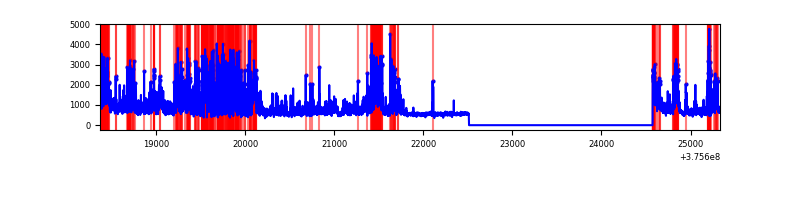 |
| D | 6958 | 4897 | 53 | 53 | 0.76% | 1.08% | 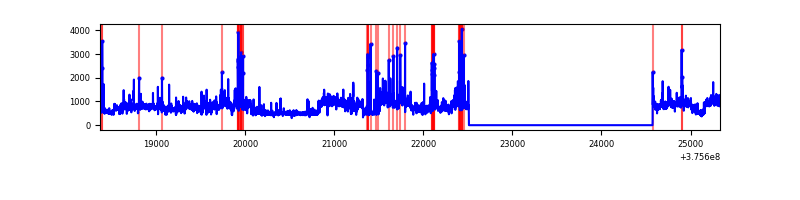 |
Top three noisy pixels from each quadrant. If the there are fewer than three noisy pixels in the level2.evt file, extra rows are filled as -1
| Pixel properties | Quadrant properties | ||||||
|---|---|---|---|---|---|---|---|
| Quadrant | DetID | PixID | Counts | Sigma | Mean | Median | Sigma |
| A | 15 | 169 | 338405 | 2805.91 | 605 | 594 | 120.4 |
| A | 12 | 16 | 65612 | 540.05 | 605 | 594 | 120.4 |
| A | 12 | 194 | 15115 | 120.61 | 605 | 594 | 120.4 |
| B | 5 | 172 | 1264497 | 11767.64 | 564 | 551 | 107.4 |
| B | 0 | 219 | 919220 | 8553.03 | 564 | 551 | 107.4 |
| B | 15 | 85 | 67622 | 624.45 | 564 | 551 | 107.4 |
| C | 10 | 49 | 837548 | 6528.11 | 557 | 562 | 128.2 |
| C | 0 | 207 | 798665 | 6224.84 | 557 | 562 | 128.2 |
| C | 1 | 23 | 673364 | 5247.55 | 557 | 562 | 128.2 |
| D | 8 | 195 | 1277294 | 8395.09 | 577 | 567 | 152.1 |
| D | 2 | 250 | 78445 | 512.08 | 577 | 567 | 152.1 |
| D | 12 | 6 | 50467 | 328.12 | 577 | 567 | 152.1 |
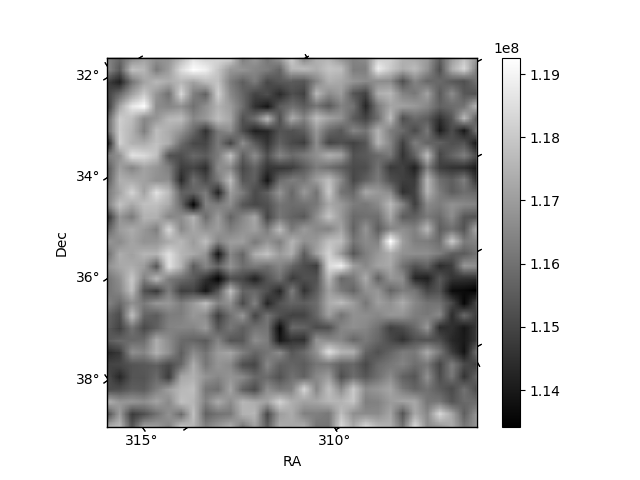
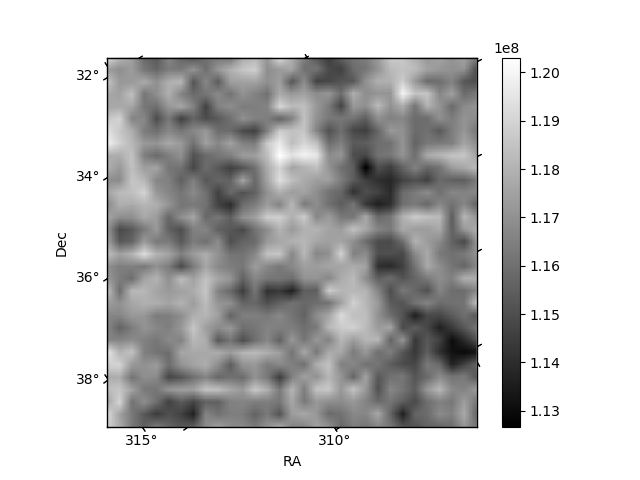
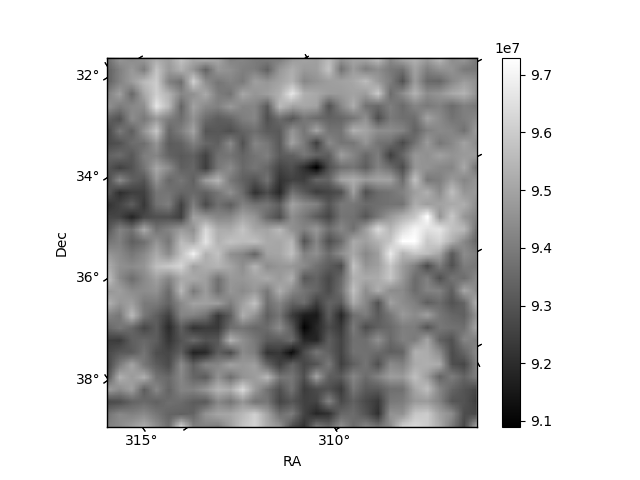
Histogram calculated using DETX and DETY for each event in the final _common_clean file
| Quadrant A | 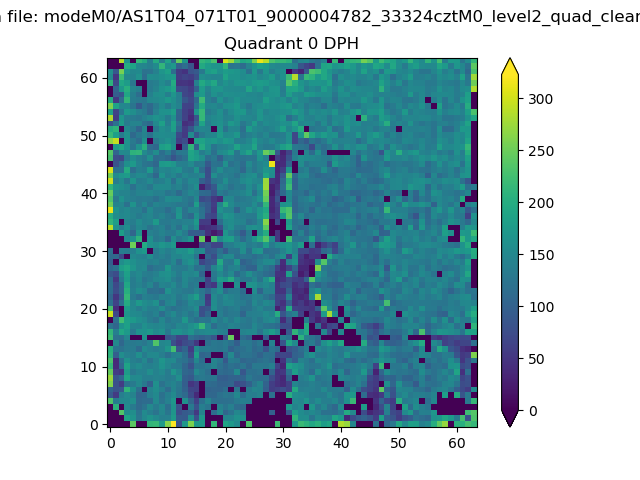 |
 |
Quadrant B |
|---|---|---|---|
| Quadrant D | 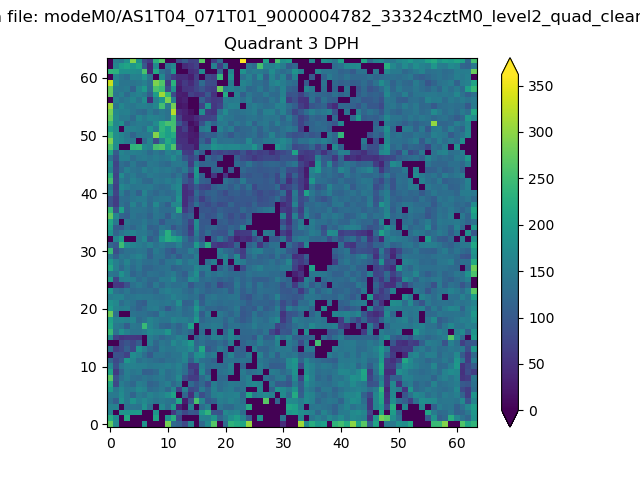 |
 |
Quadrant C |
| Plot type | Count rate plots | Images |
|---|---|---|
| Comparison with Poisson distribution Blue bars denote a histogram of data divided into 1 sec bins. Red curve is a Poisson curve with rate = median count rate of data. |
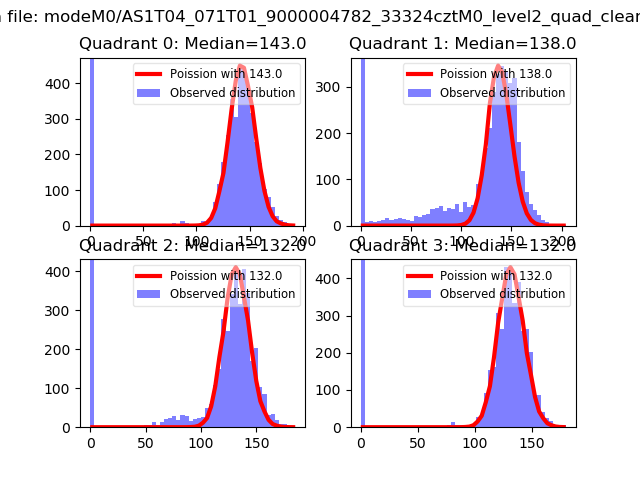 |
 |
| Quadrant-wise count rates Data is divided into 100 sec bins |
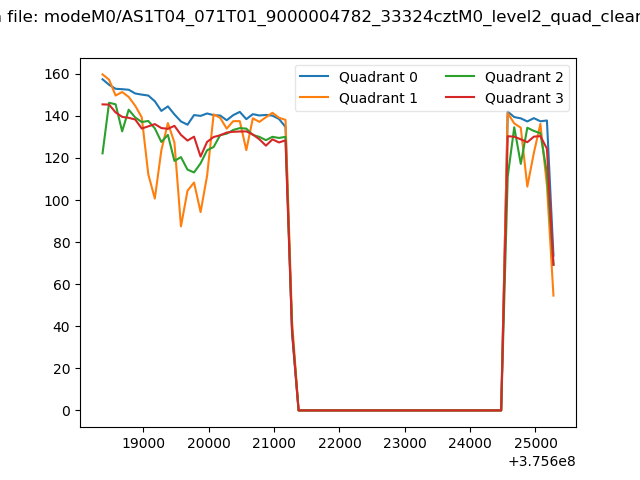 |
|
| Module-wise count rates for Quadrant A Data is divided into 100 sec bins |
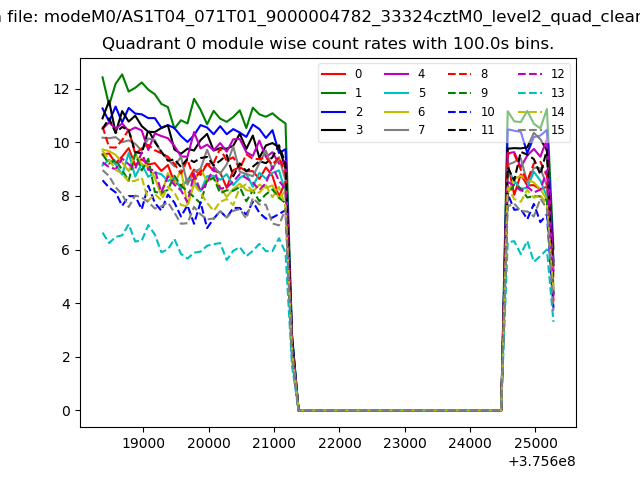 |
 |
| Module-wise count rates for Quadrant B Data is divided into 100 sec bins |
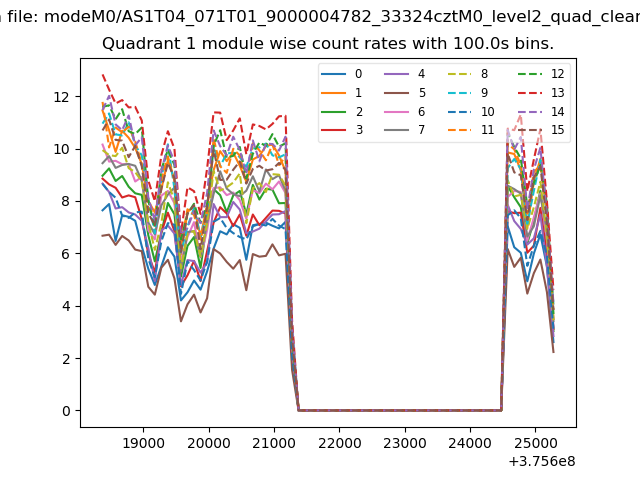 |
 |
| Module-wise count rates for Quadrant C Data is divided into 100 sec bins |
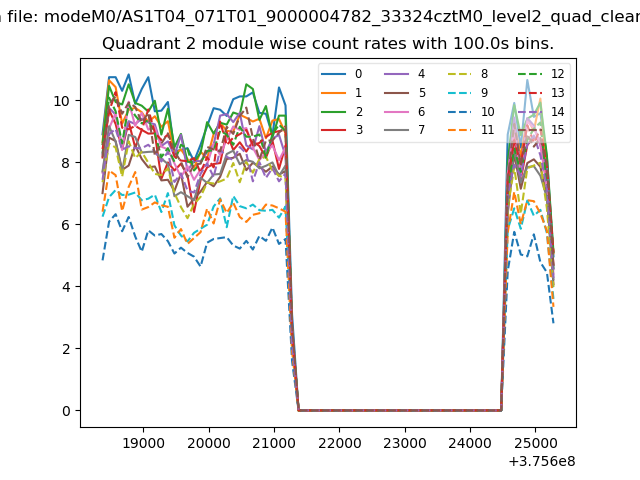 |
 |
| Module-wise count rates for Quadrant D Data is divided into 100 sec bins |
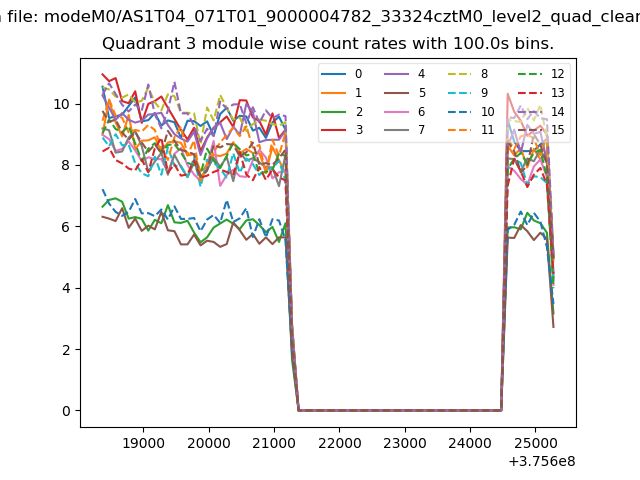 |
 |
| Parameter | Plot |
|---|---|
| CZT HV Monitor | 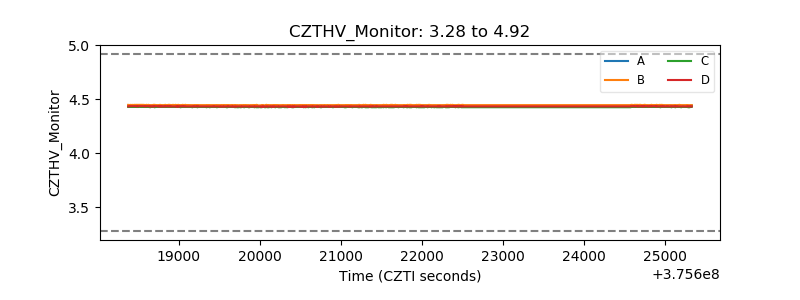 |
| D_VDD | 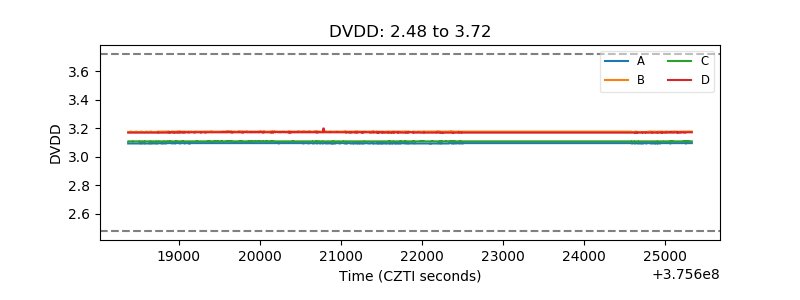 |
| Temperature 1 | 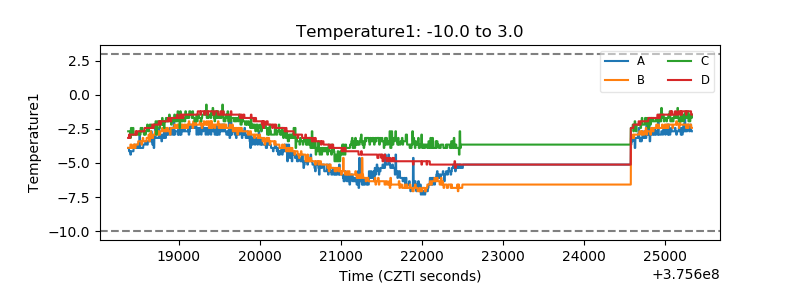 |
| Veto HV Monitor |  |
| Veto LLD | 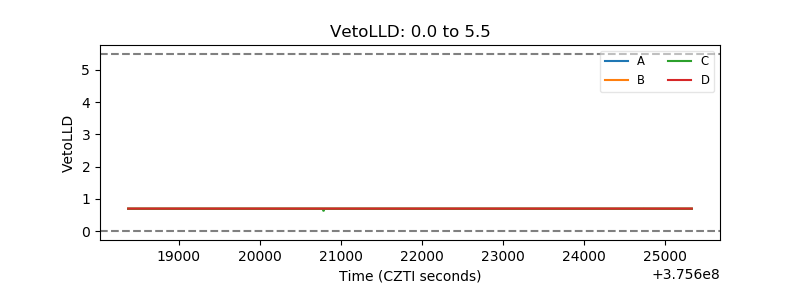 |
| Alpha Counter | 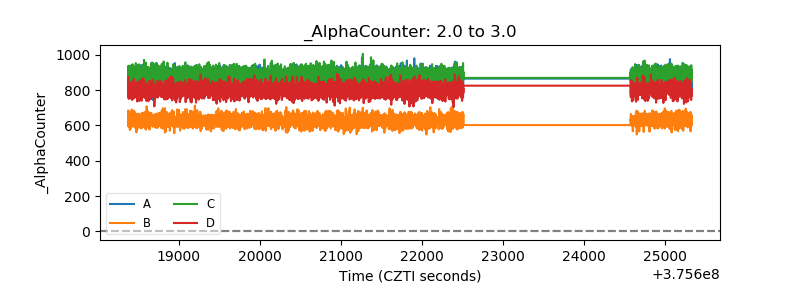 |
| _CPM_Rate | 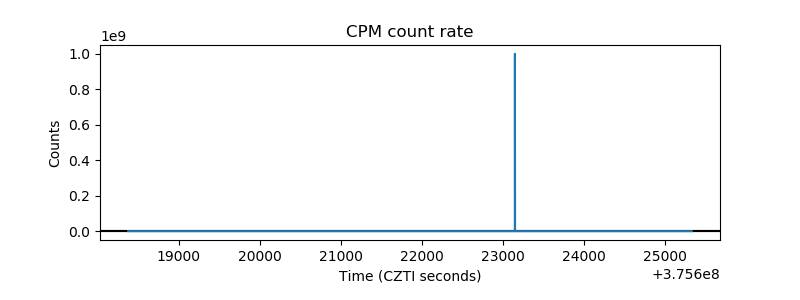 |
| CZT Counter |  |
| +2.5 Volts monitor |  |
| +5 Volts monitor | 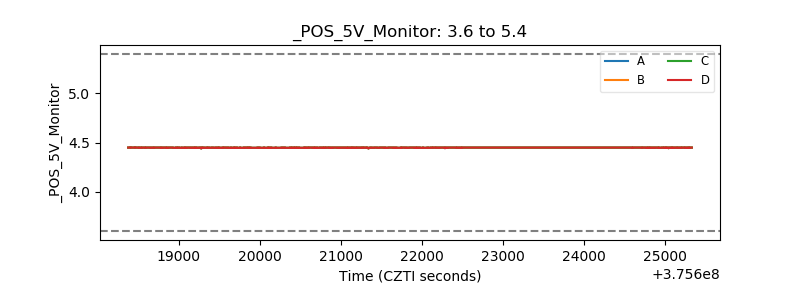 |
| _ROLL_ROT |  |
| _Roll_DEC | 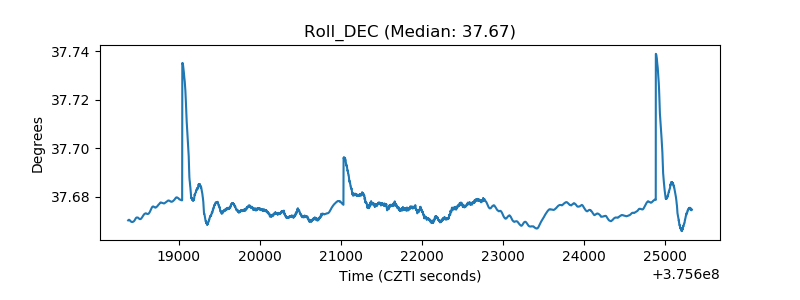 |
| _Roll_RA | 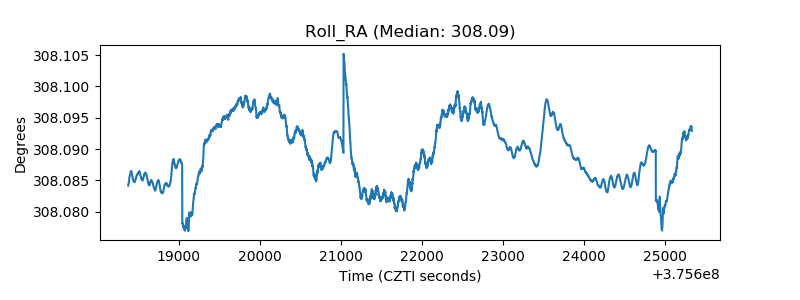 |
| Veto Counter | 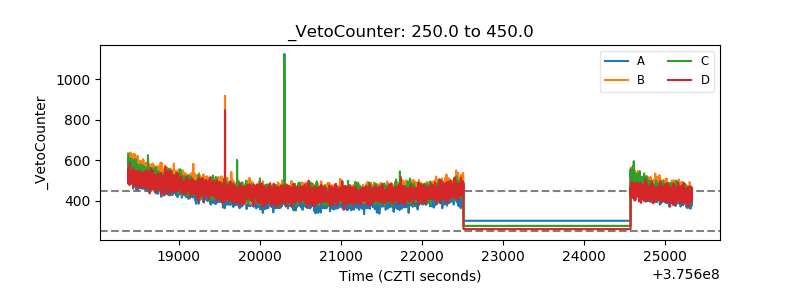 |