| Param | Original file | Final file |
|---|---|---|
| Filename | modeM0/AS1T04_071T01_9000004782_33325cztM0_level2.evt | modeM0/AS1T04_071T01_9000004782_33325cztM0_level2_quad_clean.evt |
| Size (bytes) | 568,972,800 | 67,248,000 |
| Size | 542.6 MB | 64.1 MB |
| Events in quadrant A | 2,643,658 | 452,499 |
| Events in quadrant B | 4,922,769 | 396,796 |
| Events in quadrant C | 4,607,527 | 405,066 |
| Events in quadrant D | 4,700,264 | 411,490 |
| Mode M0 | |||
|---|---|---|---|
| Quadrant | BADHDUFLAG | Total packets | Discarded packets |
| A | 0 | 10989 | 3 |
| B | 0 | 18020 | 2 |
| C | 0 | 17229 | 2 |
| D | 0 | 17571 | 2 |
| Mode SS | |||
|---|---|---|---|
| Quadrant | BADHDUFLAG | Total packets | Discarded packets |
| A | 0 | 108 | 0 |
| B | 0 | 108 | 0 |
| C | 0 | 108 | 0 |
| D | 0 | 108 | 0 |
| Mode M9 | |||
|---|---|---|---|
| Quadrant | BADHDUFLAG | Total packets | Discarded packets |
| A | 0 | 18 | 0 |
| B | 0 | 18 | 0 |
| C | 0 | 18 | 0 |
| D | 0 | 18 | 0 |
| Quadrant | Total seconds | Saturated seconds | Saturation percentage |
|---|---|---|---|
| A | 5278 | 15 | 0.284199% |
| B | 5278 | 999 | 18.927624% |
| C | 5278 | 436 | 8.260705% |
| D | 5279 | 155 | 2.936162% |
Noise dominated data is calculated using 1-second bins in cleaned event files. If a bin has >2000 counts, and if more than 50% of those come from <1% of pixels, then it is considered to be noise-dominated and hence unusable.
| Quadrant | # 1 sec bins | Bins with >0 counts | Bins with >2000 counts | High rate bins dominated by noise | Noise dominated (total time) | Noise dominated (detector-on time) | Marked lightcurve |
|---|---|---|---|---|---|---|---|
| A | 7071 | 5279 | 8 | 8 | 0.11% | 0.15% | 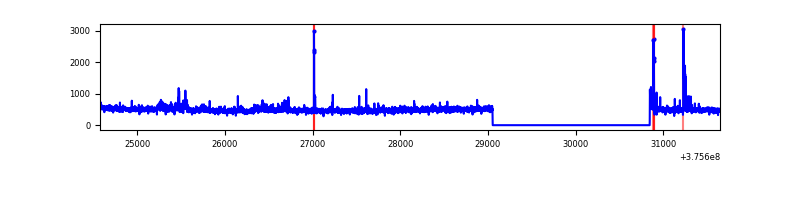 |
| B | 7071 | 5279 | 538 | 538 | 7.61% | 10.19% | 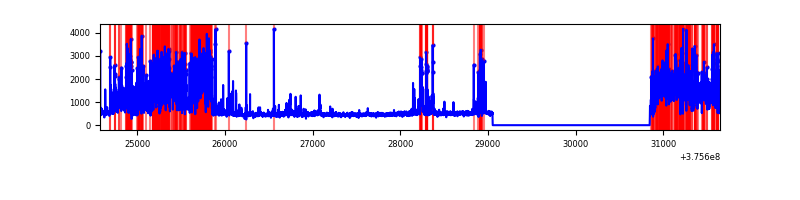 |
| C | 7071 | 5279 | 362 | 362 | 5.12% | 6.86% | 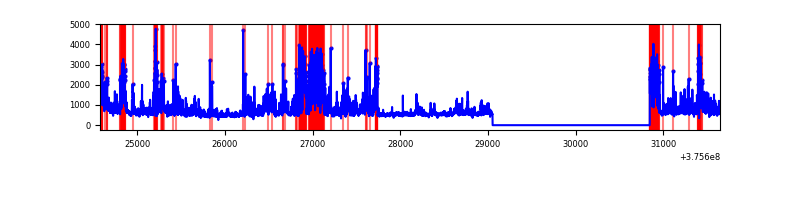 |
| D | 7072 | 5280 | 136 | 136 | 1.92% | 2.58% | 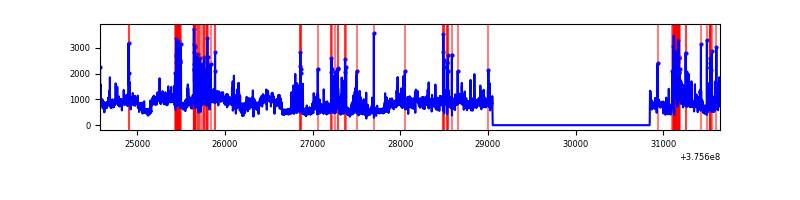 |
Top three noisy pixels from each quadrant. If the there are fewer than three noisy pixels in the level2.evt file, extra rows are filled as -1
| Pixel properties | Quadrant properties | ||||||
|---|---|---|---|---|---|---|---|
| Quadrant | DetID | PixID | Counts | Sigma | Mean | Median | Sigma |
| A | 15 | 169 | 106978 | 843.14 | 629 | 617 | 126.1 |
| A | 12 | 16 | 81076 | 637.81 | 629 | 617 | 126.1 |
| A | 12 | 194 | 17459 | 133.51 | 629 | 617 | 126.1 |
| B | 0 | 219 | 1306767 | 11931.69 | 580 | 566 | 109.5 |
| B | 5 | 172 | 1253075 | 11441.23 | 580 | 566 | 109.5 |
| B | 15 | 85 | 46433 | 418.97 | 580 | 566 | 109.5 |
| C | 10 | 49 | 1241817 | 9284.37 | 585 | 592 | 133.7 |
| C | 1 | 23 | 385627 | 2880.06 | 585 | 592 | 133.7 |
| C | 15 | 214 | 241426 | 1801.44 | 585 | 592 | 133.7 |
| D | 8 | 195 | 1462020 | 9321.38 | 600 | 586 | 156.8 |
| D | 12 | 233 | 492832 | 3139.67 | 600 | 586 | 156.8 |
| D | 2 | 250 | 205986 | 1310.09 | 600 | 586 | 156.8 |
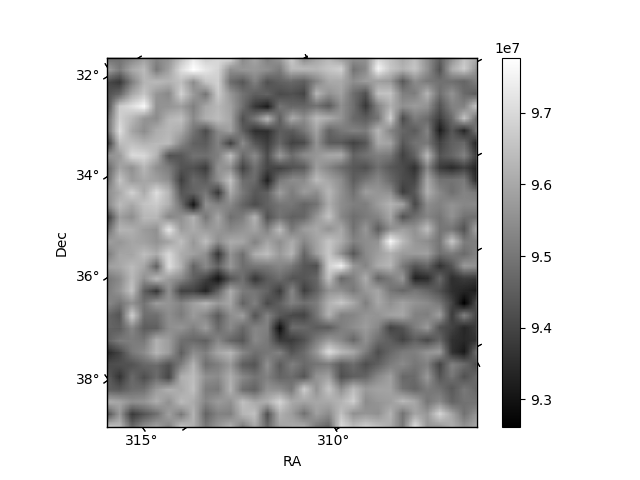
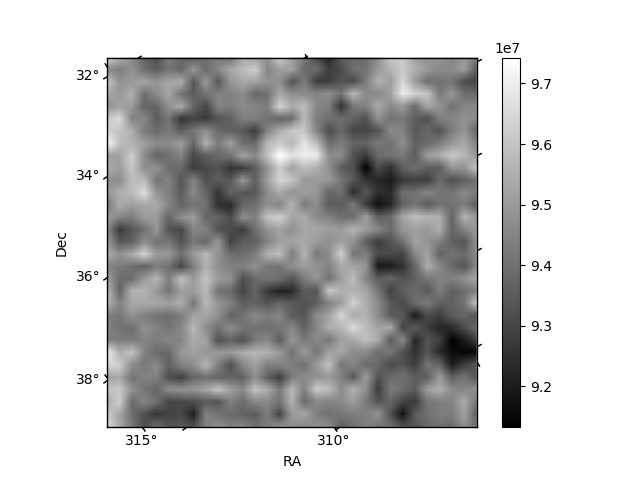
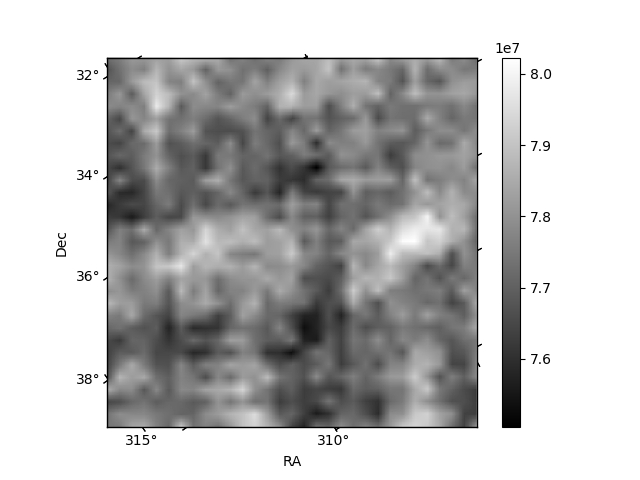
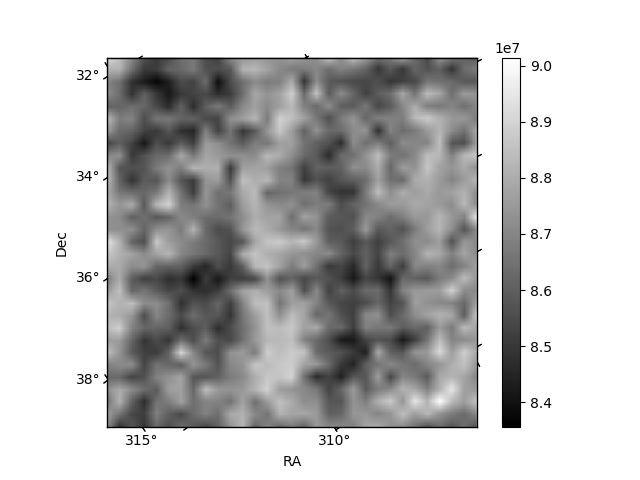
Histogram calculated using DETX and DETY for each event in the final _common_clean file
| Quadrant A | 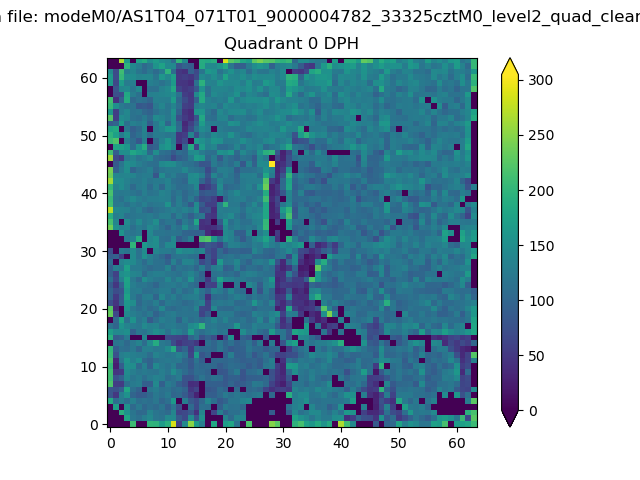 |
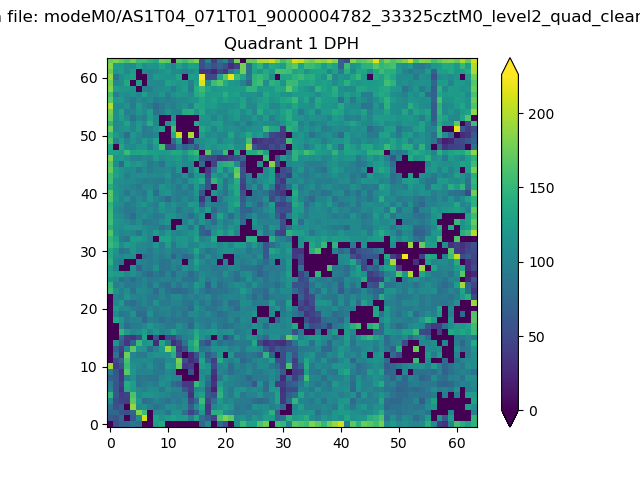 |
Quadrant B |
|---|---|---|---|
| Quadrant D | 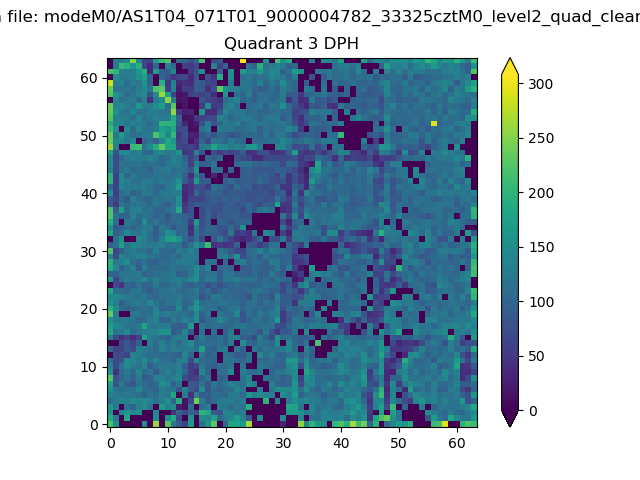 |
 |
Quadrant C |
| Plot type | Count rate plots | Images |
|---|---|---|
| Comparison with Poisson distribution Blue bars denote a histogram of data divided into 1 sec bins. Red curve is a Poisson curve with rate = median count rate of data. |
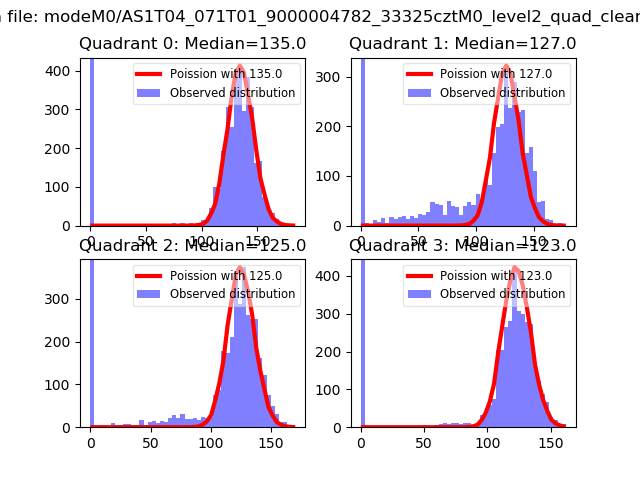 |
 |
| Quadrant-wise count rates Data is divided into 100 sec bins |
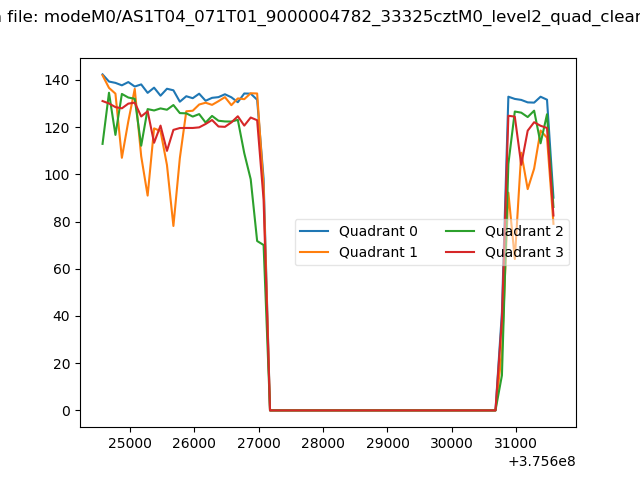 |
|
| Module-wise count rates for Quadrant A Data is divided into 100 sec bins |
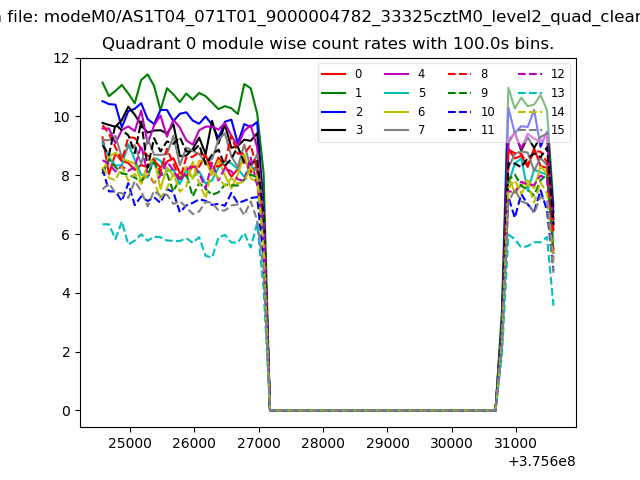 |
 |
| Module-wise count rates for Quadrant B Data is divided into 100 sec bins |
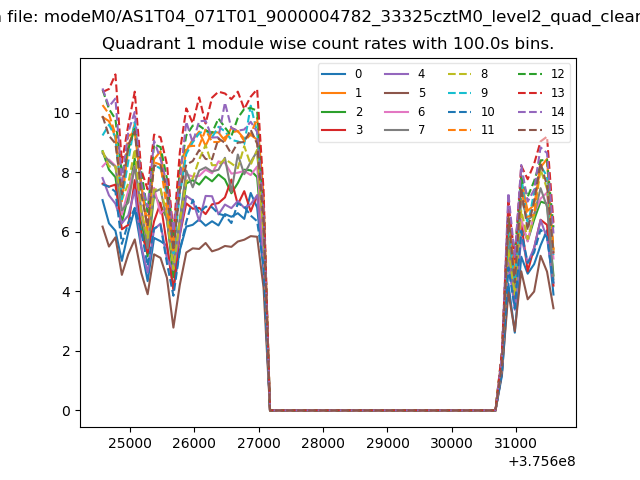 |
 |
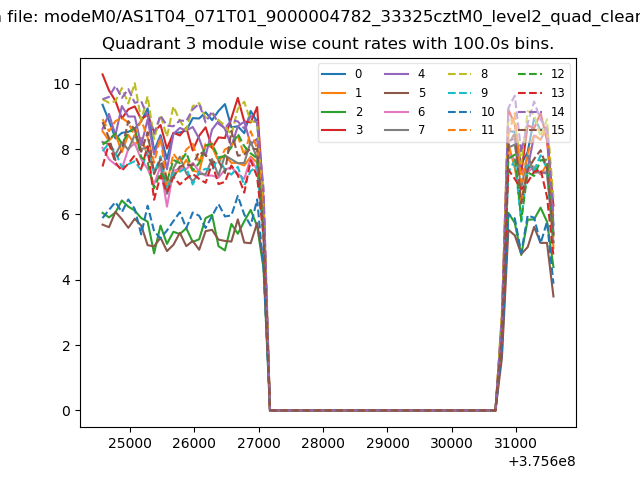
| Module-wise count rates for Quadrant C Data is divided into 100 sec bins |
 |
 |
| Module-wise count rates for Quadrant D Data is divided into 100 sec bins |
 |
 |
| Parameter | Plot |
|---|---|
| CZT HV Monitor | 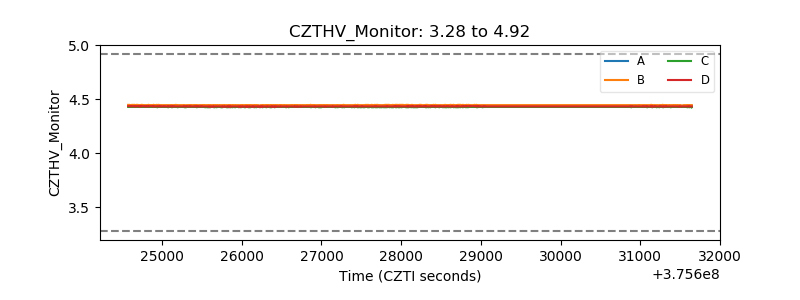 |
| D_VDD | 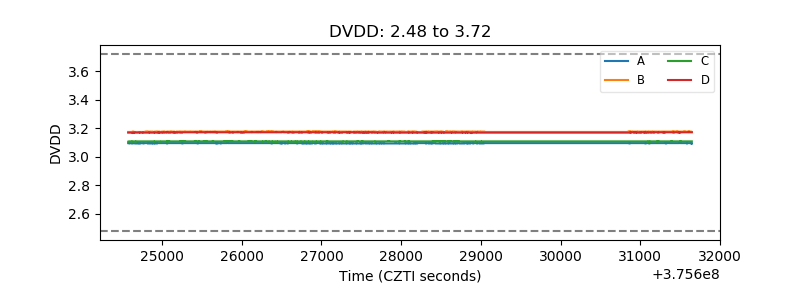 |
| Temperature 1 | 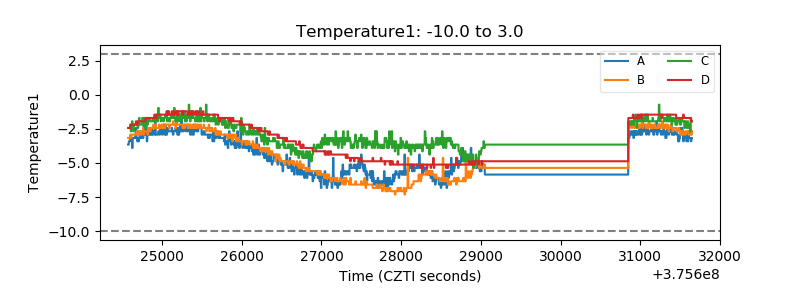 |
| Veto HV Monitor | 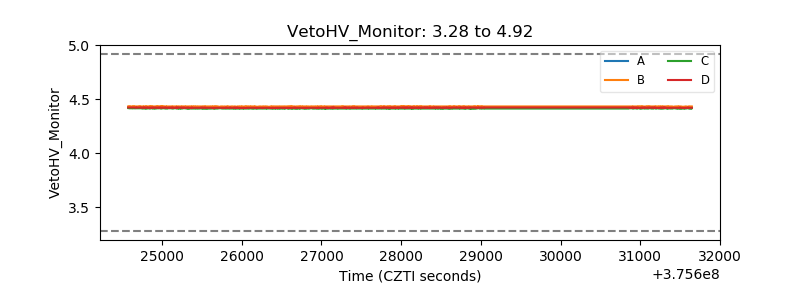 |
| Veto LLD | 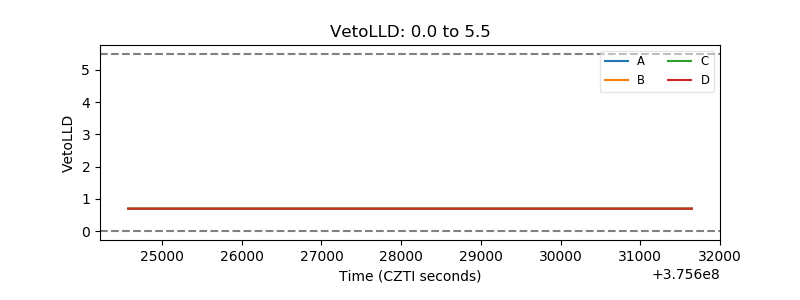 |
| Alpha Counter |  |
| _CPM_Rate | 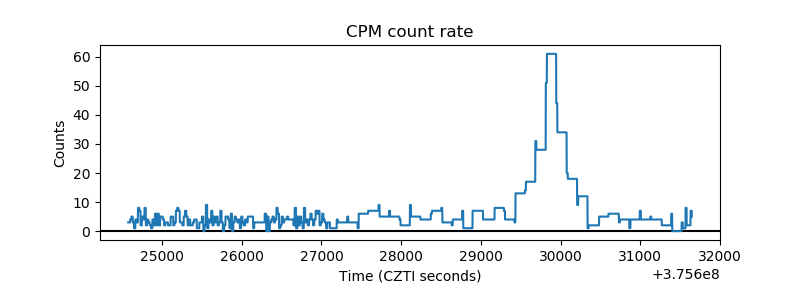 |
| CZT Counter | 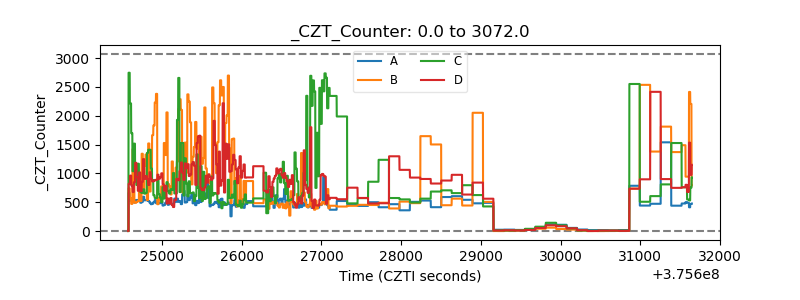 |
| +2.5 Volts monitor |  |
| +5 Volts monitor |  |
| _ROLL_ROT | 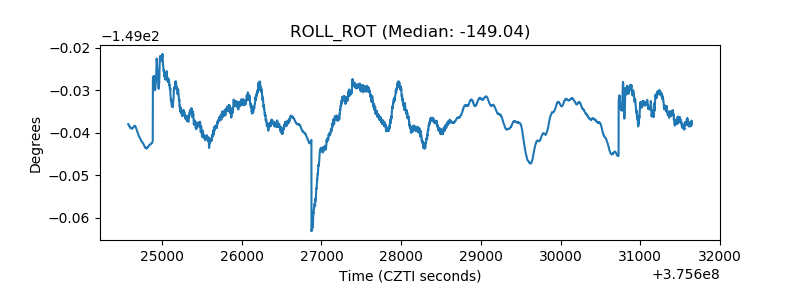 |
| _Roll_DEC | 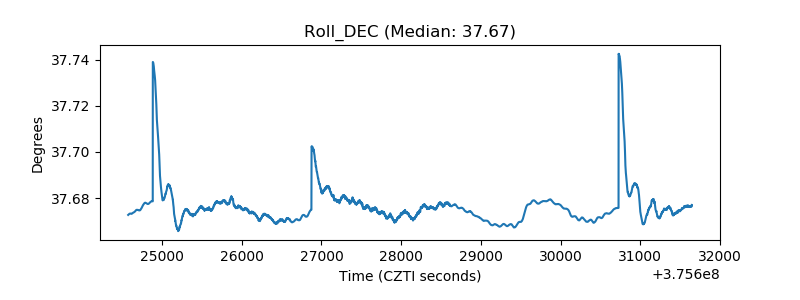 |
| _Roll_RA |  |
| Veto Counter | 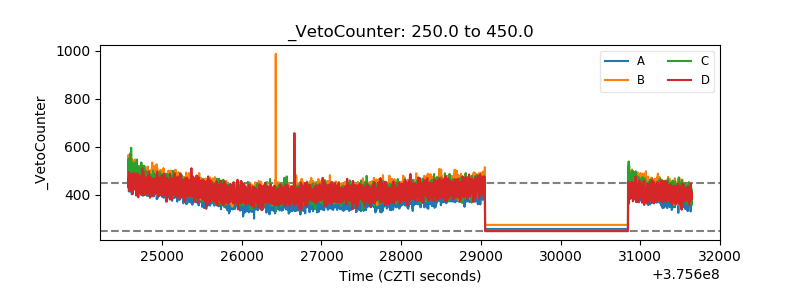 |