| Param | Original file | Final file |
|---|---|---|
| Filename | modeM0/AS1T04_071T01_9000004782_33326cztM0_level2.evt | modeM0/AS1T04_071T01_9000004782_33326cztM0_level2_quad_clean.evt |
| Size (bytes) | 615,024,000 | 69,877,440 |
| Size | 586.5 MB | 66.6 MB |
| Events in quadrant A | 3,291,536 | 459,984 |
| Events in quadrant B | 4,905,371 | 408,584 |
| Events in quadrant C | 4,943,877 | 425,520 |
| Events in quadrant D | 5,100,248 | 422,890 |
| Mode M0 | |||
|---|---|---|---|
| Quadrant | BADHDUFLAG | Total packets | Discarded packets |
| A | 0 | 13382 | 3 |
| B | 0 | 18196 | 2 |
| C | 0 | 18439 | 2 |
| D | 0 | 19148 | 2 |
| Mode SS | |||
|---|---|---|---|
| Quadrant | BADHDUFLAG | Total packets | Discarded packets |
| A | 0 | 116 | 0 |
| B | 0 | 116 | 0 |
| C | 0 | 116 | 0 |
| D | 0 | 116 | 0 |
| Mode M9 | |||
|---|---|---|---|
| Quadrant | BADHDUFLAG | Total packets | Discarded packets |
| A | 0 | 15 | 0 |
| B | 0 | 15 | 0 |
| C | 0 | 15 | 0 |
| D | 0 | 16 | 0 |
| Quadrant | Total seconds | Saturated seconds | Saturation percentage |
|---|---|---|---|
| A | 5697 | 17 | 0.298403% |
| B | 5697 | 873 | 15.323855% |
| C | 5697 | 458 | 8.039319% |
| D | 5697 | 304 | 5.336142% |
Noise dominated data is calculated using 1-second bins in cleaned event files. If a bin has >2000 counts, and if more than 50% of those come from <1% of pixels, then it is considered to be noise-dominated and hence unusable.
| Quadrant | # 1 sec bins | Bins with >0 counts | Bins with >2000 counts | High rate bins dominated by noise | Noise dominated (total time) | Noise dominated (detector-on time) | Marked lightcurve |
|---|---|---|---|---|---|---|---|
| A | 7160 | 5698 | 6 | 6 | 0.08% | 0.11% | 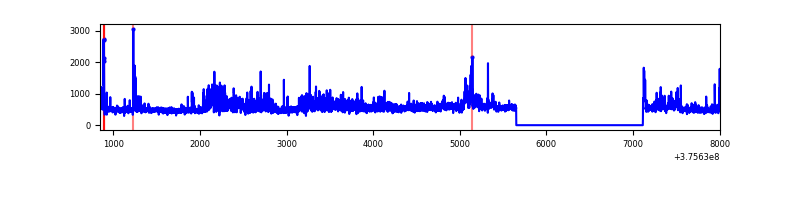 |
| B | 7160 | 5698 | 530 | 530 | 7.40% | 9.30% | 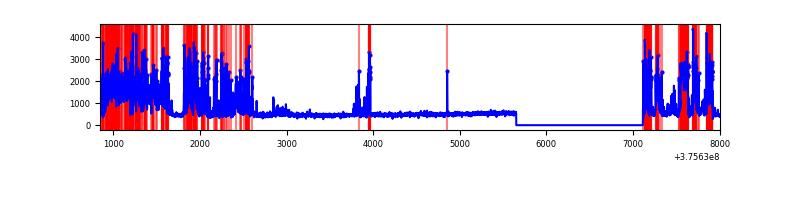 |
| C | 7160 | 5698 | 391 | 391 | 5.46% | 6.86% | 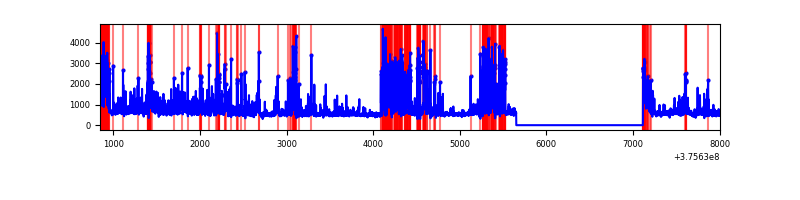 |
| D | 7160 | 5698 | 257 | 257 | 3.59% | 4.51% | 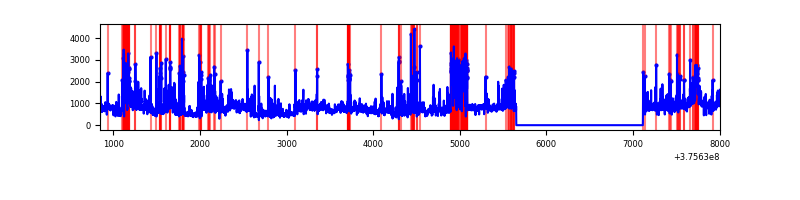 |
Top three noisy pixels from each quadrant. If the there are fewer than three noisy pixels in the level2.evt file, extra rows are filled as -1
| Pixel properties | Quadrant properties | ||||||
|---|---|---|---|---|---|---|---|
| Quadrant | DetID | PixID | Counts | Sigma | Mean | Median | Sigma |
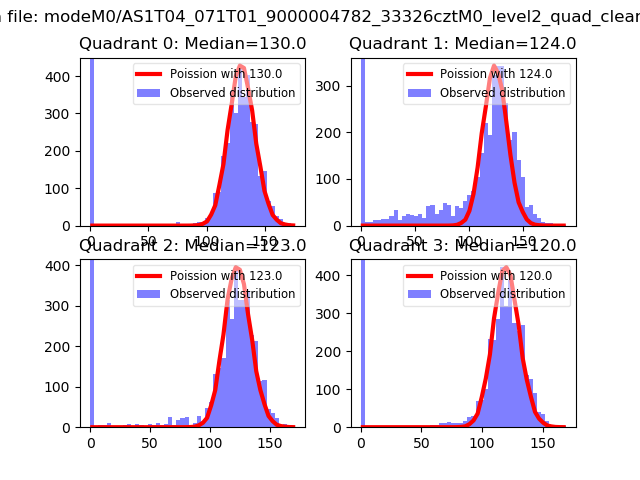
| A | 15 | 169 | 655805 | 4856.49 | 670 | 657 | 134.9 |
| A | 15 | 17 | 38977 | 284.06 | 670 | 657 | 134.9 |
| A | 13 | 254 | 7708 | 52.27 | 670 | 657 | 134.9 |
| B | 5 | 172 | 1426763 | 12014.29 | 627 | 612 | 118.7 |
| B | 0 | 219 | 948676 | 7986.75 | 627 | 612 | 118.7 |
| B | 5 | 200 | 24651 | 202.51 | 627 | 612 | 118.7 |
| C | 1 | 23 | 1133838 | 7839.43 | 626 | 631 | 144.6 |
| C | 10 | 49 | 546831 | 3778.57 | 626 | 631 | 144.6 |
| C | 15 | 214 | 260616 | 1798.56 | 626 | 631 | 144.6 |
| D | 8 | 195 | 1349479 | 8199.31 | 636 | 620 | 164.5 |
| D | 2 | 250 | 325318 | 1973.74 | 636 | 620 | 164.5 |
| D | 12 | 233 | 303469 | 1840.93 | 636 | 620 | 164.5 |
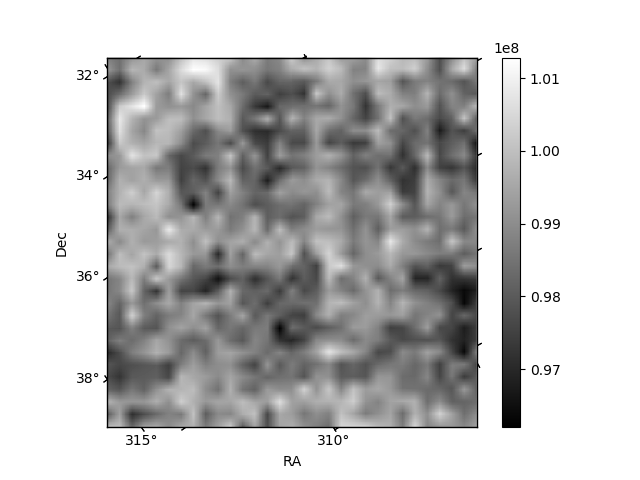
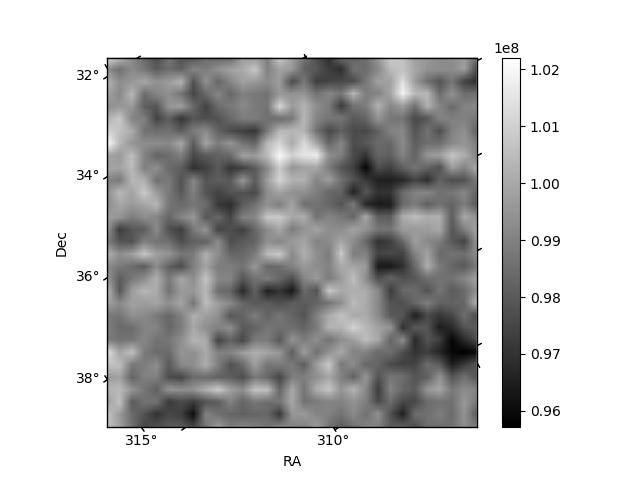
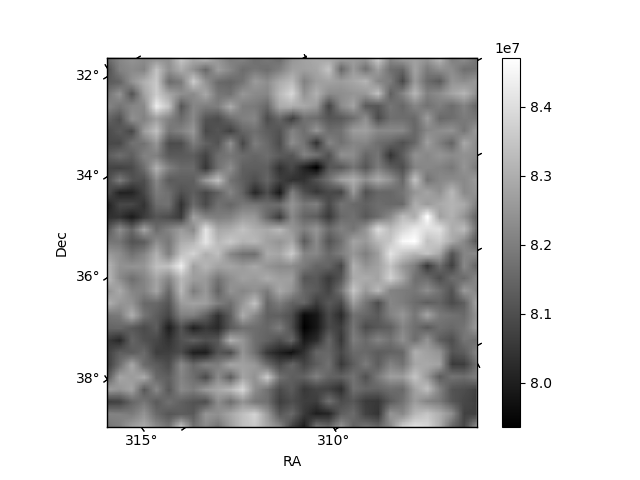
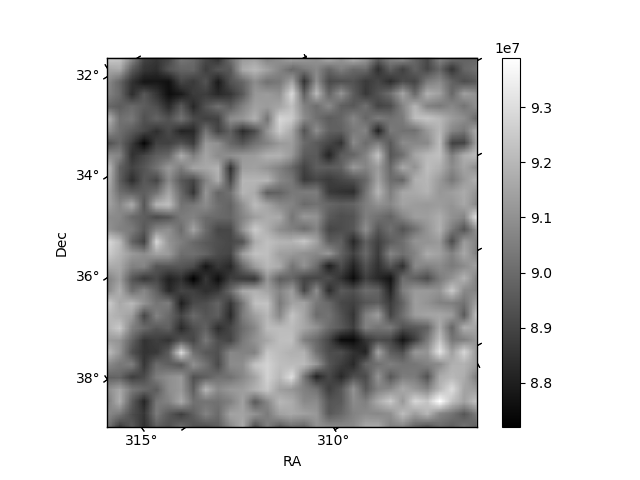
Histogram calculated using DETX and DETY for each event in the final _common_clean file
| Quadrant A |  |
 |
Quadrant B |
|---|---|---|---|
| Quadrant D |  |
 |
Quadrant C |
| Plot type | Count rate plots | Images |
|---|---|---|
| Comparison with Poisson distribution Blue bars denote a histogram of data divided into 1 sec bins. Red curve is a Poisson curve with rate = median count rate of data. |
 |
 |
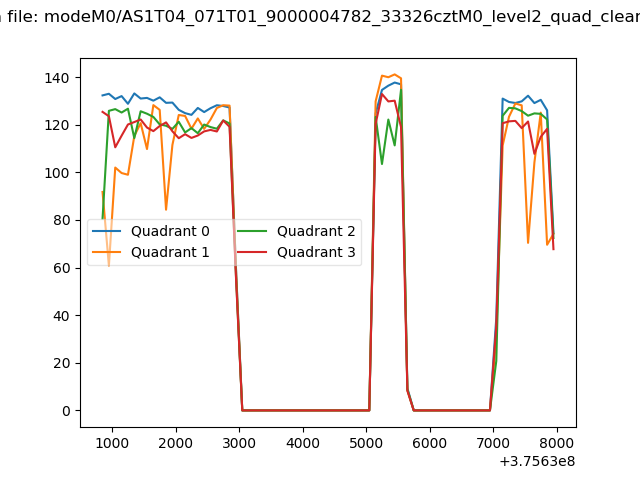
| Quadrant-wise count rates Data is divided into 100 sec bins |
 |
|
| Module-wise count rates for Quadrant A Data is divided into 100 sec bins |
 |
 |
| Module-wise count rates for Quadrant B Data is divided into 100 sec bins |
 |
 |
| Module-wise count rates for Quadrant C Data is divided into 100 sec bins |
 |
 |
| Module-wise count rates for Quadrant D Data is divided into 100 sec bins |
 |
 |
| Parameter | Plot |
|---|---|
| CZT HV Monitor |  |
| D_VDD |  |
| Temperature 1 |  |
| Veto HV Monitor |  |
| Veto LLD |  |
| Alpha Counter | 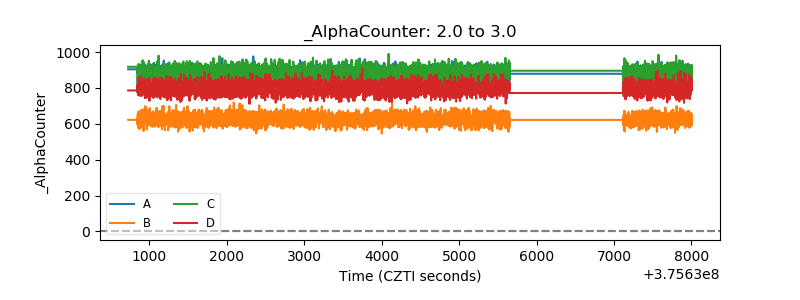 |
| _CPM_Rate | 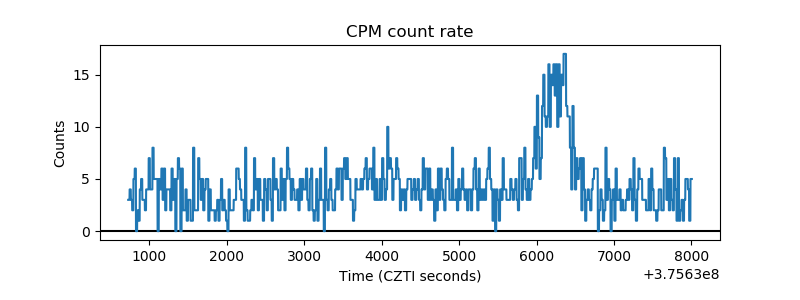 |
| CZT Counter |  |
| +2.5 Volts monitor |  |
| +5 Volts monitor |  |
| _ROLL_ROT |  |
| _Roll_DEC |  |
| _Roll_RA |  |
| Veto Counter |  |