| Param | Original file | Final file |
|---|---|---|
| Filename | modeM0/AS1T04_071T01_9000004782_33330cztM0_level2.evt | modeM0/AS1T04_071T01_9000004782_33330cztM0_level2_quad_clean.evt |
| Size (bytes) | 1,525,743,360 | 168,958,080 |
| Size | 1.4 GB | 161.1 MB |
| Events in quadrant A | 7,496,552 | 1,071,936 |
| Events in quadrant B | 11,713,321 | 980,904 |
| Events in quadrant C | 11,378,862 | 1,017,827 |
| Events in quadrant D | 14,569,302 | 969,241 |
| Mode M0 | |||
|---|---|---|---|
| Quadrant | BADHDUFLAG | Total packets | Discarded packets |
| A | 0 | 32368 | 5 |
| B | 0 | 45041 | 4 |
| C | 0 | 43694 | 4 |
| D | 0 | 54212 | 4 |
| Mode SS | |||
|---|---|---|---|
| Quadrant | BADHDUFLAG | Total packets | Discarded packets |
| A | 0 | 320 | 0 |
| B | 0 | 320 | 0 |
| C | 0 | 320 | 0 |
| D | 0 | 320 | 0 |
| Mode M9 | |||
|---|---|---|---|
| Quadrant | BADHDUFLAG | Total packets | Discarded packets |
| A | 0 | 49 | 0 |
| B | 0 | 49 | 0 |
| C | 0 | 49 | 0 |
| D | 0 | 50 | 0 |
| Quadrant | Total seconds | Saturated seconds | Saturation percentage |
|---|---|---|---|
| A | 15589 | 24 | 0.153955% |
| B | 15589 | 1677 | 10.757585% |
| C | 15589 | 516 | 3.310026% |
| D | 15589 | 940 | 6.029893% |
Noise dominated data is calculated using 1-second bins in cleaned event files. If a bin has >2000 counts, and if more than 50% of those come from <1% of pixels, then it is considered to be noise-dominated and hence unusable.
| Quadrant | # 1 sec bins | Bins with >0 counts | Bins with >2000 counts | High rate bins dominated by noise | Noise dominated (total time) | Noise dominated (detector-on time) | Marked lightcurve |
|---|---|---|---|---|---|---|---|
| A | 19738 | 15592 | 4 | 4 | 0.02% | 0.03% | 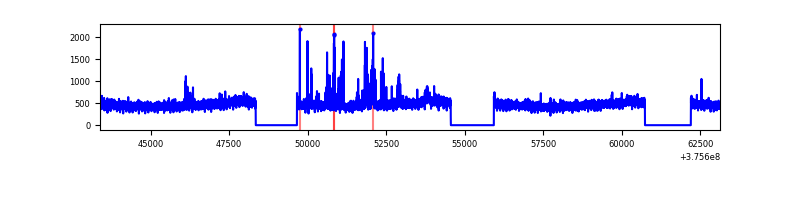 |
| B | 19738 | 15592 | 1036 | 1036 | 5.25% | 6.64% | 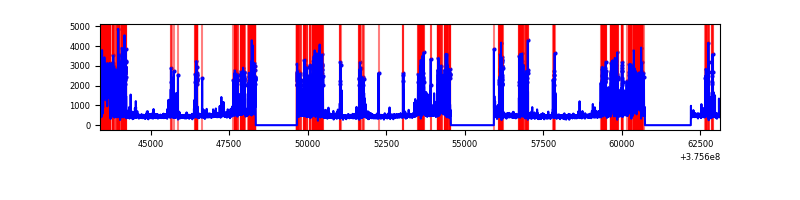 |
| C | 19738 | 15592 | 431 | 431 | 2.18% | 2.76% | 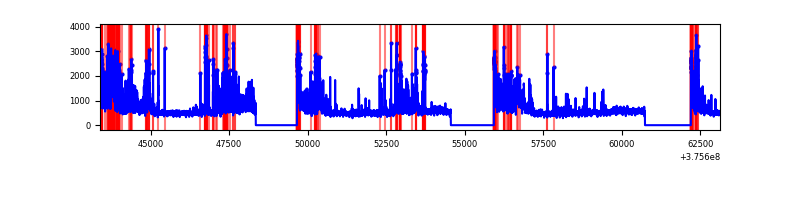 |
| D | 19738 | 15592 | 780 | 780 | 3.95% | 5.00% | 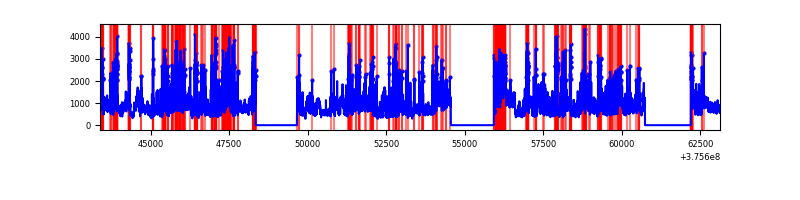 |
Top three noisy pixels from each quadrant. If the there are fewer than three noisy pixels in the level2.evt file, extra rows are filled as -1
| Pixel properties | Quadrant properties | ||||||
|---|---|---|---|---|---|---|---|
| Quadrant | DetID | PixID | Counts | Sigma | Mean | Median | Sigma |
| A | 0 | 254 | 324425 | 877.34 | 1845 | 1804 | 367.7 |
| A | 13 | 254 | 22203 | 55.47 | 1845 | 1804 | 367.7 |
| A | 13 | 6 | 21802 | 54.38 | 1845 | 1804 | 367.7 |
| B | 5 | 172 | 2136342 | 6360.58 | 1756 | 1710 | 335.6 |
| B | 0 | 219 | 1878060 | 5590.98 | 1756 | 1710 | 335.6 |
| B | 5 | 200 | 556060 | 1651.8 | 1756 | 1710 | 335.6 |
| C | 10 | 49 | 2637623 | 6481.16 | 1763 | 1779 | 406.7 |
| C | 15 | 214 | 721018 | 1768.5 | 1763 | 1779 | 406.7 |
| C | 0 | 10 | 408688 | 1000.53 | 1763 | 1779 | 406.7 |
| D | 8 | 195 | 4436485 | 9430.52 | 1732 | 1697 | 470.3 |
| D | 12 | 6 | 944177 | 2004.17 | 1732 | 1697 | 470.3 |
| D | 2 | 250 | 618760 | 1312.18 | 1732 | 1697 | 470.3 |
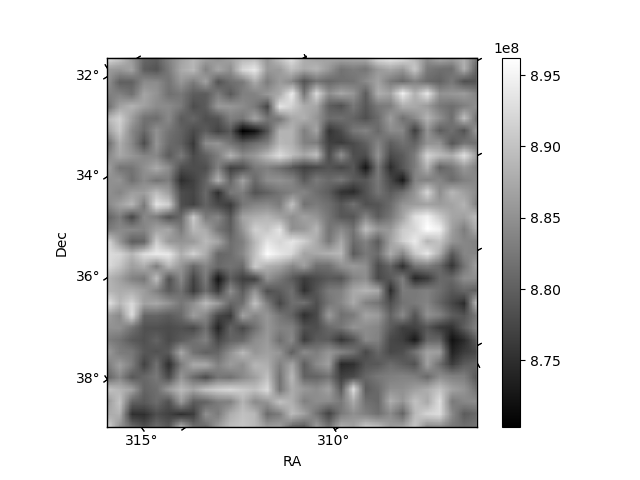
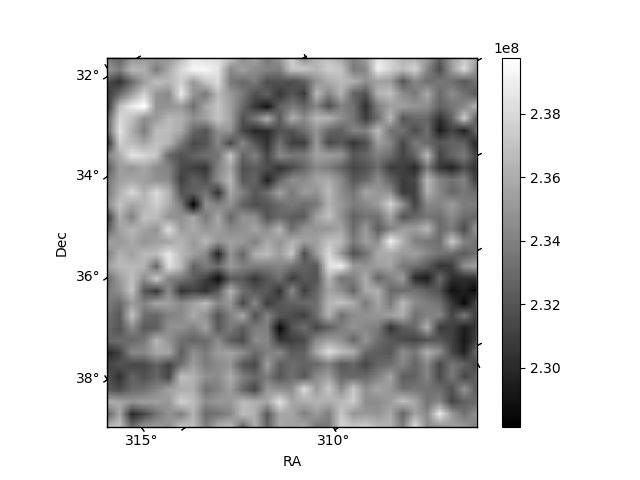
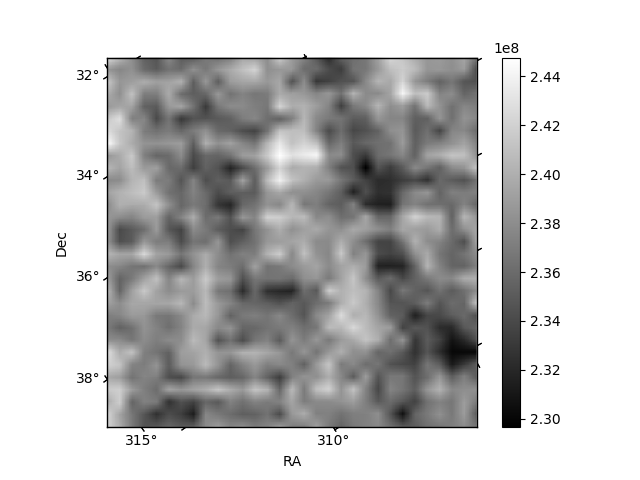
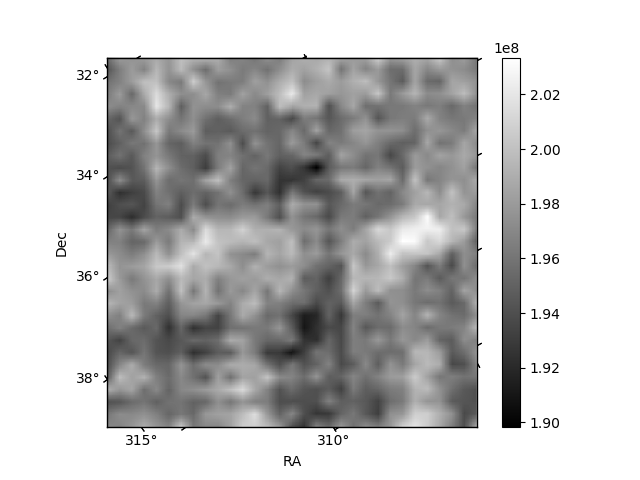
Histogram calculated using DETX and DETY for each event in the final _common_clean file
| Quadrant A | 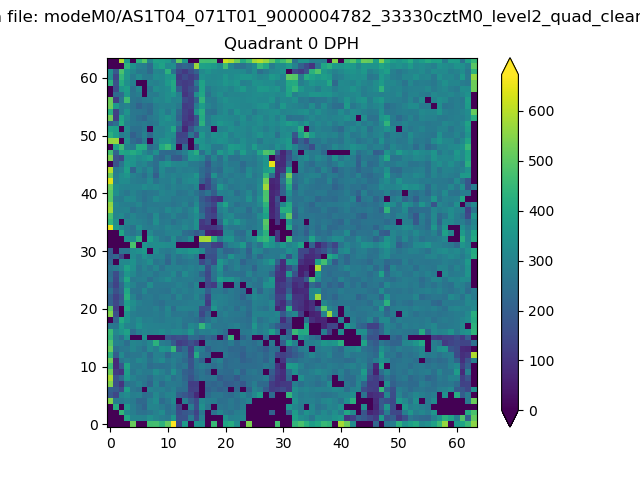 |
 |
Quadrant B |
|---|---|---|---|
| Quadrant D | 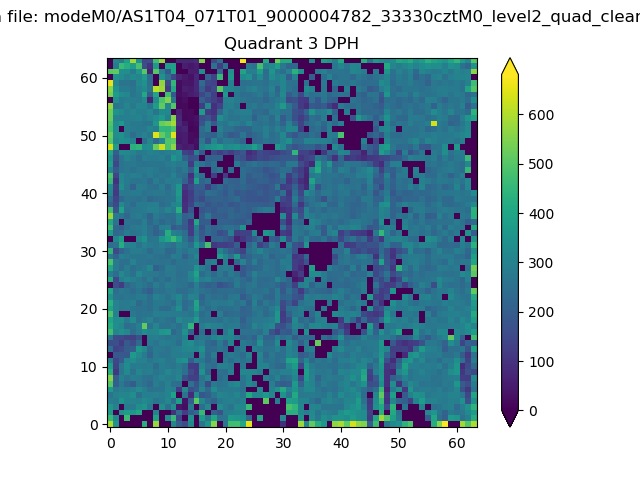 |
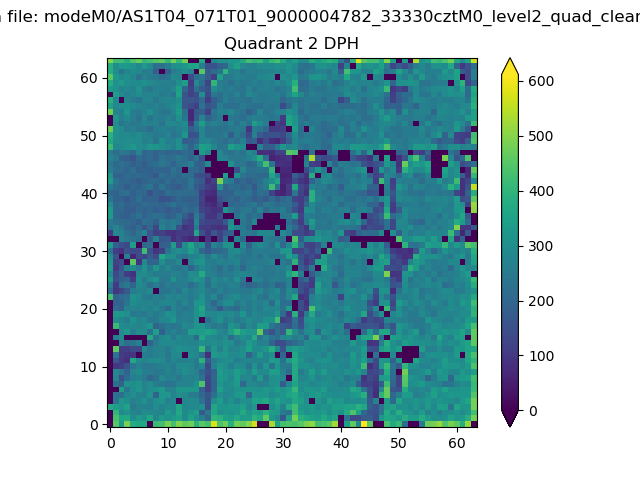 |
Quadrant C |
| Plot type | Count rate plots | Images |
|---|---|---|
| Comparison with Poisson distribution Blue bars denote a histogram of data divided into 1 sec bins. Red curve is a Poisson curve with rate = median count rate of data. |
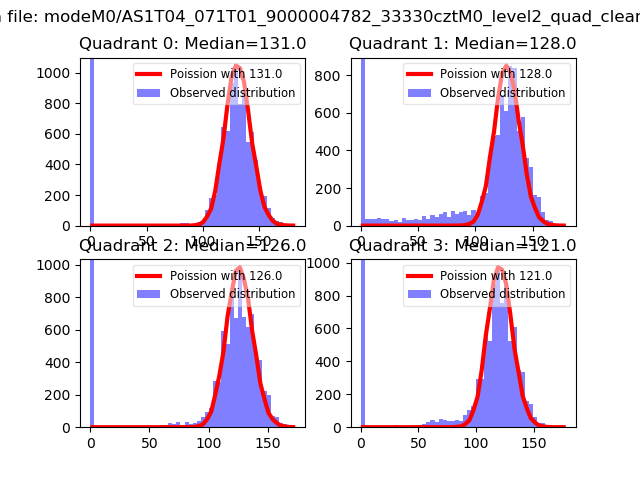 |
 |
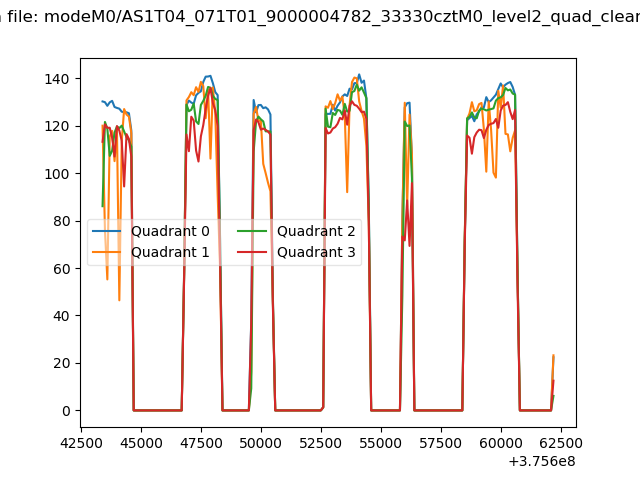
| Quadrant-wise count rates Data is divided into 100 sec bins |
 |
|
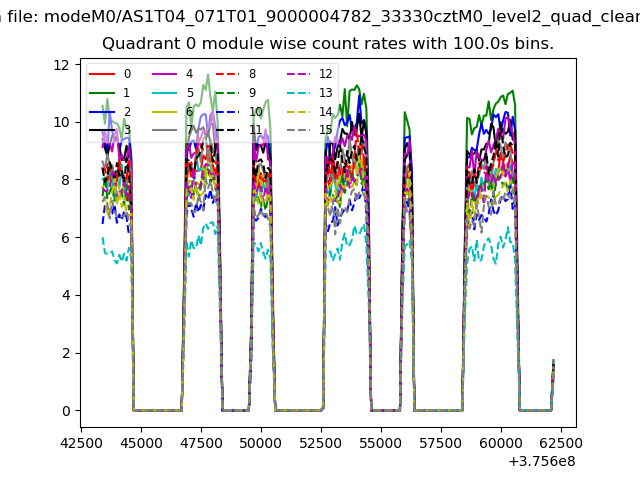
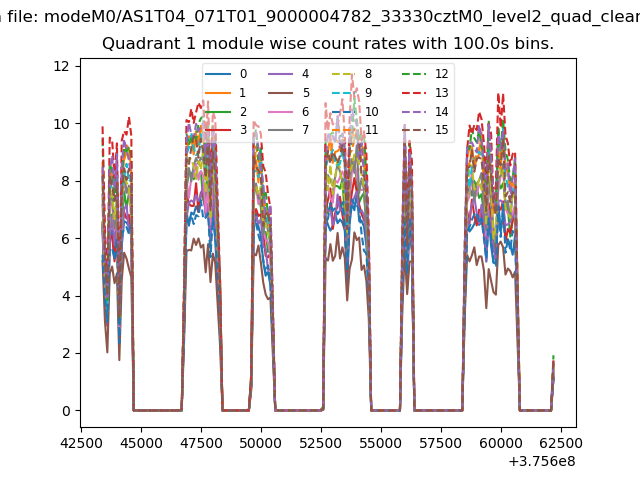
| Module-wise count rates for Quadrant A Data is divided into 100 sec bins |
 |
 |
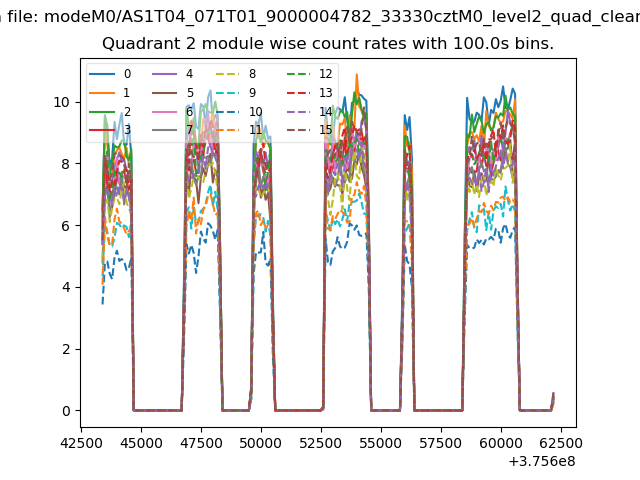
| Module-wise count rates for Quadrant B Data is divided into 100 sec bins |
 |
 |
| Module-wise count rates for Quadrant C Data is divided into 100 sec bins |
 |
 |
| Module-wise count rates for Quadrant D Data is divided into 100 sec bins |
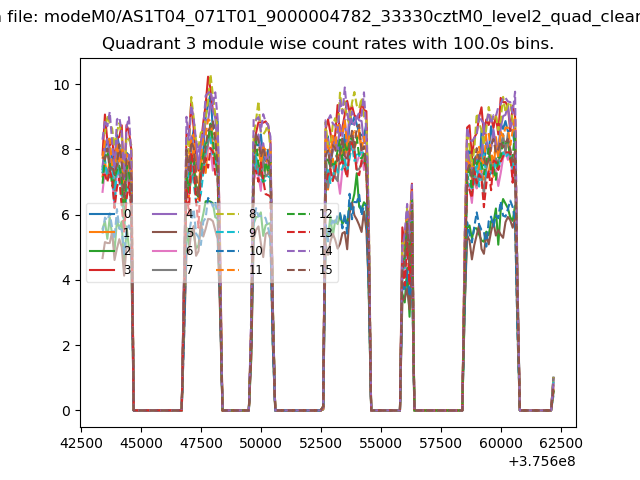 |
 |
| Parameter | Plot |
|---|---|
| CZT HV Monitor | 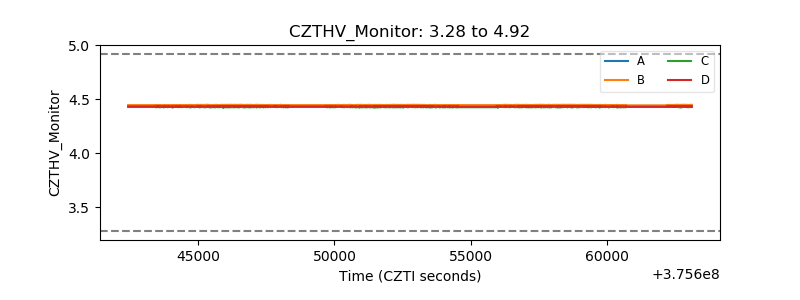 |
| D_VDD | 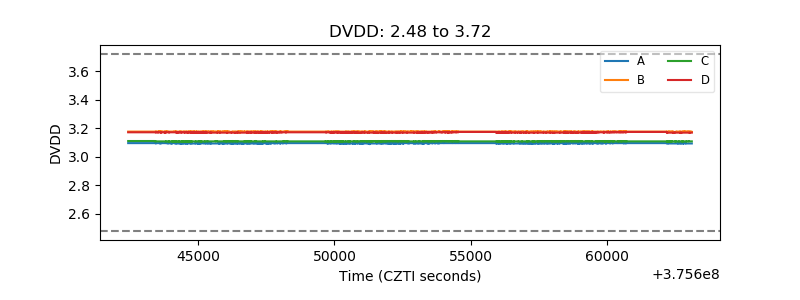 |
| Temperature 1 | 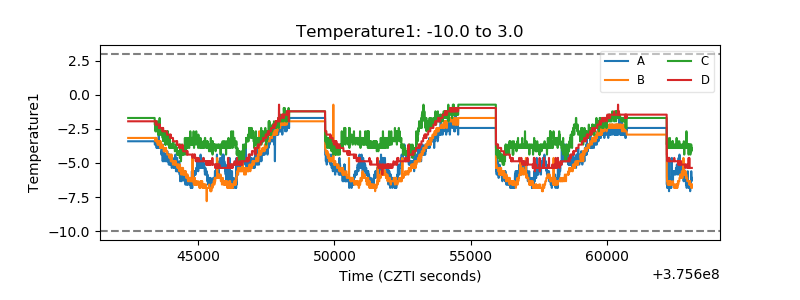 |
| Veto HV Monitor |  |
| Veto LLD | 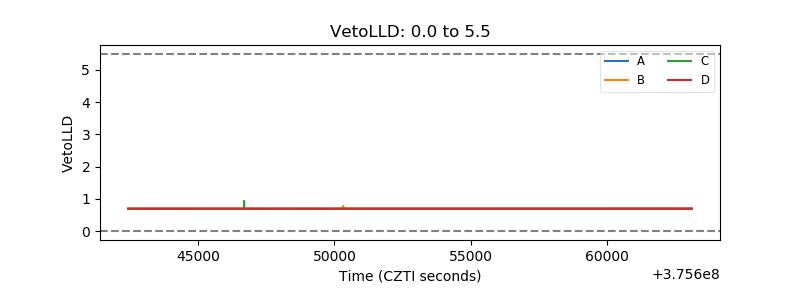 |
| Alpha Counter | 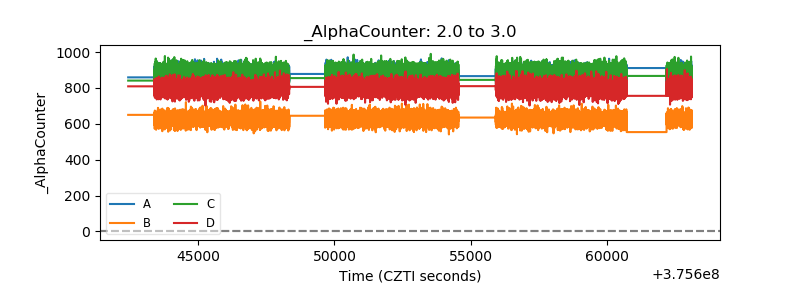 |
| _CPM_Rate | 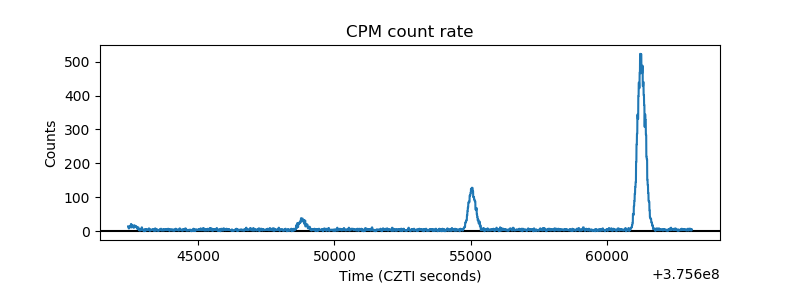 |
| CZT Counter | 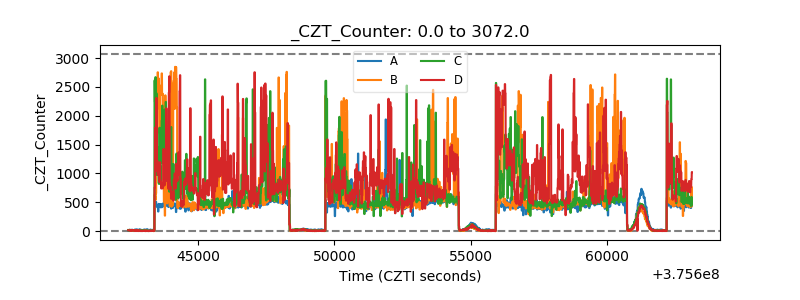 |
| +2.5 Volts monitor | 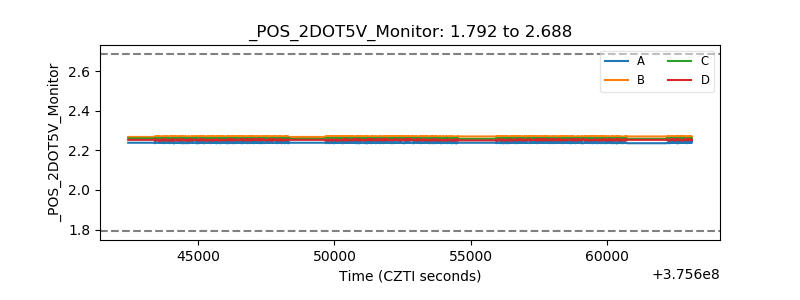 |
| +5 Volts monitor |  |
| _ROLL_ROT | 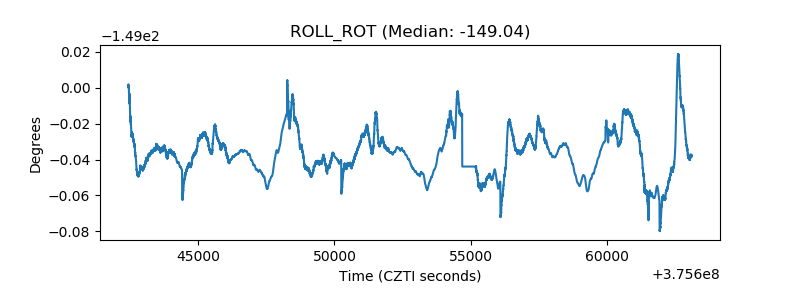 |
| _Roll_DEC | 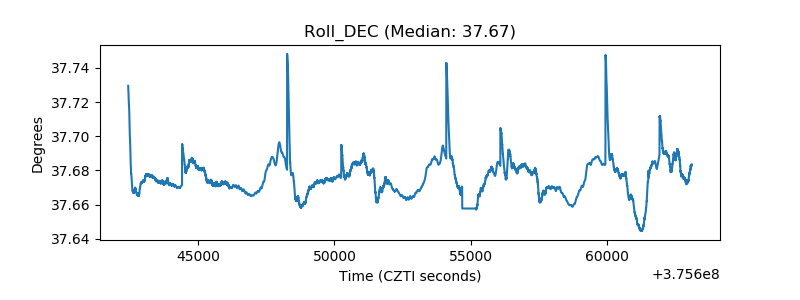 |
| _Roll_RA | 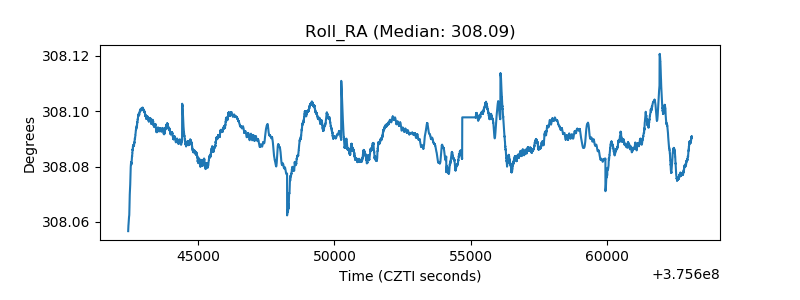 |
| Veto Counter | 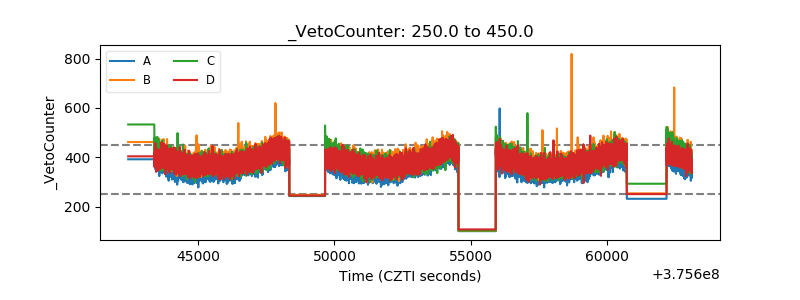 |