| Param | Original file | Final file |
|---|---|---|
| Filename | modeM0/AS1T04_071T01_9000004782_33331cztM0_level2.evt | modeM0/AS1T04_071T01_9000004782_33331cztM0_level2_quad_clean.evt |
| Size (bytes) | 541,589,760 | 54,207,360 |
| Size | 516.5 MB | 51.7 MB |
| Events in quadrant A | 2,602,884 | 326,546 |
| Events in quadrant B | 4,229,318 | 302,272 |
| Events in quadrant C | 3,966,571 | 317,100 |
| Events in quadrant D | 5,222,048 | 300,978 |
| Mode M0 | |||
|---|---|---|---|
| Quadrant | BADHDUFLAG | Total packets | Discarded packets |
| A | 0 | 11333 | 3 |
| B | 0 | 16205 | 2 |
| C | 0 | 15425 | 2 |
| D | 0 | 19538 | 2 |
| Mode SS | |||
|---|---|---|---|
| Quadrant | BADHDUFLAG | Total packets | Discarded packets |
| A | 0 | 114 | 0 |
| B | 0 | 114 | 0 |
| C | 0 | 114 | 0 |
| D | 0 | 114 | 0 |
| Mode M9 | |||
|---|---|---|---|
| Quadrant | BADHDUFLAG | Total packets | Discarded packets |
| A | 0 | 22 | 0 |
| B | 0 | 22 | 0 |
| C | 0 | 22 | 0 |
| D | 0 | 23 | 0 |
| Quadrant | Total seconds | Saturated seconds | Saturation percentage |
|---|---|---|---|
| A | 5634 | 2 | 0.035499% |
| B | 5634 | 625 | 11.093362% |
| C | 5634 | 137 | 2.431665% |
| D | 5634 | 132 | 2.342918% |
Noise dominated data is calculated using 1-second bins in cleaned event files. If a bin has >2000 counts, and if more than 50% of those come from <1% of pixels, then it is considered to be noise-dominated and hence unusable.
| Quadrant | # 1 sec bins | Bins with >0 counts | Bins with >2000 counts | High rate bins dominated by noise | Noise dominated (total time) | Noise dominated (detector-on time) | Marked lightcurve |
|---|---|---|---|---|---|---|---|
| A | 7217 | 5635 | 0 | 0 | 0.00% | 0.00% | 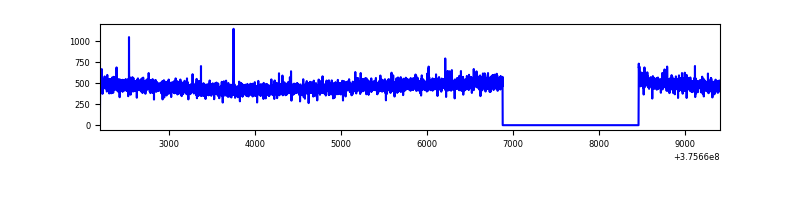 |
| B | 7217 | 5635 | 436 | 436 | 6.04% | 7.74% | 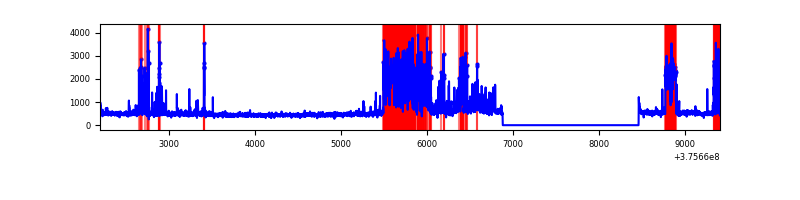 |
| C | 7217 | 5635 | 92 | 92 | 1.27% | 1.63% | 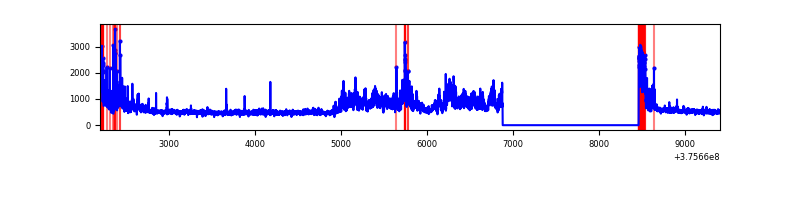 |
| D | 7217 | 5635 | 120 | 120 | 1.66% | 2.13% | 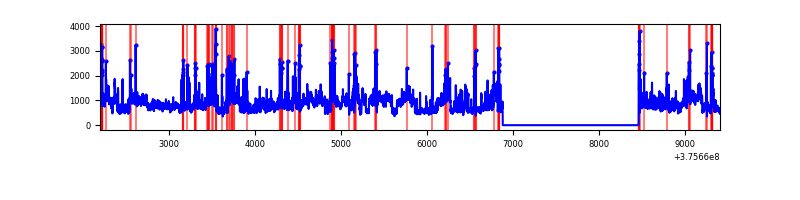 |
Top three noisy pixels from each quadrant. If the there are fewer than three noisy pixels in the level2.evt file, extra rows are filled as -1
| Pixel properties | Quadrant properties | ||||||
|---|---|---|---|---|---|---|---|
| Quadrant | DetID | PixID | Counts | Sigma | Mean | Median | Sigma |
| A | 13 | 6 | 9176 | 63.17 | 671 | 658 | 134.9 |
| A | 3 | 137 | 6644 | 44.39 | 671 | 658 | 134.9 |
| A | 13 | 254 | 6152 | 40.74 | 671 | 658 | 134.9 |
| B | 5 | 172 | 1383385 | 11276.49 | 634 | 619 | 122.6 |
| B | 0 | 219 | 215351 | 1751.14 | 634 | 619 | 122.6 |
| B | 4 | 170 | 91527 | 741.36 | 634 | 619 | 122.6 |
| C | 10 | 49 | 897118 | 5997.55 | 645 | 652 | 149.5 |
| C | 15 | 214 | 262464 | 1751.58 | 645 | 652 | 149.5 |
| C | 0 | 10 | 172224 | 1147.85 | 645 | 652 | 149.5 |
| D | 8 | 195 | 1952271 | 12318.56 | 643 | 624 | 158.4 |
| D | 12 | 218 | 173287 | 1089.83 | 643 | 624 | 158.4 |
| D | 13 | 249 | 164416 | 1033.84 | 643 | 624 | 158.4 |
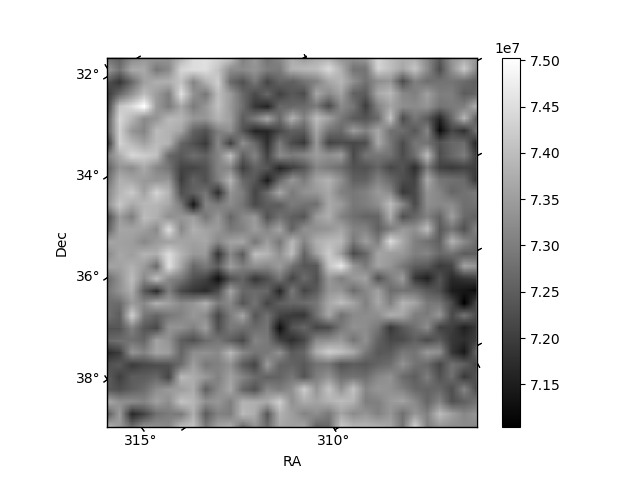
Histogram calculated using DETX and DETY for each event in the final _common_clean file
| Quadrant A | 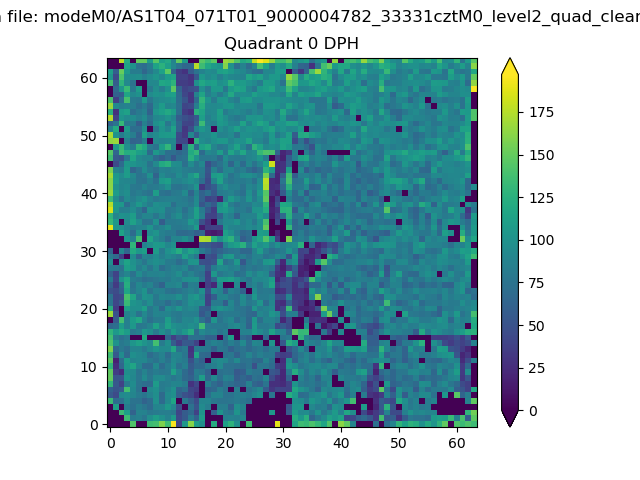 |
 |
Quadrant B |
|---|---|---|---|
| Quadrant D | 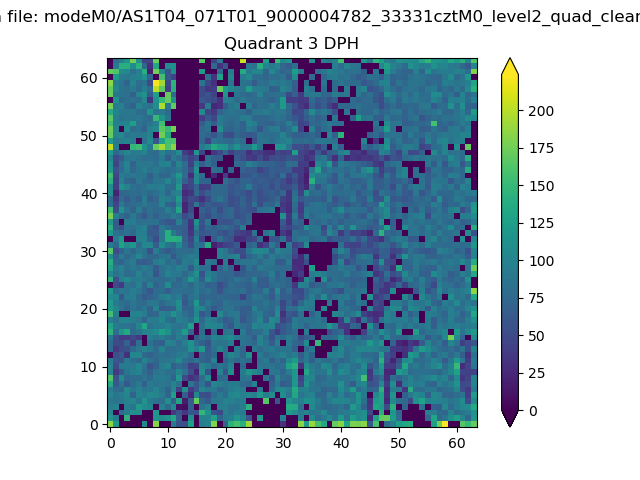 |
 |
Quadrant C |
| Plot type | Count rate plots | Images |
|---|---|---|
| Comparison with Poisson distribution Blue bars denote a histogram of data divided into 1 sec bins. Red curve is a Poisson curve with rate = median count rate of data. |
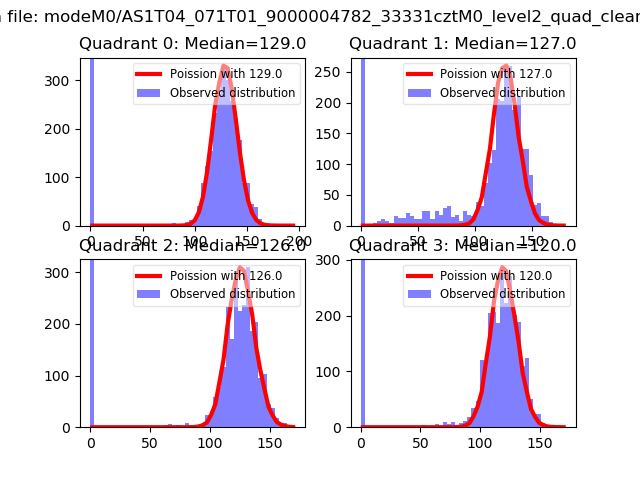 |
 |
| Quadrant-wise count rates Data is divided into 100 sec bins |
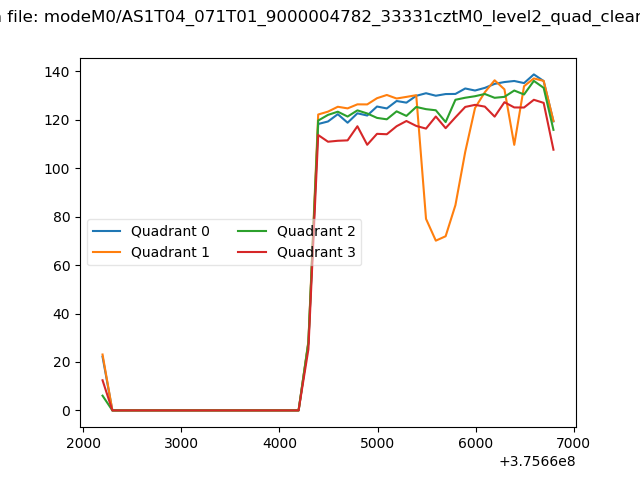 |
|
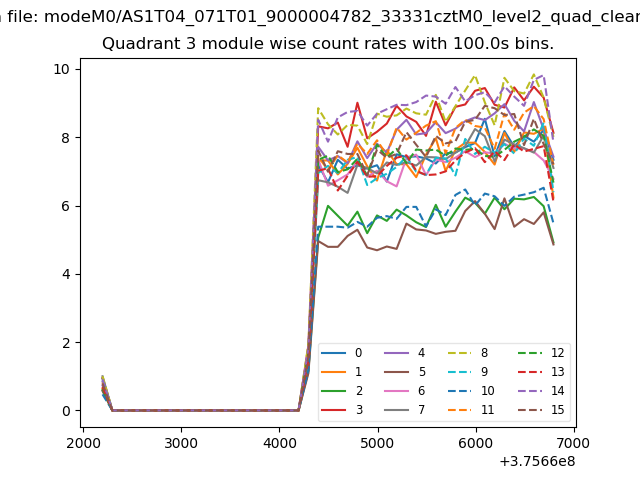
| Module-wise count rates for Quadrant A Data is divided into 100 sec bins |
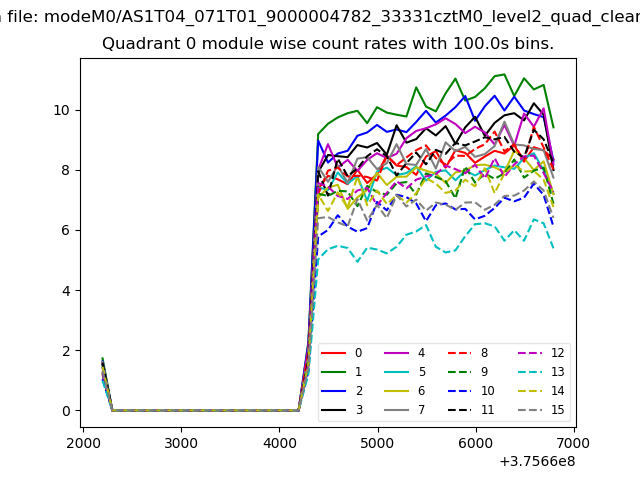 |
 |
| Module-wise count rates for Quadrant B Data is divided into 100 sec bins |
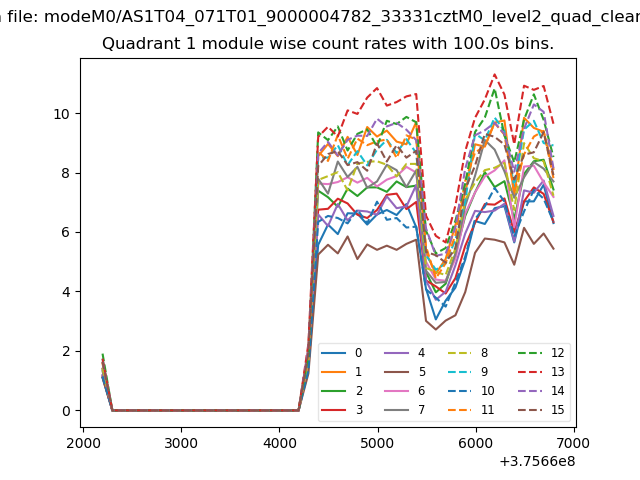 |
 |
| Module-wise count rates for Quadrant C Data is divided into 100 sec bins |
 |
 |
| Module-wise count rates for Quadrant D Data is divided into 100 sec bins |
 |
 |
| Parameter | Plot |
|---|---|
| CZT HV Monitor | 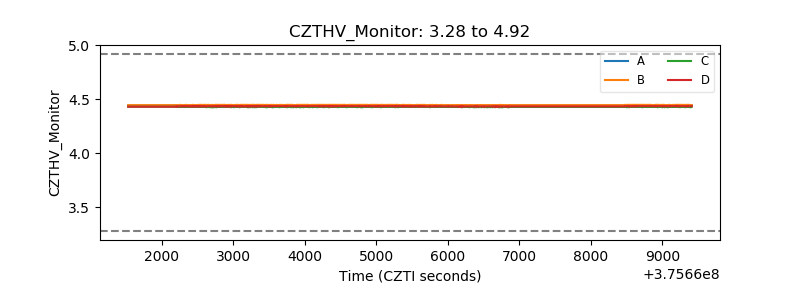 |
| D_VDD | 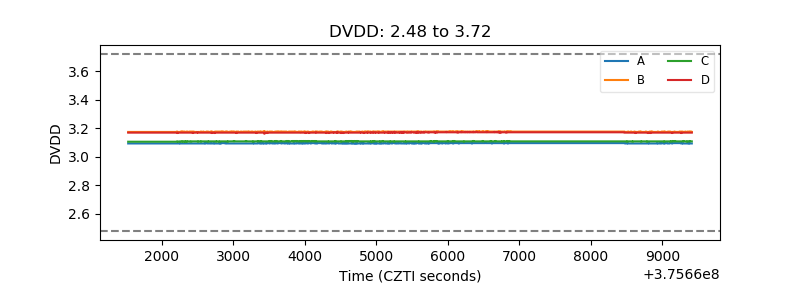 |
| Temperature 1 | 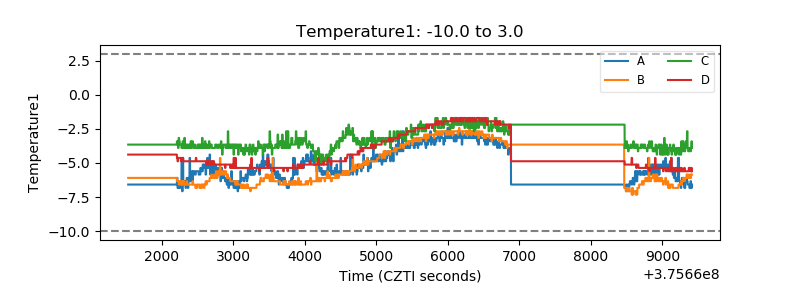 |
| Veto HV Monitor | 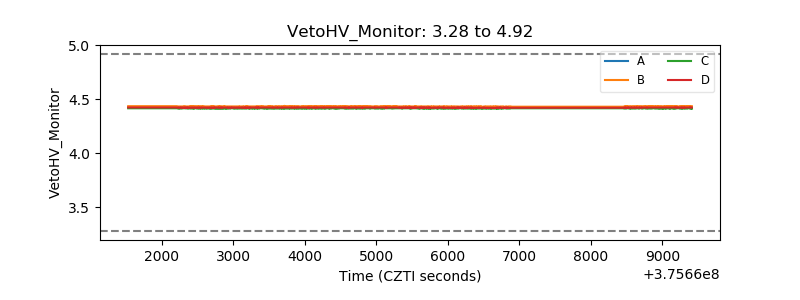 |
| Veto LLD |  |
| Alpha Counter | 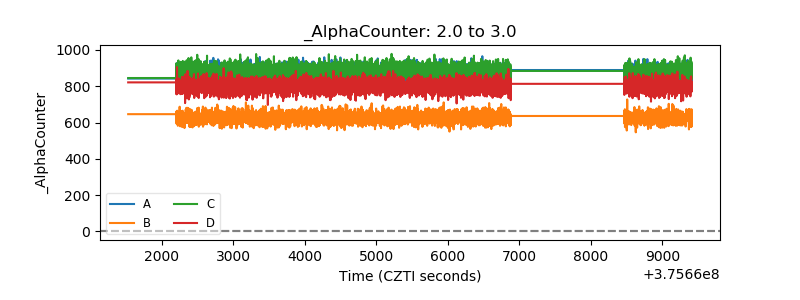 |
| _CPM_Rate | 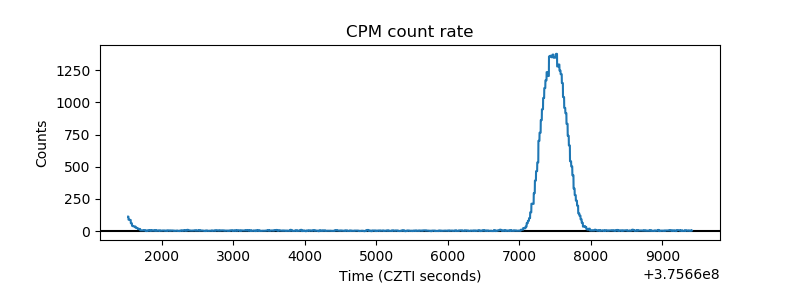 |
| CZT Counter |  |
| +2.5 Volts monitor |  |
| +5 Volts monitor |  |
| _ROLL_ROT | 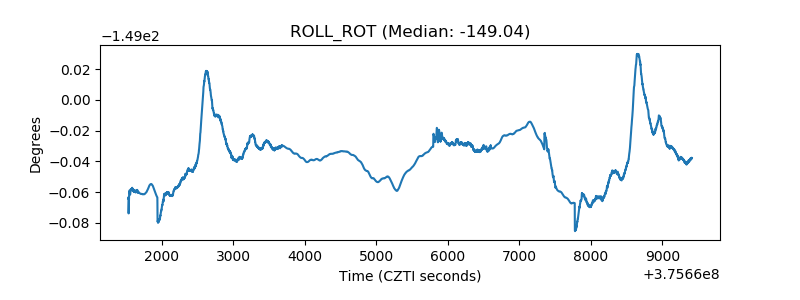 |
| _Roll_DEC | 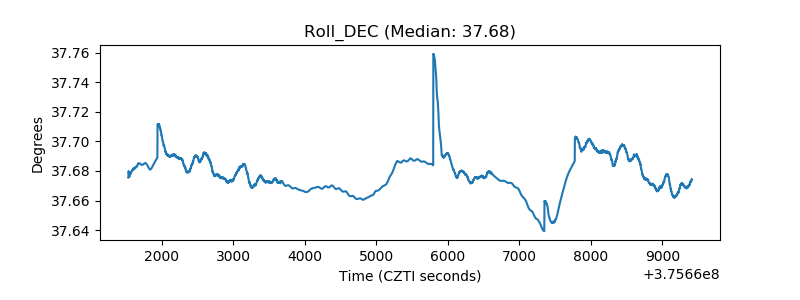 |
| _Roll_RA | 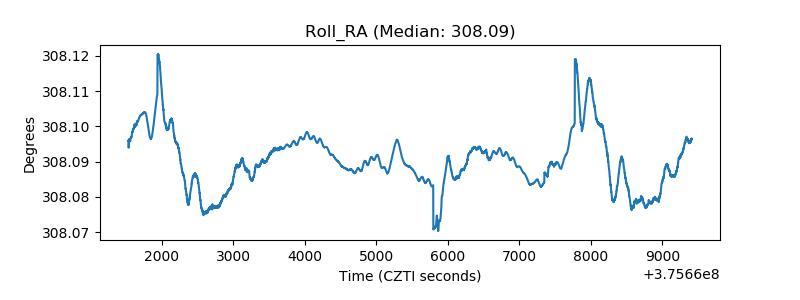 |
| Veto Counter | 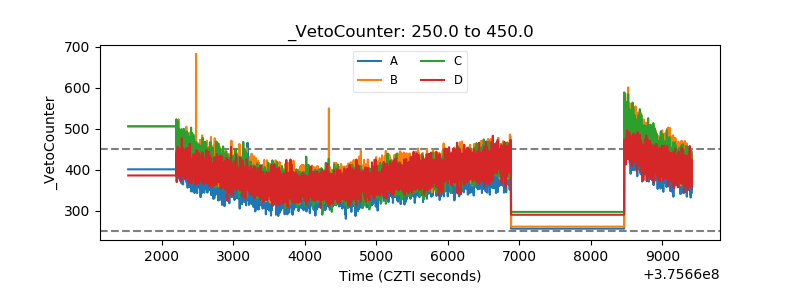 |